Wednesday, April 13, 2011

USO Update

USO's action is making sense.

Remember, USO dropped about 6.5% in a couple of days, there's some incentive to accumulate a position here and it doesn't happen in one day.

 A little distribution on the 1 min chart will keep USO from rising too quickly, allowing the locals to accumulate at better prices.

 The following, 5 and 10 minute charts show that the accumulation process seems to be underway today.

 10 min.

Mision accomplished, locals knocked traders out of their positions and can accumulate UO at a pretty deep discount. Everything here looks normal, I personally would continue to but weakness/pullbacks.

Market Update

It looks like something positive may happen tomorrow, either in pre-market earnings or some announcement/report as there's been improvement in the Q's and the other averages are showing some nice positive divergences.

This may be a continuation of today and run up, perhaps selling into strength as we saw earlier today into the post market earnings tomorrow.

 DIA 1 min positive divergence and confirmation since, actually a little bette then confirmation.

 DIA 5 min is inline with price.

 Here's the interesting chart, the 10 minute with a leading positive divergence.

 The IWM selling strength early this morning, a positive divergence from 1-2 pm and confirmation since.

 IWM 5 min showing a leading positive divergence.

 And the IWM 10 min showing a relative positive divergence at the 1-2 pm area

 QQQ 1 min is actually in a leading positive divergence with a slight negative recently inside the leading positive divergence.

 The 5 min is inline


 And the 10 min is still lagging, but has shown improvement since the last update.

 SPY 1 min in confirmation

 The 5 min is also in confirmation

The 10 min however is in a nice leading divergence.

I doubt too much can happen in the next 30 mins. to destroy the 10 min positive charts, so I'm assuming we'll see some strength again tomorrow, the question will be whether that is sold into as we saw earlier at the opening gap highs, if so, that may send a signal that there may be a problem with the GOOG earnings.

Market Update

The QQQ has been the strongest today in all ways, price/3C so lets take a look.

 1 min 3C chart with some positive divergences that the q's have reacted to.

 However the 5 minute chart can't muster any better then confirmation...

Houston, we may have a problem... The 10 min chart is actually negatively divergent. This looks like a short term pump to me. If things were going to be good or great, why not accumulate? If the 10 min is leading negative, it suggests to me that strength in the Q's is being used to sell short into.

MORE ON WALL STREET'S PULL ON THE JPM EARNINGS

In yesterday's post outlining all of my theory of a JPM beat to raise the markets if only for a day, or even just the gap up which is useful, I said this,

 "I fall back to the Wall Street spin machine and their ability to focus attention on a headline beat, rather then the true discounting mechanism of earnings which is, " What will you do next quarter?"


This simply means, it doesn't matter really what JPM did earning's wise, as long as Wall Street could spin the headlines into "JPM Beats" which they did.


And today's commentary, 


"JPM's earnings beat, sort of. Remember in yesterday's theory post, it wasn't important what JPM really did, what they will do moving ahead, what is important is to spin the headline into a beat to lift the market as no other major companies are reporting that would produce a drag, this way many of the stocks that are inverse ETFs or shorts that we saw yesterday that looked to be in need of a pullback for good positioning, will get exactly that."


Now checkout  this article from Zero Hedge showing the true nature of JPM's release. 


So you see, it really didn't matter what they did because the market had no intention of taking a forward look at JPM today, they released before 8 a.m. and at 9:30 on the open the market gapped up. Wall Street accomplished what it needed to, they got the spin machine working overdrive to show an EPS beat that really has nothing whatsoever to do with reality.


It gave us a chance to pickup some inverse ETF's on a pullback, which was good, and I suspect it gave WS  chance to short into that strength. Two important things moving forward are 1) the chance that this earnings season will disappoint badly and send the market lower and 2) the opportunity to see first hand the corruption and manipulation of Wall Street and finally #3), it is possible to see what Wall Street is up to before they act on it and it is possible to play on the same field.


As for JPM, I think the true nature of rising EPS in declining revenues shows that this release was a bunch of accounting gimmicks. The fundamentals that have shored up primary dealers look like they'll change and what will the banks be left with then? Not much worth buying.

The Earnings Charade Part 2

In an earlier post I mentioned that Wall Street and their actions is like a game of chess. when most traders are looking at what's happening right now, they're planning out into the future. I won't lie, it's a bit difficult to keep up with and to try to get ahead of the game in trying to determine how they are aligning their moves now thinking 4 moves ahead. I've seen this on a much bigger scale, like during the 200o tech meltdown, there was quiet accumulation for a year or more in homebuilders. Honestly, coming out of the tech bubble, most people thought tech would lead the next bull market after the excesses of the dot.com craze were rung out, that wasn't the case. Several years before the housing boom took off, Wall Street was accumulating home builders. Back then a home didn't appreciate very fast, maybe several percent a year, nothing like the triple digit gains some areas saw; so who would have thought? Who would have believed housing was even capable of that? Wall Street knew and knew well in advance.

So on a micro scale, and a faster paced scale, I believe the same is happening in earnings right now. They didn't need JPM to run 5% today, they needed a gap up and I believe it is because the bulk of earnings season isn't going to be very pretty. So today they could easily have used the gap up (and remember yesterday we saw some accumulation in the market and also some great shorts that just needed a little pullback-today gave them that).

So I'm looking forward at tomorrow's earnings, so far the significant finds are HAS pre-market, GOOG and JBHT post market. So if we "assume" that one or most or all of these companies will disappoint, then today would be the day to do some last minute short positioning.

Lets take a look at the stocks reporting tomorrow (you have to bear with me as this is speculative theory, but so was yesterday and that came to pass).


HAS reporting premarket
 Here's the daily for HAS, with a negative divergence in MoneyStream as well as a recent sell signal in STOCH/RSI.

 Here's HAS with no real accumulation sending it higher, so it must be riding the market's coattails, but there is a negative divergence in 3C on this hourly chart, could that be some last minute short selling from Wall Street?

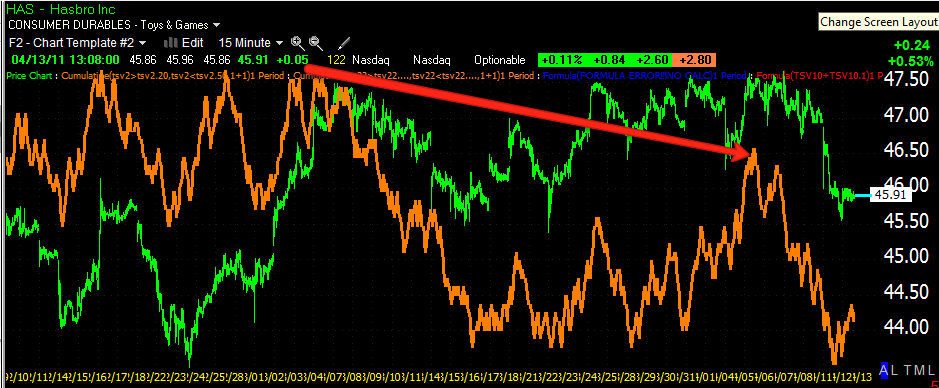
 The 15 min chart also has a negative divergence


On the 10 minute, we can see a quick false breakout right before the plunge started, there was a deep negative divergence there (in the red box) and we have a little positive divergence currently.

Now, I don't know if HAS disappoints and moves the market lower, I suspect the end of day 3C readings may tell us more and give us a better idea. It's possible that HAS does fine and give Wall Street another day to sell short before the GOOG earnings out after market. In general, HAS doesn't look very hot to me, I'm not seeing (at this point) any strong accumulation suggesting a great report.


GOOG-This will be a biggie.
 GOOG is already in a top formation and there's already been a STOCH/RSI Sell signal at the top, which also happened to see a false breakout right before it plunged.

 MoneyStream is negative on GOOG's daily in a leading negative divergence. You can also see the false upside breakout right at the MS divergence.

 GOOG 1 min sees some accumulation and this morning into the gap up, distribution. Again, the question is, whether this is just part of a very short cycle or last minute short selling.

JBHT After Market-JBHT is transports, thus is a vital indicator of the health of the economy. Rising fuel costs can't be good for this one and many sentiment indicators from consumers have been ugly so a bad report here is a good probability, but more importantly will be the forward looking implications. I don't see much to stop the advance of gasoline hitting all time record highs, so there's a good chance JBHT will fall into the margin squeeze category.

 Daily MoneyStream is negatively divergent.

 3C hourly shows good confirmation until April, then it's several negative divergences.


 15 min 3C negative divergences and an interesting one into a breakout high on the gap open this morning.


 The 10 min chart shows the same in greater detail

As does the 5 min, you can really see the breakout gap up this a.m. with a negative divergence.

We'll see what happens, but that's what I'm thinking right now.

BIDU Trade Idea (short)

Bidu reports on April 25 according to Yahoo.

BIDU on what looks to be a false breakout above $143.30, it didn't close strong on the breakout day, it failed the next day and today is just lingering in the area, most likely it'll cross back and forth on the trendline shaking out traders in both directions.

 30 min 3C of BIDU showing a large negative divergence culminating in what appears to be a false breakout (the false breakout component is important because it precedes about 85% of the reversals I've seen.


Here's a 15 minute chart with important support, I want to enter a short on BIDU hen that trendline is broken to the downside, but allow a stop wide enough so any volatility around that trend line won't shut down my position. The potential target is around $115. I have a feeling that EPS and earnings will be downgraded significantly by the time MMM/BIDU report.

MMM Trade Idea (short)

Be aware MMM reports April 26 according to Yahoo.

This is not meant to be a short term or swing trade, but a longer position trade and risk management should reflect that with an appropriate stop that gives the trade some room.


 Here's my Stoch/RSI screen with MoneyStream overlaid on price. There are negative divergences in MS and a top signal in Stoch/RSI. Note the false breakout in the red square in the price pane.


 60 min 3C negative divergences at the top as well as at the false upside breakout just mentioned in the red box.

 15 min negative divergence as well as at the false upside breakout.

 The 5 min chart currently looks a bit weak here as well with a negative divergence.

Here are two potential stops, I prefer the wider stop in this environment.

Any time you have questions on trade ideas, feel free to email me.

BGZ FOLLOW UP

Yesterday I brought you a trade ida in the ETF BGZ, a leveraged inverse ETF on large caps

In that post I showed you the long term outlook and the short term outlook that suggested a pullback and I gave some targets, In my JPM theory post, the market being up today would be good for buying pullbacks in equities like BGZ.

This was the pullback area, between the yellow and blue moving averages. If you like the trade, I would attempt to phase into it if your commission structure allows for that. Any intraday pullback is where I'd want to add.

The same can be said of EDZ and TZA.

PMs Update

Here's yesterday's analysis on GLD/SLv, if you didn't read it, you should before going further.

In a nutshell, SLV has been stronger then GLD for weeks now, there's not much evidence for anything much more then a simple pullback/correction in SLV at the present, the same can't be said of GLD, it does look as if it has bigger problems.

Here's today's action in both:

 Today's price action thus far in GLD is technically irrelevant, it hasn't taken out any meaningful levels.

 GLD's 1 min 3C is in confirmation with this morning's move up, but not leading.

 The 5 min chart is not confirming this morning's move up.

 The 10 min chart remains negative in GLD


SLV
 SLV had a slightly better looking daily, almost taking out yesterday's opening. Right now there's the start of what looks to be a leading negative 1 min divergence suggesting some downside.

 The 5 min chart however is in confirmation of the move

And the 10 min chart is in confirmation of the move. We'll have to see if the 1 min chart will continue to develop and pull SLV deeper into the correction. As for GLD, I think it's a meaningless move thus far.

JPM and the Market

Just to show you how meaningless JPM is, other then the headline "Beat", I want to show you two charts. What JPM did/does is irrelevant, earnings season just needed some good news to juice the market as we were seeing accumulation yesterday. This should tell you something, we saw distribution in AA, accumulation in the market yesterday, Wall Street is run like a chess board with W.S. thinking several moves ahead and I don't know how they can do this without leaks which I think are very real. The AA negative divergences suggest to me that some powerful people knew what was going to happen at earnings, the market accumulation yesterday with JPM being the only significant co. to report today, again leads me to believe that they had this planned out and to do that they need some certainty.

Back to the irrelevance of JPM and this is why I wasn't interested in putting out an earnings call on JPM because it didn't really matter what happened to JPM after the market got it's juice.

 JPM may very well recover a bit here, right now it's at unchanged where it deserves to be in my opinion.

However, once filling the gap, the SPY put in a 5 min positive divergence and is up nearly half a percent. The point was never JPM, it was just a tool.

USO

It's probably about time to start accumulating USO.

 Here's USO breaking the support line, this is where the shakeout of traders would occur (once again because it's so obvious what retail traders will do, it becomes obvious what Wall St. will do).

Need some proof? Here's the intraday chart, look at the volume surge as traders are stopped out and others short as support is broken.

 This was the target published as the pullback started, yellow was the first target, but blue was the most likely target, target met!

 10 min 3C shows accumulation very late yesterday.

15 min 3C which only yesterday was headed straight down, also shows accumulation late yesterday.

I can't say this will be a "V" reversal, they may take this lateral for a bit to accumulate more, but if I'm a fan of USO long term (which I am), I start accumulating now. I'd probably add the bulk of the position or 50% above $42.80 or so.