Tuesday, February 19, 2013

Compare, Compare, Compare

Did you know that's what "3C" stands for? No one indication itself can give you a high probability trade, as much as we have al looked for that Holy Grail of indicators, that can only be found in risk management.

However I do get a lot of charts from members and I'm thrilled to see them thinking outside of the box, making comparisons that I might never have thought of, not all are useful, but a lot of the time there's at least something that can be learned and I think you have to be a lifelong student of the market and look at other people's findings.

One of our member's sent me this chart, you may recognize it or you may not, but I've been showing the same thing in a different format for weeks.

If you click on the image, it should open to a larger view. What he has done is take two currency ETFs, FXE for the Euro and FXY for the Japanese Yen (yellow) and is using them just like you would the EUR/JPY pair that I have been featuring as "trouble" for the market, that is to say that when the yellow line moves up, the Euro is stronger and the Yen is weaker, same principle as the EUR/JPY that I posted even in tonight's last post. Then he added the SPX in green and shows with red arrows on the currency pair showing the reversal of the EUR/JPY to the downside and blue arrows on the SPX (showing it moving up), the effect is a negative divergence and the SPX moves down . He also shows1 positive divergence. Note the pair of currency ETFs he is using, FXE/FXY start an uptrend in August which is supportive of the market and shows a current negative divergnce between the FX ETFs and the SPX right now.

This is the same thing I have been talking about, it's the Carry Trade being unwound.

Here's what it looks like with the FX pair...
 The daily chart starts moving up in August just like his yellow line.

Looking closer, as we enter February the pair is no longer moving up, but is lateral, it's already in a negative divergence with the SPX just as he's shown. This is basically two ways of showing the same thing, except he used the ETFs where as I used the actual FX pair, but his chart is nice in that it shows previous negative divergence between the FX pair and the SPX and what happens next.


EOD WRAP

I'm not sure which way to go with this, I have a lot of charts and data that show a lot of nothing, but that's kind of the point. The other way to go is to just quote a paragraph from Goldman Sachs on today's market; maybe we'll try a little of each. First, the Vampire Squid...

"A solid rally today and new cycle highs for US equities – but that’s where the story stops.No obvious catalyst. No bullish data. European stocks traded well, with most people pointing to a better German ZEW print, but it’s not clear why that would translate into such a strong US trading session. Maybe it’s best though not to look a gift-horse in the mouth."

Yes, it's far better to leverage up and whistle past the graveyard.

OK, GS was right about a few things for the most part, there was no bullish data, what they left out was there was some bearish data, not only that the Shanghai Composite closed in the red for the second day since the week long Lunar New Year Holiday last week, but the PBoC (People's Bank of China) is  (in the articulate words of G.W. Bush-and this is no slam, I spread it all around) "The Bank is turning off the money spigot".

Yes indeed, after 8 months of smaller does of liquidity injections through short term reverse repos, China for the first time in 8 months conducted it's first repo, liquidity draining operation and the reason is quite simple- INFLATION. This is the keyword in F_E_D speak that has the market nervous, "Policy accommodation, blah,blah, blah, WITHIN THE CONTEXT OF PRICE STABILITY", it's the words in bold that have never appeared in a QE program before, which introduces conditionality and even worse, uncertainty. I'm sure you can see how that's much more potentially ambiguous than an amount, a date and that's it.

The one thing US QE (not to mention every other central bank now engaged in the same with currency destruction to boot) has always produced is inflation, in fact it was the US's most significant export to the Emerging Markets and that's why the EM trade everyone talked about a few years ago never got off its feet, inflation and now inflation is running through China so they are dealing with it by draining money from the system.

The US and particularly F_E_D and F_O_M_C members have been quite vocal about it within the last week, some saying that asset purchases should be scaled back, some say they should end sooner than planned, some question whether they are effective at all, most agree they are reaching the point in which the exit from additional purchases at this point will be more painful than any potential good. However most recently the stigma of exiting policy accommodation, which is the really tricky and the most dangerous part is weighing on the minds of F_E_D members. 

Specifically some at the F_E_D are becoming more concerned that when they raise rates which must happen at some point, banks like Wells Fargo will stand to make BILLIONS of dollars in interest from the reserves they have parked at the F_E_D and how that will look to the general public after the F_E_D and government spent so much money (real or perceived as real by the public) bailing out these same banks.

In the FT this week, F_E_D members are concerned that interest payments to the major banks that could run between $50 and $75 billion a year, while at the same time the F_E_D takes losses and stops remitting money to the Treasury is going to look really bad. St Louis F-e-d president, Bullard says the interest the F_E_D will pay these banks will be more than the banks' own profits.

The way the F_E_D pays for QE assets is through creating bank reserves that now stand at $1.6 trillion and if QE3 runs its course, it will add another trillion to the balance sheet. If you want to read more about the story, here's the link to the FT.

My point is not so much any one particular story, whether it be from the first moment I realized they were looking at an exit when they changed the yardstick to an economic based one rather than date based; My point is up until several months ago, we never heard anything other than the F_E_D had our backs for as long as it took and they had more tools they could deploy. 

In the most recent months since QE3 was announced on September 13th and especially when the minute from the September meeting came out, it has become VERY clear that the F_E_D not only realizes they tried and didn't accomplish much, but they are now contemplating how much damage they are doing and what the exit might look like.

Before September, the F_E_D dare not say anything specific with regard to an exit.

This is why in my view tomorrow's January F_O_M_C minutes are crucial and honestly if there was going to be  day to rally the market, it would be today because after tomorrow, lord knows what we will be reading.

Now on to today's market action and some bigger picture portraits...
I'm not going to pretend that today wasn't a strong "looking" day, it was, that's not the point at all and that's not why our recent adjustment to the market has been working so well (short term options in both long and short directions).

Here's the truth of the market, no matter what it feels like, sounds like, what the CNBC headlines or even NBC headlines are...

These charts show the major averages and their percentage moves over the last 3 trading weeks with the 15 day ATR (average True Range) at the bottom.

SP-500
 Over 15 days the gain has been +1.52%, the ATR fell off badly and the daily ranges were very small before increasing a bit, this is why the weekly Calls/Puts that last a day or 2 days are working, there's not a strong trend, more of a drift, but there's enough daily range to make these option trades worthwhile and I'm a believer in taking what the market gives for as long as it gives it.

NASDAQ 100
 The NDX has gained 1.42% over the last 15 days and 1.31% total for the year, but there's been enough volatility in the chop to make some nice, quick double digit returns.

R2K
 This one has been doing the best at +2,66%, but the Russell 3000 with 1000 more larger stocks has only done 1.71% over the same period, this points to the smaller, "On Sale" stocks, there are many other measures of this showing the same, whether Equal Weighted Indices or the NASDAQ Composite outperforming the larger component stocks of the NASDAQ 100, this is part of the Cats and Dogs concept mentioned last night.

Dow-30
Returning less than a percent over the last 3 trading weeks, but enough up and down chop to make our short term tactics work. In all cases the ATR has fallen way off, making this approach more difficult, but the only one that really seems to be paying off.

There are recent changes as well in currencies that have been supportive of the market and right around the same time, I peg most of them at Feb 1.


 The Euro (ornage) vs the SPX (green), these normally move in sync together.

 Since Feb. the EUR/USD has been making lower highs and lower lows, previously it was in a clear uptrend.

Around the same time, Feb 1, the $USD starts making higher highs/higher lows.

There are a number of other important currencies doing the same, here are a couple of the most important...

EUR/JPY
 The daily chart shows a supportive trend for the market in the pair, something started changing around the start of Feb.

 The pair is making lower highs and lower lows, this isn't obvious in the market, or maybe it is as the market has transitioned from a clean uptrend to a more lateral drift with much more subdued performance.

USD/JPY
 On the daily chart there's a clear trend here too, the weak Yen was very helpful to the market.

Now the pair is moving laterally.

As to today's internals, the thing that stood out the most was the Dominant Price/Volume Relationship, which saw 3 major averages all share the same relationship out of 4 different possibilities...


 The Dow -30

 NASDAQ 100

S&P-500

In each case, the component stocks that make up the averages had a dominant relationship of nearly half of the index, the relationship was price up and volume down, out of the 4 possible price/volume relationships, believe it or not, this is the most bearish and often leads to a 1-day overbought condition with the market down the next.

Another event that stood out was the advance of the CBOE's SKEW Index...
Recently the SKEW was in the December/January highs area, the last several days it has taken off to the upside. The reason the CBOE created the SKEW was to try to predict unpredictable events, I know that sounds strange, but it is basically a Black Swan or Market Crash indicator with higher readings placing higher probabilities on such an event occurring. The normal historical range is 115, Black Swan events have taken place from 130-140, the index rarely moves above 145.

With the FX market changes, the Credit market changes, more or less any risk asset except for equities moving toward less exposure or protection, I have no problem keeping established shorts open, sticking with several long positions, some I think will be stronger for longer than others and skimming double digit returns from the market as long as we can so long as the general tone continues to be something like this....
 If the ATR contracts much more the risk:reward pat-off will deteriorate, but if that happens we'll be moving to a different area in the market and make adjustments as needed. 

While the masses look at the headlines, "New 5-year high in the S&P and Dow", I'd much rather keep track of reality and reality is these 5 year highs are almost akin to a drift in the wind while the assets that hold a market together all fall by the way side.

I'd think the F_E_D would have been much more careful in their deliberations at the last meeting just as the policy statement sounded, so I'd expect the minutes to be more mellow than the previous minutes, but with all the F_E_D talk over the last week of policy end-game, we might be in for a nasty surprise.


Correction: "The VIX held up well until the last minute"-NAY, SCRATCH THAT, THE LAST 9/10THS OF A SECOND

This year, really since late last year, Wall Street has found a new way to ramp/manipulate the market, they seem to have stumbled on it when the debt ceiling fiasco was resolved and hedges for the current month (back then), were rolled forward. Instead of buying AAPL or the most heavily weighted stocks in a particular average, the target was the VIX.

Today the Vix didn't seem to have that manipulation, in fact it either held it's expected correlation or performed even better, at least until the last minute of the day, OR THEREABOUTS....
This is why I said it held up well, at point "B" we have a higher high in the SPY than point "A", yet the VIX has a higher reading at point "B" than "A" which is against the natural correlation for the most part and much different than some of the VIX manipulation sen over the last month.

 But then.... A plunge in what appears to be the last minute of trade in the VIX, but upon closer inspection...
The "Plunge" was actually the last 9/10ths of a second and that's because that's the smallest time increment I have, I'm sure NANEX could trace it to the last one/one millionth of a second, which may explain why the ETFs like VXX, UVXY and XIV were totally unaffected.

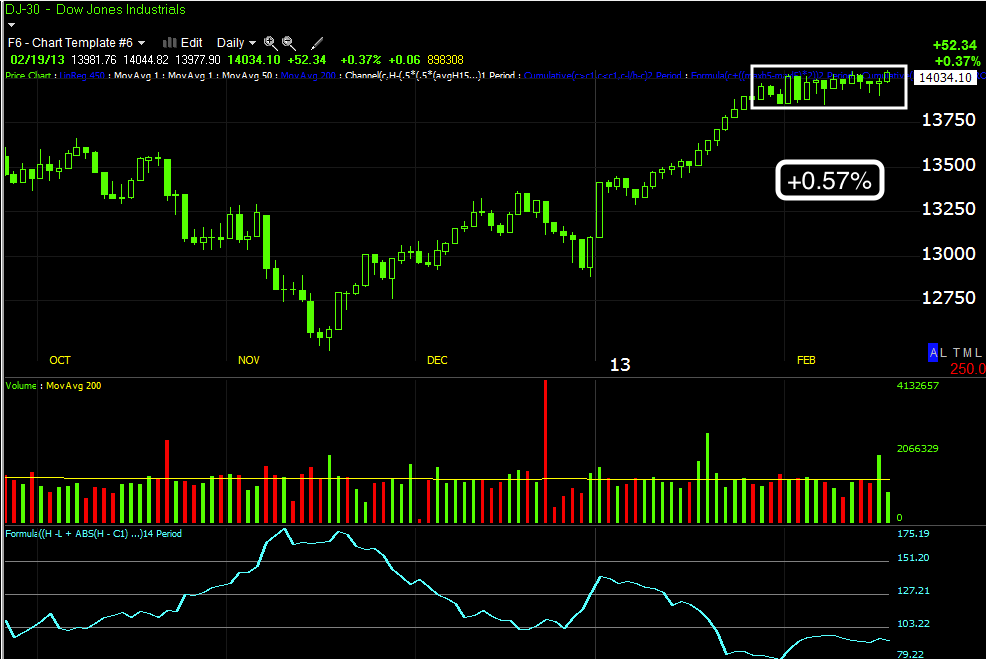
In any case, UVXY is trading higher than the opening of the position, about 6 cents away from the entry.

I'm going to update the charts and daily scan data and I'll report back, I heard from so many of you who took the UNG trade and made decent money on it today and I'm very happy for all of you.

I think if you use options in a way they weren't designed to be used, you can actually do pretty well with them. I think it's only when you hear the stories of the 400% gains that you start playing options like a lotto ticket and rather than take advantage of the leverage they have to offer to make a so-so trade a great trade, you end up turning in to a speculator or gambler.

More coming soon, just have to update the scans and daily data.


Quick Market / SPY Update

 SPX futures 1 min negative all day

 5 min SPX negative-leading

 SPY 3 min longer term trend

 3 min close up-remember where this went south when you look at the tick chart below.

SPY 5 min in a relative and leading negative.

The TICK could have easily made new highs with the SPY, +1250 or even +1500 is seen or use to be seen frequently. Toward the last hour lots of testing of the sub-zero levels.

What is also interesting is the VIX/VXX/UVXY have held up much better than they normally would on a day like today.

UNG Follow Up

I'd prefer get the charts out to show you why first, but volatility is so sensitive that the time it takes to get the post out can mean a pretty sizable difference in the fill.

The long UNG equity position is still open, I just feel the short term probabilities are leaning more in the direction of slight pullback in which case the trade can be run all over again for another 25+% in a couple of days.

Here's the final position...
We have the ticker,  description, size, cost basis, current, change, market value. P/L and % P/L

The fill was at $1.10 so it's 26.44% on top of the earlier 25% and this is about 2 days of market exposure.

Here's why...
 1 min intraday in a leading neg. position, this can lead to a consolidation like today, but...

 The same negative as seen from 1 min to the 5 min and everything in between, this suggests a short term pullback and there is the gap below.

At 10 min we are still leading positive so with an option that long you could ride out the pullback, but if the probabilities look higher, why not just take the profit, open a new position if you want to at better price and do it again?


Decided To Close Rest of UNG Calls

AAPL Follow Up

I don't see the edge in a day trade in AAPL at this point, but  for anyone who might have, that's 6 points at 10-30x leverage for a Reg. T compliant day trading account, that's a pretty nice day, personally though, I gained a sense of self-preservation around age 30 and those kinds of trades, of which I use to make well over a hundred a week some weeks (my broker loved me, even knocked my commission down), now kind of turn my stomach.

 The intraday positive that was there early is gone-1 min.

 That holds true out to the 3 min, all intraday timeframes.

 Interestingly the 5 min, the first timeframe that moves out of intraday trade, is still positive as is the 10 min below.

As mentioned earlier, this is where the divergence stops, no 15 min positive.

This is part of why I chose SPY calls over QQQ as there has been rotation among the averages and the Q's are certainly due vs the others.

However one other scenario that might be interesting would be a double bottom in AAPL. I have little doubt that anything that looks like decent price strength will see continued Hedge Fund selling, but that may be what they are up to, I still think it's too early to say.


AAPL Day Trade is Done

More to come

SURPRISINGLY UVXY IS HOLDING

A picture says it all...
Right at the entry at $8.88

SPY Weekly Spec Put-Feb 22 $153

SPY puts, expiration Feb 22, 2013 w/ a strike of $153 SPECULATIVE SIZE POSITION

SO FAR UVXY IS HOLDING

It's at the exact entry price despite the SPX.

I'll probably be taking a closer look now at the SPY weekly options on the Put side. As usual, I'll let you know.

Taking on a Trading/Spec Position in UVXY long

I'll wait until closer to the close to decide on weekly puts, they are at a nice discount right now.

Market Thoughts/ More on Silver

I'm really so close to pulling the trigger on a SPY or QQQ weekly put, the concern I have is an EOD ramp and the general feeling of being rushed to make a decision, which often makes me just pullback and tell myself, "If you miss this, there's another bus right behind it, patience wins", I think that's more responsible than rushing in to something out of greed

We are lucky enough to have a copy of last week's McClellan Report re: Silver


CONTEXT/Futures

 The Context model for S&P Futures hit an even lower dislocation of -16 not too long ago, very dislocated.

 SPX Futures 1 min intraday not looking good here at all.

 The 5 min is still very negative, it may lead to a 1-day weekly option trade in SPY or QQQ

 NASDAQ futures 1 min intraday looking pretty bad as the market charts...

5 min NASDAQ futures, this is about where we were taking put trades in weekly QQQ's and doing so well with them, I'd prefer to wait until closer to the close to make that decision.

For UNG Option Longs

It's your choice, I think UNG pulls back a bit here, it can be used to enter a new position if you want to take the remaining off the table, I decided to just let it run, but obviously it's preference.

Market Upate

Meanwhile... as the TICK trades in a very tight +/-500 range...

 DIA 5 min leading negative in the flat range.

 IWM 10 min w/ a large relative negative and a new leading negative low

 QQQ 2 min leading negative

SPY 1 min leading negative

Silver Follow Up

I don't believe or support anything beyond a short term change in character, I see no evidence to support a position trade here, it looks like a short term change in character, pretty strong as well, but for me if there's any trade (as most of you know howSilver is my least favorite asset to trade or analyze), it's short term and I think needs some leverage, maybe a leveraged ETF or a call.

Again, just because of past experience with Silver and the manipulation there, I'd keep risk at VERY speculative levels.

 Support at two levels nearly the same was taken out today, there's the possibility of a "Hammer" Closing candle which is a short term (at least) bullish reversal.

 As you see in the past at extreme breaks of the Bollinger bands, we typically see some snap back.

 3 min chart goes from in line to positive

 5 min chart does the same, it's the consistiency of the in line readings that change to a positive that are kind of the big deal here.

Even the 5 min Silver Futures is showing a positive divergence at this break below support, right where there's lots of supply and cheap prices.