Monday, March 28, 2011

Window Dressing and T+3 settlement...

This week, Wednesday precisely, marks the end of the quarter. So before quarter's end we usually see window Dressing or the "Art of looking smart" as managers get rid of dogs that didn't perform and buy leaders that did, even if they only held it for a week before quarters end, their prospectus will show "XYZ winner" as a stock in their portfolio for the previous quarter and prospective clients can look at "XYZ winning stock" and come to the conclusion that this fund was in the right place with asset allocation, it's a real scam, but it happens the most at year end, then quarter end and even at month's end as more funds are reporting to clients monthly results.

What is T+3? Here's the official explanation from the SEC In essence, it means the last day for these transactions to take place to make stocks appear or disappear from the fund's portfolio would be today.

Which brings us to this afternoon's sell-off and volume.

 As you can see by the daily closing volume, today's volume was weak

However, at the end of day when Wall Street is most active, take a look at the volume, a huge increase. Had volume been similar to the last hour all day, we'd have more then 2X the closing volume and to make matters more important, the volume up until the close, had it held today's trend, would have looked more like this...
About a 3rd less and one of the lowest volume days since last year. In other words, the increase in selling before quarter's end settlement was huge and to the downside. I think you can draw your own conclusions as we move forward.

BRCM Update

BRCM was an idea from Feb. 28th

There have been several follow ups and a recent look at adding or initiating a position short BRCM

It appears BRCM is ready to resume its next leg down.

 15 min chart

The downtrend...

Another Bellwether Taken Down-PCLN

 A Dark Cloud Cover Daily Reversal Candle formation

 5 min chart fell apart quickly

 As did the 10 min.

As I've said, the 15 min chart usually takes some time to fall apart but today it lost a lot of ground quickly. It seems that distribution was quite strong as many charts are showing the same thing and worse on the 15 min charts. AAPL was another.

GOOG lost 15 points in an hour

SLV set to follow in GLD's tracks

Reversal Upon us?

Well the AAPL bomb scare in the Sacremento Campus would certainly be an event that would allow the locals to start the downward process, sometimes news is beneficial to them.

Take a look at the charts, they are what I expected to see Friday.

 A typical daily candlestick reversal pattern.

 SPY probably reacting to the scare at the AAPL campus. Support is broken and on volume!


 5 min 3C/TSV charts looked really bad today...

 The 10 min chart looks horrible

 And here's the 15 where most reversals happen, it really went downhill fast today.

And the TICK chart showing how bad it is in the market.

QQQ Intraday Breadth Charts are starting to get ugly

Maybe tonight f I have time, I'll post on the daily breadth charts, until then, here are the Q's intraday breadth charts falling apart.

 % of stocks above and below their 5 min 50 bar moving averages.

 5 min QQQ advance decline line and ratio

Intraday momentum index and breadth below.

Translation, more stocks are starting to deteriorate then strengthen while the Q's sit at the unchanged level.

***I have to run down the street to the Dr.'s office, should be back in 30 mins. or so.

Email Question

I received a question today as to "why doesn't the market discount the negative news?"

First of all, the market is much different now then 3-4 years ago, most of the trading is high frequency as well as the market making, it's a totally different market and you have to understand and adjust to that.

Second, the market does discount the news, just not in a way in which the news seems to correlate with the market, I've noticed this over the last year and was especially intrigued when problems and Egypt started and how oil reacted or failed to react, at least in the short term.

I believe this all has to do with the new or at least more influential accumulation/distribution cycle. Here are some charts to better explain.

 Looking at the bigger picture, the market is discounting a number of things. Note that this is the first time since August that the S&P has fallen out of the linear regression channel the defined the trend.

 On this chart, we went from a primary and intermediate up trend to an intermediate downtrend, note the arrows that depict lower highs and lower lows in the market. When the next low is taken out, the market will enter a primary downtrend, it's already in an intermediate downtrend.

Here's what I believe causes news to be discounted differently, on a longer term basis, the accumulation/distribution cycle. Around March 16-18th, there was an accumulation event in which Wall street firms accumulated shares. Since the event wasn't very large it seems to indicate a bounce. Should it have been larger, then the consequences would be different. If bad news comes out the next day after they have accumulated millions of shares, they are at a loss. They need to move the market higher then their average accumulated price and create a demand event which is typically the breaking of a price pattern or resistance level that causes retail demand. Once the demand is there and prices are high enough, the distribution cycle begins. Depending on how many shares were accumulated and how quickly they distribute them, (plus whether or not they take short positions for the next cycle down) determines the length of the cycle. Should they put out too many shares at once then prices fall, they want to sell into higher prices. So that's the cycle in a nutshell and why I watch the 1-15 min charts as they give a good indication of timing. The next leg down and how deep it goes is when the cumulative news and fundamentals are discounted, but as you can see from the first two charts, there has been a big change n the character of the market, it is discounting events, just not on a daily or hourly basis as it used to in the past.

Movements of the Enterprise

The most recent naval map shows the USS Enterprise aircraft carrier, which was moving into the med. within striking distance of Libya, did a u turn and headed back near the Carl Vinson aircraft carrier. With events in Syria unfolding which could be one of the most dangerous overthrows in the middle east, possibly shifting power in Iran's favor, it seemed strange for the Enterprise to leave such a seemingly perfect tactical position.

My question as to why this about face may have just been answered as Rolling Stone has released video and photos of the rogue US "Kill Team" unit in Afghanistan. I'm not publishing the link, you can easily find it on any major news website. These photos are sure to cause problems and I suspect that is why the extra firepower was moved within striking distance of Afghanistan. Apparently the US military command sees the release of the photos as a very real threat. It's a very sad day for the good US military personnel putting their lives on the line and acting in accordance with rules of engagement. A few very bad apples....

I suppose we'll see very soon how badly this escalates.

And the Japanese Situation gets worse

China just announced low levels of radioactive iodine 131 (the type that causes thyroid cancer) over the northeast Heilongjiang province. If I'm Japanese, I'm not going out for sushi any time soon.

Contamination has also been detected as far east as the US eastern seaboard.

Meanwhile Tepco annonces there may be holes in the last line of defense, the steel reactor pressure vessels, in reactors 1, 2 and 3! While there's a inlet into the bottom of the vessel to insert measuring devices (they believe the holes are near the bottom as sea water is leaking from the pressure vessels) which Tepco thinks may be the source of the leak, a more dangerous possibility is that of the actual fuel rods having melted. In this scenario, the molten fuel rods would collect at the bottom of the pressure vessel and would become extremely difficult to cool as there would be very little surface area for water contact.  Things are going from bad to worse very quickly. Our EWV ETF trade is looking better by the hour, as is our March 2nd EGPT short.

Currencies

Today seems like a good day to use the momentary strength is the Euro to either short the Euro (FXE) or buy the Dollar, UUP. The big picture, which I'm presenting below, looks good for the dollar

 FXE is showing a little strength as it is caught between support and resistance, the upside risk  with a stop above resistance is pretty small.

 FXE hourly chart in a leading negative divergence.

UUP is in a leading positive divergence.

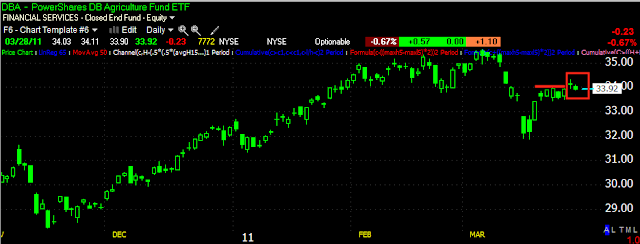
DBA (Short)

More From the Dallas Fed Survey on Food input costs....

The cost of grain for livestock is unusually high because of high corn prices


 DBA Friday posted a new breakout high in the correction, today that level has failed.

30 min chart of 2 recent failed breakout highs.


DBA looks ready for the next leg lower.

The Market is close to unchanged

However, the QQQ just triggered my Friday alert, breaking support that I expected to be broken Friday. One event that may be causing the market to give up the gains today so quickly, other then the observed #c 15 min negative divergence, is a report from Reuters that plutonium has been found in 5 different locations around the Fukushima reactor complex. The nature of the fuels used in the reactors suggest that the only one to use MOX fuels and thus to release plutonium is reactor 3, it's the only one that was upgraded in 2010 with MOX fuel. This strongly suggests that reactor 3's core has indeed been damaged and breached.

Some other observations and facts.

The Japanese government and TEPCO have been rather opaque in releasing accurate, timely assessments of the situation with reports often conflicting or coming out in admissions after a contrary report.

There is now evidence of radioactive pollution at least 1 mile out to sea, most probably having something to do with their use of seawater in trying to cool the reactor cores and spent fuel rod pools.

The Japanese culture is very sensitive to anything having to do with contamination (you've seen them running around in normal times, busy on the streets wearing particle masks), nuclear events are a matter of particular sensitivity due to Japan's history in World War II. Japan is also largely dependent on coastal fishing for food. Even if contamination is limited to a mile out to sea, the lack of accurate, timely and forthcoming information is sure to be causing extreme doubts and distrust in the Japanese psyche. I'm starting to wonder if the food crisis there is going to reach epidemic levels?

Surely the breach of the core of reactor 3 is not going to help the situation. I also wonder how long before the world's 3rd largest economic hub is a literal ghost town?

Dalas Fed Misses badly-In at 11.5, expected 18.4

And the survey can be summed up by the continuing rise in input costs.

Here's a quote by a survey respondent,

All Of Our Raw Material Costs Are At Record Highs


Again, the Bernanke Put has turned into the Bernanke Chinese Finger Trap

TICK INDEX

The Tick Index, advancing issues (on a tick basis) minus declining issues, just hit sub -1250, a reading we haven't seen in 3 days, and only the second time since 3/18.

Market Update

Here's Friday's Closing Comments

And here is this morning's charts, I'm a little surprised how quickly ad how bad the 15 min 3C chart looks this a.m.-all are negative.

 SPY 3C 1 min

 SPY 3C 5 min

 SPY 3C 10 min

SPY 3C 15 min

GLD/SLV/USO UPDATE

So far, things have gone largely as expected in all 3 ETFs since last week; hopefully the early information gave you an edge on some trades.


GLD
 The idea behind the GLD reversal and in fact most reversals now (this is good information to understand as this happens with such frequency in the market that it is becoming predictable) was the false breakout to new intraday highs in the white box on this daily chart. The importance of this is kind of like priming an engine in this case for a reversal. As I've mentioned, Gold and Silver bugs tend to be very emotionally committed to their ideas about the metals and need very little justification to become buyers. Technical Analysis books for decades have told us that we should buy breakout high as we see here. This allows smart money to sell or most probably sell short into this buying demand; it also creates bag-holders that are at a loss when the ETF falls, as it falls more, the loss is greater causing more and more of the once buyers to become sellers which provides the snowball effect for Wall Street's short positions.

 The problem for most technical analysts/traders, is that they have no way to determine whether the breakout is a real event or a false trap. Most don't even understand how prevalent this practice is, others wouldn't believe the information showing it's a trap if you gave it to them. 3C showed very clearly that the breakout saw a lot of distribution on that day which can also be read as short selling.

 As I said later in the week, because GLD was now trapped between resistance and support that it would bounce around a little between the two trendlines before breaking lower, today it decisively broke lower and support is now resistance.

 The longer term 30 min chart which compares the former intraday high with the new higher intraday high from last week, looks very weak so I suspect GLD (which will have bounces along the way) has more downside to go from here.


SLV
 All last week I said SLV is about a day or two stronger then GLD meaning it would follow GLD, but take another day or two to break the same levels of support.  SLV is currently at the support level of a new closing high breakout, but has lost a lot of ground today.

 Here's the breakout day new high which also saw distribution in 3C and other indicators.

 Right now SLV is in the same position as GLD last week, caught between support and resistance where it has bounced off support this a.m., about a day or so behind GLD.

USO
 USO was at resistance of a new high above the March highs, which was a perfect place for it to pull back and regroup before the next challenge of the March highs, today it has done so.

 Here were my two potential (most likely ) targets for USO.

 The 30 min chart showing the distribution the last 3 days

The 60 min chart remains very strong suggesting this is little more then a normal corrective pullback.