Thursday, August 29, 2013

Market Wrap

We had a pretty incredible overnight move, considering recent volatility until today's 2nd quarter GDP revision and Initial Claims came out, that let the air out of the market around 8:30. We still had a decent open, I posted we'd be seeing an intraday pullback around 11:30 which took place around 12:07, also at 11:20 (although I based this on 3C), the $USD/JPY turned down, obviously smart money stock traders were moving and 3C was picking that up as they knew what a lower $USD/JPY would mean, a lower market, I see this pretty often, that's why I check so many different assets.

The bearishness we saw earlier in the week based on market nervousness over Syria, as I always say, "The market hates uncertainty", seems to be fading as a number of events seem to keep pushing the strike date back as well as the evidence for the strike along with Hill politics, the market seems to be enjoying this bit of no worry, although VIX futures did outperform the SPX intraday, I figure a lot of traders will be taking a 4-day weekend leaving for the Hamptons tomorrow with Monday a market holiday, if they are going to grab protection, today would be the day.

VXX correlation vs. an inverted SPX to see the difference.

Meanwhile the SPX and rest of the market seem to be in a bull flag which would be 100% appropriate for where we are in a "W" base according to Technical Analysis textbooks, the world doesn't usually work that way, but I wonder if they'd rather see retail buy down here and get head fakes higher than make them skittish?

In any case, here's the bull-flag and it's really the only thing (consolidation) that can happen without destroying the "W" base.

IWM "W" with a bullish consolidation "Bull flag" in yellow.

However, we did see a quick change of character in VXX / UVXY today after very "blah" trade for several days, this doesn't just happen unless there's something going on.

Again, and as suspected, the averages are losing correlation, the Dow at +0.11% gain with the Russell 2000 at a 1.00% gain, at least the R2K is showing leadership, the R2K should lead all rallies/bounces.

I warned yesterday that Transports are starting to come alive, IYT may even be a long trade soon, I think they'll need them to convince retail as best as they can or they think that, I think you give retail a couple of 1+% days and they'll be as bullish as ever, "Buying the dip" and all.

Treasuries also strangely (according to normal market correlations) rallies with stocks on the day and the $USD, not a typical market at all, In fact treasuries rallied exactly at 8:30 a.m. when the eco-data was released and headed up all day to give a little back at the close.

Commodities got slammed toward the late afternoon, first crude was hit at 2:30 and then gold and silver to a lesser degree around 2:40
USO whacked

 the end result being...
Again, this seems to be an unwinding of the earlier war premium, it's odd, but these events too also tend to be knee-jerk, just look how quickly the market recovered after 9/11, I was surprised.

As far as some of the Leading Indicators we have a particular interest in, they keep acting well, better and better actually.

 FCT was not performing well, just to be in line was a big improvement in bullish sentiment, but now it's closing much better than the SPX and getting better every day.

 Our other Sentiment Indicator for pros, HIO is seeing even better performance on top of already stellar performance. These leading indicators have served us well in substantial reversals, there's a lot price doesn't tell you that you can find in all corners of the market.


I just wanted to show HYG credit today intraday which smoked the SPX, however it's even stronger than that and JUNK credit acted the exact same way.

This is HYG is context, leading the SPX.

HY Credit continues to hang in there and close better than the SPX, it's very skittish so it even coming along for the ride is something.

I have very little doubt we get a pretty strong bounce, there's no other reason to run one if you aren't causing movement in retail.

As you know we have a weekly Op-Ex pin tomorrow as Friday weeklies come due, usually the close Thursday is pretty close to the Friday pin until about 2:30 as most options contracts are wrapped up and the pin loosened, I kind of wonder if we get a surprise on the pin day with most likely low volume as most traders in NYC will be in the Hamptons tomorrow if they aren't already.

Monday we have a market holiday.

So far the market keeps doing as we expect, albeit seemingly very slowly, but that's just from watching every minute of the market, but if we hadn't, I might not have noticed a quick and severe change near the EOD in VIX futures to the negative, not sure what it's about, but I would have missed something that is probably important.

I'll check back in if futures get wild tonight.


VXX / UVXY

Both of these are short term equity vehicles to trade VIX Futures, UVXY just has 2x leverage.

Like the bounce in the averages has longer term positive charts that are the basis of a bounce, being the VIX trades opposite the market, it too has longer term divergences that are negative in support of the prospect of a market bounce and I don't mean a day or two of 1.2% gains, I mean something more serious, a swing or more.

There's a reason I only picked a few assets today, I went with the ones that looked the best and let the others wait a bit until they look tighter.

 VXX 1 min has been hanging around price in what I've been calling, "Blah" 3C/ price action. Today was the first day that VXX / UVXY both went leading negative and deep as well as fast.

Something obviously changed in these two today as market averages were starting to show accumulation at the same time, which is a form of confirmation being they move opposite each other.

The 3 min chart is not a slam dunk, it is negative though

The 5 min chart is much more negative

The 10 min chart is more than enough to confirm a market bounce with VXX heading to the recent lows easily.

The 30 min chart though is really damaged for now. This is why fast moving intraday divergences like the 1 min seen today can change the price action quickly, the damage is already done, it's like a car teetering off a cliff, it just needs a little push and that's what those intraday charts are to VXX now.

EXAMPLE: XOM

Here's an example of why this is a tough call, tough area. First as we saw earlier today when we forecasted a market pullback intraday at 11:30 a.m. that was based on a new intraday divergence, all new divergences, even an intraday pullback, will start with the fastest (weakest) timeframe and if they are strong enough they will build from there.

Here's the chart of the IWM which was the most extreme 1 min negative forecasting a pullback this a.m.
 IWM 1 min this morning. The signal gave us nearly 45 minutes notice that a change was coming, we didn't have to guess if the market was going up or down, we had a good idea and when as well.

This chart would have a lot of work and time to undertake destroying a longer term divergence that is pointing to a bounce.

This is what the IWM closed like on the 1 min chart.
The clear negative caused more of a range than a pullback, but 3C didn't make lower lows with price so it went to a relative positive divergence, this isn't strong, but it is a new divergence suggesting the start of a new trend and that the intraday pullback was ending, at least today's.


Yesterday I closed half of the XOM calls, it was a great decision as XOM has gapped down today and spent the rest of the day moving down, but I didn't close the entire position because I saw a pullback today in XOM as highly likely and the position is still in the green just in case it didn't pullback today , but tomorrow instead.

So like the market today which we called for a pullback around noon time (which should see accumulation in to that pullback), XOM has done something similar and while each average and stock look a little different, THAT'S WHY I'M NOT HITTING EVERYTHING I LIKE, BUT ONLY CERTAIN ONES NOW, the XOM example is a fair way to illustrate why this is such a difficult timing call right now going in to op-ex pin Friday and an extended 3-day weekend.

 XOM going negative on a 2 min chart yesterday was reason enough to take half the gains off the table

However as XOM pulled back today as expected yesterday it went from in line or trend confirmation to a relative positive divergence. A relative divergence on a 1 or 2 min chart is the weakest signal you can have, but the point is, ALL SIGNALS START HERE. If the signal is strong enough it will move to longer charts and put in leading divergences.


 The slight strength on the 2 min chart above came from this 1 min chart of XOM today, at first it was moving down with the market and in line at the green arrow, then it started making higher lows and putting in a positive divergence, it was just strong enough to move to the 2 min chart as you saw above.

This is the start of a new signal telling us the pullback in XOM is being accumulated, it's likely going to be a good buy and it's likely going to end (the pullback) soon.

Even the 3 min chart picked up activity and was showing a positive near the EOD when professional traders come out.

This 15 min leading positive is not going to be undone easily and it tells us to trade XOM (short term) from the long side, pullbacks that have accumulation are excellent entry points.

Many of the market averages changed quickly 2 days ago, literally in minutes so it's difficult to tell how long they'll take to move, but many averages that were pulling back today started flashing positive signals and I don't think we will visit the "W" lows again, in fact the bull flag I showed earlier looks to be real. More shortly.

Opening IWM OCT> $100 Call, URTY long Also works

I chose to go with the calls, but URTY, Russell 2000 3x leveraged long ETF would be a close second, I think it would be better if we get a more sustained bounce.

Here's what I like in the IWM as well as URTY (long).

 The intraday pullback has transitioned to a positive divegrence 2 min

 The 5 min is leading and leading for today specifically.

The 15 min overall "W" base

The 30 min chart positive at the second base area, it looks like a real bull flag, I wouldn't normally trust it if I weren't seeing positive 3C signals

We even have a clean 60 min IWM positive with most of the positive at the second bottom as it should be.

VXX & FSLR charts

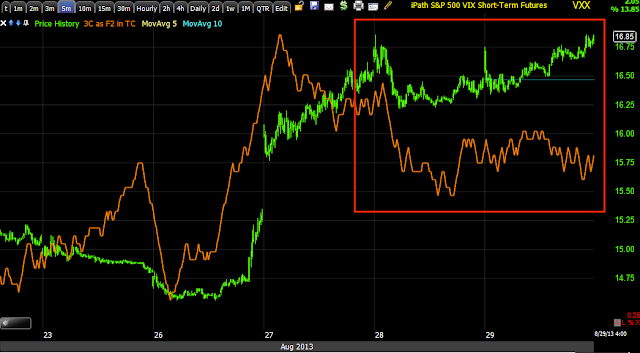
Here's the VXX or UVXY, the important chart is the very negative 5 min VIX futures, it was just waiting for the 1 min to go negative, the market moves in the opposite direction of VIX futures.
 VXX and UVXY which have been hanging right at price the last 3 days or more are finally making a substantial move leading negative lower.

Also the VIX 1 min futures are finally doing the same, the 5 min chart is destroyed already, it's just waiting for the primer which I believe is right above.

FSLR intraday with the market pullback and transitioning in to accumulation of that pullback, this is what I was hoping to see happen today.

As I said, the 2 min chart never went negative and is in line or better.

 The 5 min chart is leading positive here, no negative activity at all today

Ultimately the 30 min for a bounce, accumulation started around 8/16 just like everything else in the market.

FSLR Calls

I'll likely go with some October $35 and December $37.

The 1 min is going positive now, the other timeframes are already in line.

Opening Small VXX Sept $17 Puts

Important Market Update

This has been a really hard call because there has been accumulation in a number of area, I think what just swung it for me is VXX/UVXY starting 1 min negative divergences that are nothing like the last few days.

Here are some longs I like either with or without leverage.

XLK
IWM
FSLR
MCP
FAS (3x long financials)
PCLN

among the others mentioned.

I may start throwing some trade / position ideas out quickly as this looks like a quick turn may come.

TJX CORE Short

TJX is the EXACT same concept as NFLX below

The Trend Channel already stopped TJX out so there's been a significant enough change in character to warrant a primary trend reversal. The best thing is, TJX is another position that will come to us, this time the alert is ABOVE $54.66, it may be $57 or $60, but that's the minimum level it must cross and it's getting ready to do that.

This is also a CORE short, full side equity short in my view and a strong one at that.

 The Trend Channel (my custom stop / trend following indicator) self-adjusts to each stock's own personality, during all of 2013 TJX never once stopped out with the TC until the red arrow, that's a significant change in character, I use to exit there no matter what even though I knew there'd be more upside, the upside was just too dangerous long.


 That simple indicator I gave you yesterday even works here on a 2-day chart with a long and negative divergence like RSI or 3C.

That would be a 200-day moving average, the next move to it I think will see it break and traders go nuts over the 200-day.

This is the head fake area, we need to see price above this area and this is where we are likely to find the best entry, lowest risk and even better signals.

My Trend 3C removes all the noise to give a clear picture, you can see the recent change clearly on this important daily chart.

The 2 hour shows more detail and an ugly top.

The 10 min and the head fake range we want to see price above in yellow.

The best news is that the 5 min chart is set up, this one is coming to us where we'd expect and when we'd expect, this is letting the trade come to you, I think it's the best entry, the highest probability and lowest risk. I'd set an alert reminder for TJX > $54.75

NFLX Core Short Set-Up

As for the market right now, it has some more downside to go, I'm just collecting names I like, looking at some options, expirations and strikes (although several could be straight long positions like FSLR or IWM using perhaps the 2x leveraged UWM or 3x URTY).

Some of the candidates I do like right now as they come in to the zone (long): XOM, FSLR, IWM, XLK, GOOG.

SHORT: VXX, UVXY.

As for NFLX, I'd nearly short it right here if I didn't feel the way I do about the market and if the price pattern wasn't inviting a head fake move which would be perfectly timed to a major decline, again this is a core short, probably best entered after a bounce and a head fake move above it's resistance, it looks horrible, almost so bad I'd take it here.

The best thing is all you have to do is set a price alert for NFLX > $290.25, it will likely be somewhere above that area where a head fake move will establish and give us even better confirmation as well as a lower risk entry.

 Note the two highs around the $290 area and 3C making a lower high at the second one, that's a negative divergence and actually a leading negative divergence on an important timeframe.

I don't include all the timeframes because they are all bad.
 30 min, same thing, the second high saw heavier distribution than the first.

 5 min intraday, there was VERY little accumulation for the second run up which means they likely bought enough just to get it moving so they could sell in to higher prices.

The fact there's a clear resistance area makes a breakout above that area a technical traders dream, that's what they chase, it will likely see even heavier distribution on such a move, that's what and where we want to look at entering a short and I think a full size equity short or core short position.

For now, I'd at least set an alert for >$290.25 and you can take a look with your own charts, this is stalking the trade, letting it come to us.

SLV Update

This morning I closed half of the SLV put position  and I closed all of the GDX Put position in this post, I explained why for both and the reason is occurring RIGHT NOW.

So I'm going to be looking for a new GDX put entry, it may make for a good DUST (long) add to or new position.

Also I'll be looking to add back the half of the SLV position closed to take some of the momentum gains that would be long gone right now.

 GDX's 1 min chart looks like it is giving up, it will probably take a greather, but I doubt it's done.

This 10 min chart that is in line would have to be more negative for the 1 min to make GDX a short here.

The 15 min makes it still a short, but it needs to be entered at the right spot.

SLV as you can see went from downside, profitable Put momentum to an intraday positive, when it turns negative, I'll be looking at shorts/puts.

The 15 min chart makes clear SLV is still very much a short.

I may be a little quiet here and there and may call out some trade ideas, I'm going to be going through watchlists and looking for candidates, some set up before others.

***Market Update & Quick Look @ Leading Indicators

At 11:30 with this Market Update I think it was pretty clear the market was going to pullback intraday, but the pullback didn't effect charts beyond 1 min meaning it isn't a strong divergence by any means, it's the kind I'd expect to see if market makers/specialists wanted to lower the market to accumulate in size at lower prices (buy low sell high).

Right now that pullback has started, as I mentioned in the posted linked above, a negative divergence on a 1 min timeframe only has a 50/50 chance of either consolidating sideways or pulling back, when the 2 min chart is added, a pullback becomes an almost certainty.

While this still doesn't weaken the market outlook, we do have 2 min charts right in time for the pullback.
SPY 2 min joins the 1 min negative intraday.

I suspect the market is not showing these signals (in every average to one degree or another) to signal a distribution event, to me it looks more like the market wants to get this pullback done quickly.

I HAVE A FEELING THIS IS THE FIRST AND LAST GOOD AREA TO ADD LONG (SPEC) POSITIONS FOR A MARKET BOUNCE. What I mean in first is that timeframes are coming together, what I mean by last is I don't think this will be much larger than the already large (since 8/16) "W" base in place.

I think a pullback here is truly a gift.

Here are some signals.

 Commodities have fallen off vs the SPX, obviously because of Crude, Gold and Silver action today, we may get a chance to add those positions closed in precious metals earlier today at some point today.

HYG credit is scaled so you can see intraday, but it is leading for the last 3 days now, in addition it is leading intraday, this is a strong market positive and a pullback with this signal is a market gift in my view.

HY credit is holding up as well

The strong USD/JPY has helped knock precious metals down and keep the market up, but I see a high probability of at least a small pullback in the pair which would cause the market to pullback which it is already.

 Yen 1 min futures show a positive divergence, this would cause the USD/JPY trouble moving higher.


Yen 5 min futures, the 5 min chart shows it as more of a counter trend correction so I'm not concerned about it interfering with a bounce.


$USD 1 min futures have a negative intraday, this locks it in, the USD/JPY will likely fall with yen strength and $USD weakness, even if it is just for a short time or intraday.


USD/JPY 1 min futures this is what caused ES to look so good pre-market before the Eco-data came out at 8:30, the USD/JPY acted as the market's engine or motor supporting it and pushing higher until the "Good news is bad news GDP and initial claims" hit. So again, a pullback here, which looks inevitable, should pull the market back, which we've already had signals of, the FX signals just give confirmation. The HYG positive tells us this  pullback is almost certainly best used to buy spec. short term positions for a market bounce.

Positions like FSLR.