Tuesday, March 8, 2011

Price/Volume RELATIONSHIP IS IN

It's dominant, price up and volume down. This lends to the theory that we may very well se a reversal tomorrow.

Take THIS SERIOUSLY

I don't like what I'm seeing, actually I do like it because I think there's good money to be made, but I think we are in the midst of a reversal that may have already started.

Here are the charts....
IWM 60 min, the volatility that has been largely lateral masks the importance of this most recent negative divergence

IWM 15 min , same thing on this chart.

Today, unlike yesterday we do have a solid price gain, but a negative divergence through out, no strengthening into the late afternoon. Now we even have a leading negative divergence in the red box.

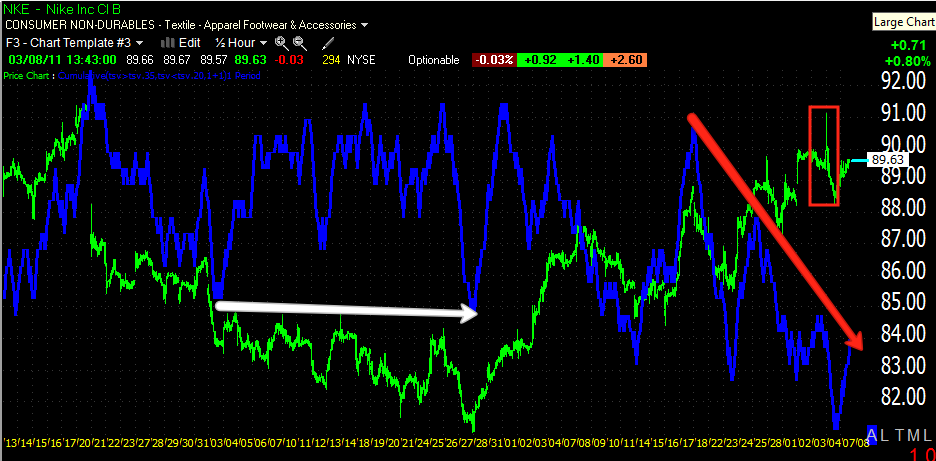
Look at the size of the candles, that's a lot of volatility, but it has gone NOWHERE! The initial break at the red arrow may have been the real break and what we may be seeing now is just a volatile consolidation getting ready for the next leg down. Note-break away gap HAS NOT been filled.

The IWM and the Q's as of last night where the two closest to an overbought condition. Note that neither the IWM or the Q's have truly filled the breakaway gap. This is VERY bearish.

The Q's on this daily chart are not only in a relative negative divergence, but a leading one as well. This is a big development for a daily chart.

Again, the lateral chop conceals the importance of the most recent negative divergence

The SPY 30 min chart showing extreme deterioration throughout the lateral chop. I think this lateral movement has obscured the importance of these readings.

The 15 min SPY 3C chart shows the deterioration as well as a leading negative divergence.

Here's the VIX-note the bullish descending wedge-trades inverse to the market-also the 3C positive divergence and the breakout from the wedge-this may have been underestimated. This is a breakout right now. The last time we had even a small positive divergence in the VIX, the market traded down over 16 points and that wasn't even 5% the size of this one.

Here's a wide view of the VXX. Not only has price lost downside momentum and turned up in the VXX, but look at volume as that has occurred. 

And the VXX HAS broken out and on good volume.

The VXX positive 3C divergence on the daily chart. 

All in all, the market has been lateral and choppy, but during this chop, there has been huge volatility. there are breakaway gaps that have not been filled and 3C does not look good. I'm increasingly starting to really believe we are now at a turning point in the market. All of the risk management things we have talked about in preparation for this event should be in place.

NKE Chart Request...

OK, NKE reports March 17th, so as far as earnings and the market's reaction to "possible" leaked earnings or expectations, we still have plenty of time as leaks will usually show up between a few hours to 3 days before earnings as the locals act as late as possible as to not tip off other traders. However, a large position in a large cap like NKE can take some time to shift around.

The daily chart, yesterday we had a bearish engulfing candle on big volume-once again a sign of churning and a negative reversal signal-note the volume yesterday

The 60 min chart shows an accumulation/distribution cycle. This is how the market works, they accumulate at lows nice and quietly and then sell into higher prices, not into the decline. They have a large position and they must sell into demand to keep prices rising rather then falling so it happens a little bit at a time, this is why distribution can take some time to work out and why we watch multiple timeframes to try to ascertain wen these events begin and end.

The 30 min chart also shows signs of the accumulation cycle and the distribution cycle -in the red box is our bearish engulfing candle yesterday. Note hoe negative 3C has been during this event.

Te 10 min chart puts a very fine point on yesterdays' distributive action in NKE.

As does the 5 min chart.

The 1 min chart can't stretch back any longer historically, but there's a negative into yesterday. today we have confirmation only.

Once again the daily chart shows a breakaway gap that hasn't been completely filled/. Yesterday was a breakout into the gap from a bearish ascending wedge. If the wedge breaks down soon, I'd guess NKE is in some trouble, but being an obvious pattern, usually they'll try to breakout price above the wedge's apex (point)  before letting it fall. The overall bearishness of the chart is not diminished by any upside breakouts. The wedge is not a manipulation, what may happen in the days after it forms can be, but the pattern itself is to big for a manipulation-it's the real deal, it's bearish.

Update on SPY, USO and SLV-Chart Request for NKE

NKE has earnings coming up so keep that in mind.

SLV
Still watching for a possible false breakout-or a pulback with indications of accumulation for a long position with a god risk:reward profile. The volume yesterday indicated churning, basically it's not good, it's just shares exchanging hands, but there's no real price appreciation associated with it. Typically it happens when smart money is distributing to retail.

The 20 min 3C chart shows this churning in the red box as distribution.

SLV on the 15 min timeframe-this is a great reversal timeframe and we are seeing a negative leading downside divergence here.

SPY
The 1 min chart showing positive (white) and negative (red) divergences. right now there's some lateral price movement into a negative divergence, I have to assume there's distribution going on.

SPY 5 min was in a leading positive, that has broken down a bit and I'm questioning whether this is going to turn into a leading negative as it has started to imply.

The important 15 min chart shows some good reversals, right now it's in confirmation which makes sense considering the 1-5 min charts have not resolved their intent as of yet.

USO
USO 1 min is mostly in confirmation with the exception of the 11:40 negative divergence that led to lower prices.

The 5 min is still looking positive here.

 
However, the 15 min has gone very negative and this trumps the 5 min. Unless the 5 min starts to really show extraordinary strength and bleed into the 15 minute, we may be close to a reversal in SLv. the next question will be "is this a pullback or a downside event". We can only tell when we get there. If SLV pulls back into accumulation it will set up a low risk long. If the distribution gets worse and SLV starts taking out technical support levels, then we can anticipate some nasty downside in which case you'll have plenty of time and downside to take on a trade. I'd wait for confirmation rather then trying to guess which way this is going.

NKE charts coming n the next post....

ACAD just triggered a break out long

This is a speculative trade, but I do like it.

Here's the breakout on increasing volume on a 30 min chart...

And here it is on a 5 min chart, momentum in increasing. Take a look.

The Primary Dealer Scam Continues

ZeroHedge has been on the vanguard of tracking the scam that is POMO or monetization of the debt with primary dealers taking nearly no risk as they flip newly issued treasuries to the Fed in two weeks. There's not a whole lot of risk in two weeks and they sell these issues at a premium to the fed.

Here are the results from today's POMO from ZH

Note the submitted:accepted ratio is below the median of 4.1x meaning the PD's came out of this one with some cash that usually ends up in the market that same day. After all, its risk free, free money, why not invest it in risk assets, you have NOTHING to lose?

Here's the market update...
DIA 1 min negative divergence..

DIA slight 5 min negative divergence

IWM 1 min negative divergence and also 1 of 2 (the QQQQ being the other) that showed a heavy price/volume relationship leaning toward overbought yesterday. See earlier post on Price Volume Relationships.

IWM 5 min just starting a negative divergence-with nearly a 2% gain, this could very well put in that overbought indication that we saw it leaning toward yesterday.

QQQQ 1 min (the other P/V relationship leaning overbought yesterday) with a negative 1 min divergence. We "could be seeing selling short here.

Q's 5 min still positive from yesterday's late afternoon positive divergence, I warned that it would continue at least through the early part of today.

The SPY was mixed in the P/V relationship, but the 1 min is negative and price is lateral. We'll see if there's improvement here which could indicate the PD's coming into the market with their new fresh and free Fed greenbacks.

If you remember yesterday in the afternoon we saw a positive divergence developing-seen here in white, since it was so late in the afternoon I suggested it would carry over through today, which has happened thus far. there's also a leading positive on the 5 min, however, things can and do change very fast.

Another Hit to the Department of US Economic Misinformation

Some of you may remember my post talking about the discrepancy between government data and privately polled data, I said the private pollsters like Gallup "have no dog in the fight" and their business model depends on credibility. Well where the Department of Bull-S (meaning bullish on the economy of course) has just taken another hit as Gallup finds Consumer confidence has dropped in February, despite the Fed's market manipulation "Wealth Effect", or maybe it's because the market hasn't done much since February (the S&P has returned 1.26% in the last 25 trading days, the start of February or 5 trading weeks).

Here's Gallup's Tracking Poll

"The largest drops in optimism in February were among those 65 or older (down five points) and among upper-income Americans and those aged 50 to 64 (down four points each). "

China 25 head fake? Possibly

A lot of traders yesterday caught 3C bottoms and made some great trades in the averages and USO via options. Looking at FXP which I like long and it's inverse (long) counterpart-FXI for the China 25, we may be seeing some of that false break out action I mentioned in an earlier post today.

FXI
Today's 1 min 3C-note the volume today, that isn't how locals accumulate, it is how they make technicians running volume surge software think they are accumulating. Reading technical analysis message boards, especially over at Worden, users are still trying to develop indicators based on volume surges as "accumulation". How many times have we seen that is NOT the way they accumulate, but so long as technicians continue to think that, Wall Street will take advantage of it.

Here's FXI breaking out through Gap resistance, remember what I said about these false breakouts we see at almost every reversal. I've even said recently I prefer to get involved with stocks that have already shown a false breakout as they are so common place before a reversal now.  If you don't recall, the reason is, it creates a snowball effect on the reversal from positions (in this case long positions) being underwater. the longs then sell, they create an imbalance in supply and demand which causes prices to fall more rapidly, which creates a loop of more traders at heavier losses selling, so on and so forth. the end result, the locals that short up here have to do VERY little to get a profitable position working. The retail crowd does all the heavy lifting through their losses. The locals don't have to commit extra capital to create a bear raid/run.

FXP-the inverse of FXI the China 25 (basically a leveraged short on the China 25)
Here we have near perfect confirmation of the FXI in distribution on the 1 min with accumulation in FXP-the inverse of FXI.

The 10 min chart is also bullish-we just need to see the 15 min chart turn and between the possible false breakout and a 15 min chart positive divergence, we should see a reversal to the upside in FXP and downside in FXI.

We'll monitor this trade today as positioning will be excellent if today is "R-Day".

I'm Human

And as such, I make mistakes. I've been trading well over a dozen years, including professionally and guess what, I still make mistakes. Of course it's easy to make a mistake in the market, but this is a mistake I've already learned from, I shouldn't have made it, but I did because of a couple things.

1) Gun shy
2) Instead of looking at my analysis and giving it priority, I read and took to heart 1 too many articles.
3) I didn't want to be wrong

I know better, each and every one of these mistakes, I know better. We are in the market, it can be random, it can turn on you, but YOU HAVE TO, make the best of the information you have RIGHT NOW. Not speculate or guess what might happen when you have something solid in front of you.

So here was my mistake. Yesterday I saw UUP or the US dollar looking good, like it was under accumulation, I confirmed with FXE (The Euro Trust), I captured all the images which takes some time and even started uploading them and then decided, "The dollar has been getting hammered, I just read this and that about why it'll be hammered more" and there was my mistake.

I have an obligation to my readers and if I'm wrong or things don't work out according to analysis, at least I used analysis and not a guess. So trading is a lifetime of learning and in some cases re-learing. That's my confession. I'll tell you, if you want to improve your trading, keep a journal of your trades and review it about a month after you closed out the trade. You'll learn quickly, you'll see patterns and be able to identify-thus fix problems. It sounds boring to some, but a trading journal is an excellent tool, especially to fid out what kind of trader you are, when you are most successful so you may apply those attributes to trades in the futures. WOWS serves as my journal in a way.

So here's the Dollar via UUP.

UUP hourly suggested that the break below support was a false breakdown. How many times do we see these before a move starts? I'd say nearly every time.

UUP 15 min-the Swing time frame, very positive and led to this morning's gap up.

Just a a warning and maybe as a tactical note, there's a 1-min negative divergence, so there may be an intraday pullback that allows you to buy the Dollar/Dollar Index/UUP/etc at slightly better prices. The longer term charts look pretty darn solid. So back to retraining myself. 

Fun Trying To Fix my Mac/USO Update

This has been my fun! And I know NOTHING about computers except I need mine to work. Thus far, it's better, not great, not normal, but better so I must have done something right.


USO 1 min
USO 15 min

3C has been pretty accurate on USO, last week I advised trailing a stop behind USO, if you used the stops I provided, you should have been out of the trade this morning. The 15 min chart shows us that this is a swing move down, I don't see the upside in hanging around unless you want to wait for Wednesday's oil inventories.

However, we've been able to trade the inventories with 3C right after the report came out, so still I don't see much of a point in hanging around here. Longer term, I think it's a different situation, but... no let me rephrase that BUT! NEVER, EVER turn a trade into an investment mentally because of a loss, right now if you traded USO with the rest of the Wolf Pack, you should still be at a decent profit.

Opening Indications

These are just 1 min charts and very early, mostly retail orders and after yesterday's price move, I'd expect to see some retail sell orders on the open-Fear is more powerful then greed.


The DIA is slightly negative, but more or less in line.


The IWM is also slightly negative

The QQQQ looks a lot like the IWM-remember the P/V post, the Q's and IM were the same.


The SPY is where I'd expect it after yesterday afternoon's continual 3C slide to the downside. The gap up is not confirmed.

OK, so remember these are not the pro's taking positions this early, just taking the other side of retail orders until they can smoke them out. So don't take this too serious yet.