Wednesday, June 10, 2015

Daily Wrap

The 30-secpnd soundbite for today's move would likely be the rumor of a German compromise toward a Greek deal, even though Chancellor Merkel is at odds with Finance Minister Schaeuble (Smeagol) with a decent part of her party ready to side with the German Finance minister and vote down any Greek "3rd bailout", calling the Greeks "Not serious". I'd have to agree when you are trying to get billions of dollars and you submit a 3 page proposal. In any case, later in the morning after the SPX-100-day moving average short squeeze, there were rumors that there might be a deal the Germans would agree to, however as you'll see this was AFTEr the initial short squeeze and the market essentially did nothing the rest of the day.

 The SPX today with the Greek rumor at the white arrow , well after the fact as the market saw an earlier short squeeze above the SPX 100-day m.a. and then the denial of the rumor at the red arrow,  it has absolutely nothing to do with today's price action, the 100-day moving average had EVERYTHING to do with it.

Since the April 2nd forecast for a breakout above well formed triangles in the market averages that would fail (head fake moves/false breakouts) , we've had almost 3 trading weeks of declines or drifting lower until the 100-day (yellow) was broken to the downside with intraday resistance tested and failed yesterday, creating a clear area for short stops and long entries on a break above, the exact same thing we have been looking for all week.

This morning's excitement...
 Which saw Transports underperform the other major average by nearly half...

Had nothing to do with Greek rumors and everything to do with a clear short squeeze with 3 weeks of ugly market action and a break of an important technical level. Technical traders are really not that hard to figure out.
The SPX saw its best 1-day performance in a month as it moved above the 100-day and 50-day moving averages on fairly light volume which is common for a short squeeze.

As you saw numerous times today, the charts were seeing distribution in to price strength which is what we expected to see once the move got under way ("W" bottom or not-this looks to be the move on a much less stable "V" shaped base).

You may recall the HYG 3C charts were showing short term chart accumulation in front of this move which is one of the first levers they reach for when trying to ramp or manipulate the market higher. Interestingly, HYG didn't performa all that well today, it almost looks like once they got the move off the ground and through the 100-day m.a., there may have been some selling of HYG.

 HYG 1 min vs SPX (green) today lagging the SPX rather than leading it.

On an intermediate term scale as a Leading Indicator, this HYG/SPX divergence is screaming "Trouble", we've already covered that before, What High Yield credit is Screaming 

And on a primary trend, HYG was confirming the SPX at the green arrow through part of 2014, but started making lower highs and lower lows on a primary trend basis. As you might know, I am expecting HY Credit to make a new lower low as well as the market. As they say, "Credit leads, stocks follow", which is an ugly prospect for equities considering.

 The 3C positive divergence in to HYG in recent days gives us early warning as it shows up well before any price move in HY Credit which is the actual lever, not the 3C divergence, that's just early warning of what's to come , how and why, which means the market is fairly weak if they need HYG and HYG wasn't even very excited.

Taking a closer look at the same 5 min HYG chart intraday, it seems to be seeing clear 3C distribution in to the day today meaning it's not likely to stick around long which is fine because I didn't expect this move in the market to last too long, I hoped long enough to get some new shorts off and I would still expect a reversal process and probably some kind of pin in to Friday's monthly options expiration being the last 3 weeks have been trending down.

There are other forms of HY credit that are not used for manipulation as they just aren;t effective, but they do give us a glance inside the world of HY credit without any outside influences.
 Here HY Credit sells off in to the SPX's move today and especially in to the close which is the most important time of day for analysis in my opinion.

On a larger scale, HY credit has been falling apart since the head fake move in May failed (above the SPX's large ascending triangle).

My custom SPX:RUT Ratio shows some near term support the last day or so and falls off in to the close as well today (yellow). In other words, looking beyond the PP gain, there's trouble under the thing veneer.

While we're still on Leading Indicators, our Pro Sentiment Indicators aren't buying the move either...
 Pro Sentiment (blue) vs the SPX (green) refused to move higher with the market today.

Here's the same on a 1 min intraday chart, absolutely no support, no interest which makes me wonder if this move might end sooner than expected.

The long term Leading Indicator trend is also not in good shape. It's when the long term strategic trend meets the short term tactical trend that we see action and in this case, trouble.

Our second version used for confirmation shows the same thing,  no interest at all in the SPX's/market's move today.

And since the head fake move in May above the SPX's resistance (ascending triangle), things have been downhill , you can see why we call it a leading indicator. Perhaps in a couple of days, it will be even more clear given today's refusal to move higher at all.

Interestingly tonight, Internals are showing a massive 1-day overbought condition. The Dominant Price/Volume Relationship has 23 Dow-30 stocks, 50 NDX 100, 1120 Russell 2000 and 268 SPX-500 stocks, the relationship is the same for all 4 and it is Close Up / Volume Up, which is the most bullish of the 4 possible relationships, HOWEVER... ironically this often creates a 1-0day overbought condition and the next day sees a red close.

Adding to that 1-day overbought condition were 9 of 9 S&P sectors in the green with Tech leading at +1.56% and Utilities lagging at +.50%.

Of the 238 Morningstar groups we track, a massive 230 closed green.

This is a massive 1-day overbought breadth condition and I wouldn't be surprised to see a close lower / red tomorrow, that is what we usually see.

As for longer term breadth conditions, they are failing fast. I won't post too many, but enough that you get the picture.

 In green, the Percentage of All NYSE Stocks Trading Above Their 40-Day Moving Average. It's not the huge decline from well over 80$ in a normal bull market to less than half that, it's really the recent action since the head fake move in May that is most interesting to me at the yellow arrow.

 The  Percentage of All NYSE Stocks Trading Above Their 200-Day Moving Average. Again, this isn't about how far off "normal" has fallen, you've seen that many times, it's how far and fast recent breadth has fallen off in areas where it should be making new all time highs.

And The McClellan Summation Index, with a very interesting divergence not only well below ZERO, but again, look at the 2015 trend and the current direction the indicator is pointed.

I showed a lot of 3C charts today so I suspect you have a pretty good grasp on where we are at least until tomorrow's cash market, basically right on the edge of the "gas in the tank" charts at 5 min...

I rust this 3 min SPY 3C chart needs no explanation...

The action in to the afternoon is telling, leading indicators are telling the same story.

As for Futures so far tonight...

Lets just say they're not looking good and I don't regret opening that speculative VXX call position, Trade Idea: VXX VERY SPECULATIVE...
 ES 1 min has been bad all day, but it has just gotten worse since the close.

And the 3 min TF/Russell 2000 futures, NO CONFIRMATION at all.

As I said earlier, we'll let the market tell us when it's time and where we might find the best opportunities. It doesn't seem to me there's going to be much of a bounce lasting long enough to allow beaten down assets like our long term core short, Transports, to bounce enough to get a low risk/higher priced entry, but I think we can turn over a few stones in addition to some more conventional assets.

Have a great night

Trade Idea: VXX VERY SPECULATIVE

Until those 5 min charts turn, I'm pretty content being patient, but there seems to something going on in futures, whether it's a really quick overbought condition or something else. I figure that it's likely I'll be building a VXX call position soon so I am starting a very small, speculative VXX July 17th $18 call position. If I see further evidence of strengthening there, I'll add to it, but for now I consider it a very short term speculative trade with the advantage of being the start of a position if there's continued movement in futures.

The VXX and UVXY equity long positions are still in place and will stay there.

Quick Futures Update

I'd almost enter a speculative VXX call or SPY/QQQ put right now, but I think this is the time to be thinking about the bigger picture and being as sure as we can about the timing and types of positions we use.

In any case, just as the averages have been deteriorating all day after they lost all of the short squeeze upside momentum, so too have Index futures.

The point not so much being about a trade,  the point more being that we are seeing the distribution on price strength created by manipulating predictable technical traders after 3 weeks of loss, all they needed was to shakeout traders with a break of the SPX 100 day moving average and then squeeze shorts with a break above the 100-day moving average. These charts are what we expected to see, the evidence of distribution rather than confirmation, of a head fake rather than a move that intends to hold and build on itself.

 ES/SPX E-mini futures 1 min intraday

NQ/NASDAQ 100 1 min intraday futures.

Pother than the short squeeze earlier, internals have lost any positive momentum as price has been largely lateral through most of the day once the short squeeze was used up.

I'm going to check leading indicators. If I feel there's a solid trade that will last through the overnight session, I'll post it, otherwise we're on the right track, it's just letting the market do its job and watching and listening to the message of the market until we are at a high probability/low risk/well timed trade.

UNG Update

As I'm going through my watch list (patiently waiting for the charts to develop and mature) and looking for opportunities, I found UNG/Natural Gas looking interesting and I've had a long term interest in the future of NG.

I think you'll agree the charts look quite interesting here. I'll be seeing price alerts on the downside for a pullback, once we get that, it's simply a matter of checking the pullback for accumulation (a constructive pullback), these are the kind I want to buy.

 UNG daily chart through 2015 with a flat stage 1 base looking price range and a double bottom to the right.

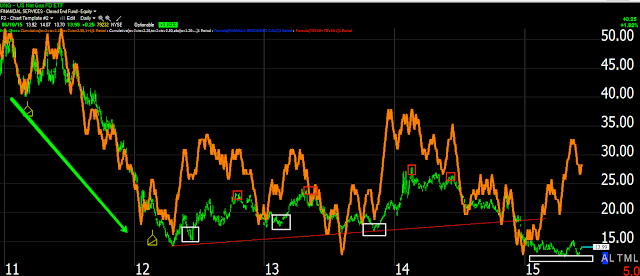
 On a 3C daily chart of UNG I've marked the divergence areas , note that through 2015 there has been a large leading divergence for the entire year and this in to a rather flat range.

 A closer look at the daily UNG chart with the two bottoms mentioned above to the far right with a leading positive divergence through the entire year.

I checked natural gas futures and on a daily chart they look very similar.
NG daily chart Natural Gas futures with 2015 right of the yellow vertical trend line. Note the leading positive divergence in the same place.

 The 60 min UNG chart with more detail in the double bottom area , a strong leading chart.

And the 30 min chart showing the first bottom with a head fake/stop run just before reversing to the upside off a positive divergence/base with 3C in line (no strong distribution at the downside reversal suggesting accumulation is taking place on a larger scale). The second low has an obvious leading divergence on a powerful timeframe.

As for the 30 min chart of NG futures, it has some similar evidence.
NG 30 min futures. There's not as much history which is why I prefer StockFinder over newer Worden software, but you can see the second double base low and leading positive divergence very much like the UNG 30 min chart above this one.


 The 10 min chart is not as strong as the charts above, but more detailed because of that and shows the divergence that turned UNG back down to the accumulation zone at the lows of the double bottom area with a very clear leading positive divergence at the area.

 The 5 min UNG chart shows the same

UNG is looking pretty amazing here, the issue is a pullback to enter at lower cost with less risk that we can confirm was accumulated before ever entering as I suspect the charts above will guarantee. 

There's a very small 2 min slight negative so UNG may be working on a pullback some time soon.

The short term NG futures also show some recent profit taking, also suggesting we may see a pullback soon.

NG 1 min intraday looks like mild profit taking, perhaps in advance of a constructive pullback.

Based on the charts above, I'd be VERY interested in looking at a pullback for a potential long entry. However since we don't have strong pullback divergences/charts, I'll be setting a series of price alerts below from here to about $12/50 and at each alert check the charts looking for accumulation of a pullback for a long entry.


Market Update-Futures

I whenever I'm quiet and not posting too much, that usually means I'm going through a number of assets/indicators, etc. In other words, when I seem least busiest, I'm actually the most busy.

I went through 10 different futures assets in 9 timeframes for each, there are some indications and evidence that is pretty strong, but I'll get to that in a specific post. One of the things that looks very clear is short term $USD strength again, not the counter trend rally kind, but like the 1-day move  on 6/5 off the 6/4 lows we had projected, something along those lines.

It looks like near term the Yen is going to give up some of those overnight BOJ/Kuroda based gains, but its bigger picture should continue to build and lift higher, again as near as I can tell, the carry trade *USD/JPY) unwind. While the $USDX looks like very near term strength which should help our USO short/put position, its longer term chart is very negative, again indicative of the carry trade unwind. I'm wondering if perhaps the $USD is discounting a possibly hawkish F_E_D next week and that's what the expected short term strength is about. As for the Euro, it too looks like it will come down off recent gains, I just don't have much faith in it long term doing anything positive like the Yen, in fact I think it will see further downside longer term, but I'll address these in another specific post, I just thought some of you FX traders would be interested.

Crude looks as expected, like it will see more downside.

Now as to the averages, it doesn't look probable that they'll come back down and form a stronger "W" shaped base, the short squeeze sing has been set free and it took nearly 3 weeks to wind so it doesn't make sense to come back down to attempt a stronger base when the strongest aspect of the move, the >SPX 100 day short squeeze has already fired. Thus it means I believe we'll be looking for the actual downside reversal that should carry on the previous 3 week down trend and slice below the 100-day and its way to making a lower low below the October lows, but as I wanted on April 2nd as this forecast was made, we'll likely see short term support last the 200-day below as well, as the forecast expected at the 100-day.

As for charts, damage/distribution continues to accrue, I don't believe we are done with this move timing wise and I already said I believe the 5 min charts will need to see migration of the negative divergence and go south, that should be the cue.

 The daily SPX and the upside target we have been expecting as all technical traders must be aware of the SPX's affinity for the 100-day. At the white arrow is yesterday's Doji Star reversal candle, but on a very sharp "V", which I don't ever trust to hold long as it's not a solid foundation. At the red arrow, resistance at the 100-day yesterday making it an easy and obvious target for short stops and long entries. The yellow arrow representing the short squeeze strength lent to the market, remember HYG's short term charts supportive as well,  but only short term as well as charts.

Judging by the rate of decline in the 3C charts, I doubt VERY much that this turns down today, we do have options expiration (monthly) coming Friday so that's something to consider as well. I suspect that the candlesticks will put in their own downside reversal with something like a similar Doji or star (in yellow-forgive my poor drawing).


 As for the SPY and migration of the negative divergence or "Distribution in to price strength", the 3 min chart is now showing the strongest, clearest path of migration or strengthening of the negative divergence.

The 5 min chart which is mostly in line will need to see the 3 min chart migrate over and turn the 5 min chart negative like the 3 min chart.

As for the IWM, the 3 min chart as well is where we have the strongest migration of the negative divergence and all of this in a single day which is pretty impressive.

The 5 min chart is already showing migration and a negative leading divergence, not quite as strong as the 3 min's divergence yet.

And the 10 min IWM chart refusing to confirm in any way this move, leaving it totally unsupported which is why I believe this turns at the 5 min charts.

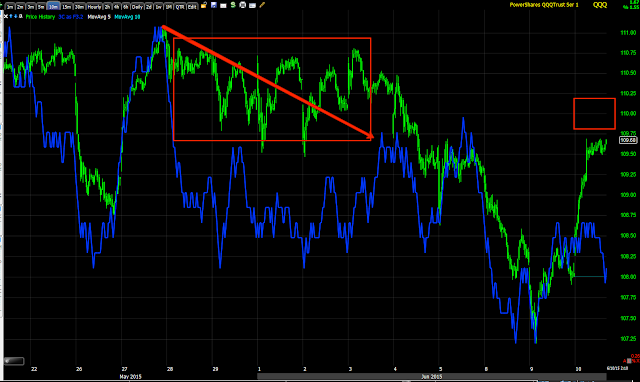
QQQ 2 min leading negative...

And QQQ 5 min leading negative are both interesting as is the flat range most of the afternoon where we often see the most or strongest 3C signals, again think VWAP and the stability of filling orders at a stable VWAP.

Again, like the others the QQQ 1o min never came close to confirmation, just the opposite so once again I suspect the 5 min charts are where the action will be and at the rate we are moving, while I don't expect a downside reversal today, if it weren't for options expiration  (monthly) this Friday, I'd say we'd be turning before the week ends, but with op-ex Friday, there's no telling since we have had nearly 3 weeks of trending down, I suspect keeping things where they are (roughly) will have the most desirable effect on options expiration.

Important Market Update

I'll try to keep this as brief as possible given intraday action develops fast.

As you know, I was expecting a head fake move/false breakout above the SPX-100 day moving average, this is where I hoped we'd get enough market support for watch list shorts that have been either flat or not doing enough to make an entry high probability or more importantly low risk which a bounce in them would do.

Yesterday I said a bounce / head fake move off a sharp "V" base would likely not stand very long, perhaps not even a day which is why or part of the reason why I suspected we'd see a slightly stronger "W" base. This is not for the kind of head fake move saw in May love the SPX's nearly 6 month triangle, this is a smaller shakeout related to the SPX 100-day.

Now I HAVE to consider whether this is the move itself and we are not going to see any "W" base for a slightly longer move.

 The SPX with 100-day moving average. Note the head fake/false breakout in May and since prices have been moving lower for nearly 3 trading weeks, that's because these head fake moves are one of the best price-based timing indications of an expected reversal, we see them nearly 80% of the time before a reversal in any asset and any timeframe.

The move above the 100-day is also expected to be a head fake move, in this case it's what we call a "Crazy Ivan", shaking out traders below the 100-day and then above the 100-day as it squeezes shorts and entices new longs in to a bull trap, IT IS FULLY EXPECTED TO FAIL.


For the sake of a decent or long enough bounce (regardless of the percentage move) to set up watch list trades at higher prices, I have expected a "W" base to form rather than this "V" shaped base seen above on the SPY 60 min chart as a "V" base is a reversal event rather than a  process and is rarely stable e to hold very long, I even mentioned it would likely have trouble holding through a day and perhaps fail on an intraday reversal.

The charts right now that suggest to me that it is failing beyond the earlier post, Intraday Capitulation include (as an example, not exhaustive list):

 After the earlier "Churning" indications from the earlier post, Intraday Capitulation, internals have been more positive than negative, but the trend has been flat, not a great sign for the market's move today.

The SPY intraday chart continues to deteriorate which is what we would have expected to have seen on both a head fake move and if we had a gap up and were going to see a move lower to a larger "W" base. Honestly I'm leaning more toward this being the move as the short squeeze was used up, it wouldn't be reloaded to the same effect a second time.

The IWM intraday chart continues to deteriorate

As does the QQQ chart, but just to show the move has no confirmation, this 3 min 3C chart of the Q's shows the move as nothing much different than the $USD counter trend rally we saw a couple of weeks ago-strongest 7-day move in more than 7 years that was never confirmed and failed as expected, just this would be on a smaller scale. The point is, the 3C chart's negative divergence looks the same no matter what asset or timeframe for a counter trend move that is destined to fail.

As far as migration or the strengthening of the divergence, we have that too in all of the averages...
 SPY 2 min at a new leading negative low intraday.

However, the chart that would have to turn for me to start entering positions for the longer trend trade positions we were looking for on such a move above the SPX 100-day would be the 5 min chart's positive divergence that built the last 2 days (below)...

 Here's the positive divergence and the chart is in line right now, we'd need to see migration of the negative divergences continue and move to this 5 min chart which I think is unavoidable.

Take a look at the same 5 min SPY chart in context and remember what I said above about the QQQ chart and the $USD counter trend bounce which is now over...
The SPY 5 min, the positive divergence at the sharp "V" is very small, again this is very similar to the kind of counter trend corrective bounce, it just had the benefit of a short squeeze.

In watching the charts develop and being a bit patient here, the difference would be between short term , quick trades and the longer term, much more profitable trending trades as originally expected to be entered above the SPX's 100-day as it creates a Crazy Ivan shakeout/bull trap.

Furthermore the failure of the market back below the 100-day as was originally forecasted on April 2nd and has played out almost exactly as forecasted (the market triangles develop, there's a breakout above them that fails, the SPX moved down on the head fake move and is temporarily supported at the 100-day and then slices lower and sees the same at the 200-day below, then moves to a new lower low below the October 2014 lows) would be an excellent incentive for the Treasury Flight to Safety trade sending TLT higher. PIMCO didn't exit such a large treasury position overnight in such an illiquid market, that happened over a period of time and that's likely what set up the TLT break below its long term trend line and the current counter trend trade set up we are looking for.

I'll keep you updated.