Friday, October 19, 2012

A Few Charts

I'm just going to post charts in different areas, you'll see why I like the probabilities for a move higher and also why I prefer to phase in here as with a little more time (just look at how much was done in a few hours this afternoon), we could have some very strong signals.

It seems once most options positions were closed earlier in the day, smart money was able to start positioning themselves as Op-Ex for the most part was essentially behind them.

DIA 1 min leading in the last 2 hours, strongly.

DIA 3 min leading again in the flat range.

DIA 5 leading in the same area after a large relative positive divergence

DIA 10 min usually won't lead like this in 2 hours.

IWM 1 min leading in the flat range after a large relative positive divergence.

IWM 3 m. again leading strongly at the afternoon range. 


IWM 5 min leading positive in the range

QQQ 2 min with a huge leading positive divergence.

QQQ 10 min, again that's a short time for such a long timeframe to be leading positive.

SPY 2 min relative positive followed by a leading positive, I'm guessing the initial stops were accumulated early and later the leading divergences came in the flat ranges as usual.

SPY 3 min relative positive to leading positive

SPY 5 min leading positive

TLT/Treasuries are a flight to safety trade nd trade opposite the market, thus they were up today, however the 2 min chart shows the position under distribution, money is likely being re-allocated to risk assets.

TLT 3 m also seeing the first negative divergence in 4 days

TLT 5 min nice and simple, accumulation, confirmation, distribution.

FXA or the $AUD is a leading indicator for risk sentiment, the positive divergence suggests $AUD will move higher, that will put it at a large positive divergence vs the SPX, this is bullish.

The Euro with distribution at a flat range at the top and accumulation at a flat range today.

Longer term Euro, again very simple, distribution, accumulation. The Euro has a positive correlation with the market so a move up in the Euro should support risk assets/stocks.

Tech-TECL 2 min insane leading divergence, almost as if they had to wait and when the waiting was over they went nuts.

TECL 3 min leading positive, this is huge itself. I get the feeling we will see Tech rotate in.

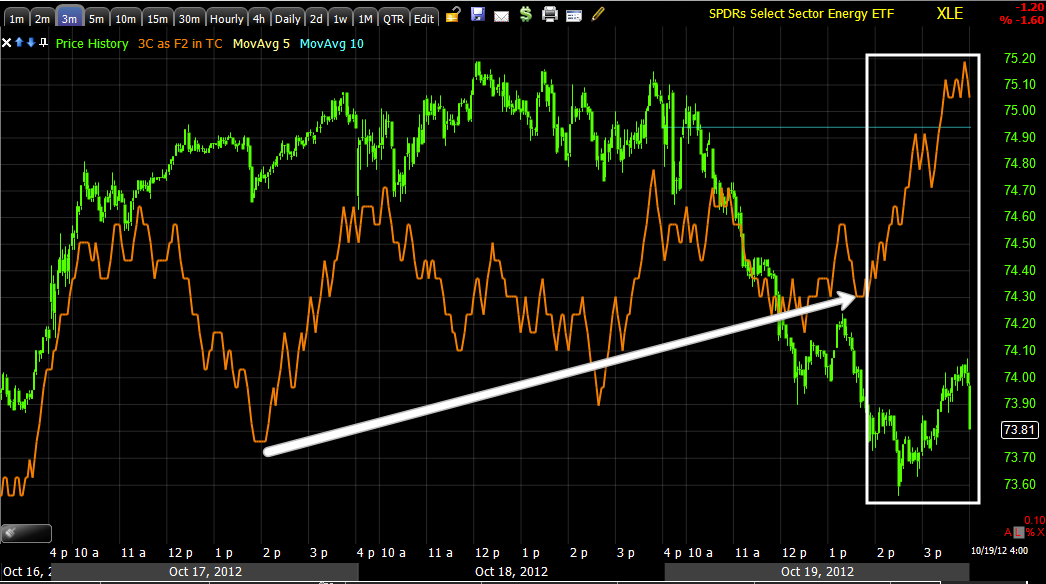
XLE/Energy 3 min leading positive divergence.

XLE 15 min shows the longer term is not so bullish, this fits with what we are expecting, a move up that will set up short positions.

XLF Financials 2 min from distribution in to the recent top to accumulation, XLF is in a good area to run a head fake move higher.

AS FOR OP-EX, THIS IS ONE THAT WAS VERY CLOSE TO RIGHT ON AT AN ESTIMATED $16 PIN
The pin is right in an area in which traders would basically have to have no opinion of where Financials go from the triangle that suggest a highly directional breakout to the upside.

XLF 3 min also clean and simple from distribution to accumulation today

XLF 5 min also simple, a leading negative divergence at the top and a large relative positive followed by a leading positive.

There's a lot of confirmation in a lot of different assets and assets that have inverse relationships.

I feel good about the late day entries and the size of them in planning ahead.

PCLN Closed Short and Game Plan

I feel like I might just have gotten lucky on PCLN; normally Core short or long positions are long term and they need very little maintenance, once you get a good tactical entry, the rest takes care of itself, but I had one regret with PCLN, that I didn't take windfall profits when I had the chance.


Today PCLN was covered for a 26+% gain in a non-leveraged position in a market that has been rising for most of the year.

 PCLN was entered at an average of $761.79 which is where the yellow box is and precisely where the red trendline is in that box, so as you can see, the entry was near flawless. We had a bullish wedge that was showing 3C distribution, we knew before it broke out that the breakout would be a failure and it would gibe us a GREAT opportunity to enter short with minimal risk at a great price.

It's the first red arrow that I regret, a drop of 17+% in 1 day, today I made up for that, but with 2.5 months of opportunity cost. Note volume is up also today, all these little changes in character add up to the message of the market. I took a look at 3C and here's what I found.


 First of all, I want to be short PCLN again as soon as the opportunity presents itself and I feel like it's a great opportunity. This 4 hour chart shows the big picture and even the negative divergence in April that earned us 26+% in a market that has been moving up, is nothing compared to the leading negative divergence now. Essentially, long term PCLN is still a GREAT looking short, it's just a matter of the tactical entry. If you see the white box to the far right next to price, I'm thinking I may be able to get PCLN in that area, higher is even better.

Why close such a promising looking short? Nothing goes straight up or down and Wall Street runs a lot of manipulations and games, some to game you, some to allow them to re-position which is still gaming you, it is these moments that 3C is good at finding and letting us do what Wall Street is doing. In fact we see them doing it long before price moves in the direction of the underlying trade, that's because of the size they trade in, it takes more time so we have to look for certain things like head fakes and 3C multiple timeframe alignment to tell us when we are close to them being done.

 All of these timeframes essentially show the sale 2 positive and 1 negative divergence in the exact same place, the most recent is a positive divergence meaning probabilities are high that PCLN moves up very soon. 2 min

 3 min leading positive

 5 min huge leading positive

 10 min leading positive with most of the leading this afternoon

15 min leading positive.

I showed the last little base area of about 1.5-2 days, so far we have a day in and we may see a little more so some of the more nimble traders may be able to pull off a quick long, although I think a leveraged ETF is a better tool for a situation and timeframe that we are expecting, but this was enough for me to close the position and wait for a new opportunity.

Adding UDOW

For large cap exposure

Closing PCLN Short

I hate to do it, this is the longest surviving Core short left from February-May 1, but I see signals that tell me I can get PCLN higher rather than sit through draw down.

It's been a decent position considering there's no leverage.


+26.52%

EURO and AUD

I just took a look at both currencies and for the move we are looking for, a volatility shakeout (which I don't want to mislead you, it has to be scary enough to force the shorts out and inspire the longs to come in the market in droves, but at the same time I don't expect a month long move to the upside or anything like that) both have the positive divergences needed, this is how we confirm our analysis, we look at a number of different assets and see what signals they are giving, as long as you understand the correlations, it's the entire premise behind 3C.

EOD Market Update

I think we tripped a lot of stops today for a very specific reason, ALL of the market averages are in positive divergences and improving rapidly now that they won't move the pin much.

I have no problem entering the leveraged longs for a move up early next week.

I'll get the charts out ASAP, but it probably won't be before the close, but I wanted you to know that a move to the upside market wide is looking very probable so you would have time to make any moves you need to make before Monday.

Speculative Positions

I do like TQQQ, it's kind of a leveraged way to play AAPL as the NASDAQ 100 is the underlying for the ETF and AAPL is about 20% weight of the NDX.

We have talked about rotation recently and how it hasn't been there in the market for at least 3 years, it all of the sudden reappears after QE3 is announced, we saw it this week with our longs in TQQQ and FAS. So I'm tempted to pick up FAS, but recall last night I said I think the next rotation if from financials to tech and the signals is FAS aren't there yet. I'll wait on FAS.

ERX is going to be the second, we are still looking for that head fake move in USO, but as we saw last week, ERX, actually XLE (Energy) outperformed oil, USO and I'll be picking up ERX again.

The next is XIV, Volatility but inverse so it moves with the market .

Finally TNA for Small caps, this also gives you some Russell 2000 exposure. (thanks Japhy)

Looking for some Ultra Longs

I'm looking for some Ultra or 3x leveraged longs, these will be speculative positions and basically there for the shakeout move higher we've been expecting.

Even though these will already be 1/2 the size of a normal position due to the Speculative nature, I also intend on phasing in, meaning I'll only be adding half of the intended position size today.

I'll let you know what I find, but I'm pretty certain TQQQ will be among them again.

FXP / FAZ -Short Term Pullback trades

With the market looking like this...

A 10 min negative divergence, highly suggestive of a pullback in the market which we have been looking for since Wednesday when we closed FAS and other short term leveraged long positions.

It should be little wonder then, when short term positive divergences popped up in FAZ and FXP the trades were taken, as mentioned last night, they are trades I intended to wrap up by today so they were always meant to be short term and they did well for us.

As for FXP today, as mentioned already last night, it was always my intention to wrap these up by the close today.

 FXP longer term is a position I actually like, it moves opposite the market so it makes sense as we look for core shorts after a bump higher, FXP should be looking good as a longer term trade and in that respect I like FXP a lot. As for yesterday's trade, that was always meant to be short term/pullback in the market ONLY.

 The FXP 5 min chart isn't confirming the upside today, it's not sideways here, but since it's such a new move I doubt it needs to do that. I have no problem and feel fine closing this down FOR NOW.

FXI has better volume, this is the opposite of FXP, it is the bullish ETF and trades with the market, it has a positive divergence on the same timeframe that FXP has a negative, so near term I want to take profits in FXP.

FAZ was entered for the same reason, we were long both FAS and FAZ this week and made money on both!

 FAZ-3x Bear Financials did well for us today considering we bought it yesterday for a short term trade and with the intention of closing it today. The 2 min chart should easily confirm if the move was strong, it didn't, it was just what we picked it for, an asset that moves opposite the market for a pullback in the market.


Longer term I like it, however like FXP, we are not there yet, but rapidly approaching!

FXP +1.88%
FAZ +4.25 today


Leading Indicators

Leading indicators are still very much in line with the 3 or 4 trend expectations we have, the pullback we were looking for since Wednesday materialized today, after the pullback we are looking for an upside shakeout move, after that, we should be set up to open core shorts in a number of issues, there are still plenty of longs though as I have explained, as mentioned, leading indicators support this view.


First CONTEXT...

Yesterday I said that I thought we'd see sector and Index rotation, I said specifically it doesn't mean one will be up, but the relative performance should be much different, take the IEM for instance vs the Dow today, there's a big gap in relative performance.

That started to slide in futures overnight
ES was rich to CONTEXT all night, only recently is the model showing ES to be overdone on the downside.

First Commodities
 Commods haven't been as bad today as the the averages, recently there's been a little difference in relative performance as well.

 Yields are like a magnet for equities, interestingly they didn't confirm the downside either and are also showing a recent loss of downside momentum.

 On a longer term basis, say our shakeout move up, yields have been negative at the last two SPX tops, they were positive going in to the bottom of the current or last SPX tun up and are still in a positive position vs the SPX suggesting that the volatility shakeout is still very much a probability.

 Big, Big picture and yields are VERY disconnected from the SPX, this is why we enter core shorts.

 Short term or intraday the $AUD which is more predictive than the Euro has held up better than the SPX, also showing a recent loss of downside momentum.

 Intermediate term you can see in white where the $AUD was in a positive divergence vs the SPX and in red a negative divergence and it has worked well, it also was positive at the bottom of the last run higher and also remains in a positive position relative to the SPX.

 Big picture, the $AUD is very negative at this SPX triple top, this is why we are looking for that 1 last head fake move to short in to as long as the charts stay consistent.

 The Euro is a better confirmation currency and the $AUD a better leading currency, here the Euro fails in confirmation in red and is slightly more positive in white on an intraday basis.

 Mid term, the Euro is more positive in the relation vs the SPX, from an arbitrage perspective, the SPX should have upside based on that alone.

 CREDIT-High Yield Corp. / HYG is actually at a bottom as the SPX moved lower, this is an intraday positive divergence.

 Mid term The HYG was also positive at the start of this last run and remains in a positive position vs the SPX, this is bullish for the SPX near term, like next week, although it's hard to imagine now.

Junk Credit is giving the same signals.

As I said, it's hard to imagine when you have a day like this, but often our best trades with the lowest risk are the hardest to enter.