Thursday, April 3, 2014

GLD/UGLD/GDX/NUGT Follow Up

I have open longs in UGLD (3x long Gold) and NUGT (3x long Gold Miners). Yesterday I posted GLD / NUGT and said...

"Just a quick note, despite the gap in NUGT and GLD/UGLD (as the market has been ruthlessly filling gaps the last 4-5 years), I have NO intention of letting go of either long position.

If I had calls on GDX with a gain, I'd probably take them and look for a new entry, as far as calls on GDX still in the red, so long as the calls are at least out to April (standard), I have no problem holding them.

NUGT is up 9.34% today, UGLD is up +2.26% thus far."

So we knew yesterday that a move down today and gap fill was very high probability, but also something that didn't concern me at all, unless it was an options position, I'd rather just wait it out than incur transaction costs trading around it.

So how do things look today that NUGT filled the gap and UGLD came darn close (-2.323% and 1.16% respectively)? Not bad...

As far as having very little concern about the two positions which I believe are both going to be putting in upside counter trend rallies (some of my favorite as they are strong and move fast)...

 UGLD stage 3 and 4 with 3C confirmation and stage 1 base for a CT rally on a 30 min chart, that's a strong chart/signal, it's not going to fall apart over a gap fill.

NUGT stage 3 and 4 with 3C confirmation of stage 4 and in to a stage 1 base & leading positive on a 60 min chart. Again, hardly the stuff of concern with a gap fill.

As far as what has transpired today...

There were a lot of moves in strong timeframes intraday that I wouldn't normally expect, especially in GLD/UGLD.

 GLD 30 min leading intraday

UGLD 30 min leading positive intraday

GDX with a nice looking reversal process, 5 min leading intraday.

Oddly the intraday to intermediate charts seem to favor GDX/NUGT a bit more than GLD/UGLD, I'm glad I'm already in because calling a specific entry today would be difficult, perhaps if you are interested in a position in either one we'll have a clearer picture of intraday timeframes for timing tomorrow, but as far as everything else, I have no worries or concerns about holding these here, they haven't even begun a counter trend rally and as I said, they are impressive and are often quite a bit longer than a swing trade.

GLD/UGLD intraday charts...
 GLD 2 min was leading earlier and toward the EOD kind of looks like it's not quite done consolidating, GLD did not make a complete gap fill, not that I think that this is imperative, but it may explain some of the relative performance /3C differences.


 GLD 3 min leading positive so the 2 min relative negative at the EOD didn't make it as far as the 3 min chart which either means it is not that strong and may only lead to a little pullback or it's not done with this particular divergence yet.

For me the outcome is the same, I'd still hold, it's just a matter of entries for add-to or new positions.

GDX/NUGT intraday
 3 min NUGT chart just flying, this is good to see, a constructive pullback.

GDX 5 min has the same character, you can already see the difference in underlying trade between Gold and Miners favoring miners on an intraday basis.

All in all, for me there's not much to do other than be patient, for anyone interested in a new or add-to position I'll monitor both for such an opportunity, but I'd guess we will be well on our way higher by early next week at the latest.

NFLX Charts

Here are the charts I promised...

 This is the 4 hour chart, there are plenty more that all tell me this is most probably a volatility shakeout of new shorts, I'll show you why in a second, but this is all the same concept as the shakeout of new shorts in a Head and Shoulders Top, that enter on what Technical Traders call confirmation which is the break BELOW the H&S neckline.

15 years ago this was a fantastic set up, since everyone went to online brokers and Technical Analysis, it's a fantastic set up if you know where to enter, you just can't enter at the break of the neckline anymore as that seems to be one of the fastest ways to get shaken out of the trade for a decent loss.

Here's a 60 min chart, some might call this "Oversold", I don't like terms like that, the facts that I have seen over the years suggest that Wall SZt. is just taking advantage of predictable trader actions and reactions and using the dogma of Technical Analysis which is entrenched by books like, "Technical Analysis of Stock Trends" by Edwards and Magee, long considered the bible of T.A. and many concepts there (although updated in about a dozen editions) are nearly a century old.

I sometimes assume that you see the cycles and the stages, but I shouldn't do that so I'm pointing them out here, stage 1 accumulation, stage 2 Mark-Up, Stage 3 Distribution/Top (which actually starts later in stage 2 and stage 4 Decline.

Just like the stage 4 of a H&S top, decline, which starts at the break below the neckline, it is very common to shakeout new shorts in what I call a volatility shakeout because they are predictable, their stop placement is predictable and its easy money.

I'm also pointing out that the 60 min chart is purely negative, so any bounce/counter trend rally is not likely to be anything more than that. In other words if I'm short NFLX as a trend trade with a 6 month horizon or more, I'm not concerned at al about a bounce/countertrend rally here.

The 30 min chart is where we first see a positive divergence, it's easy to accumulate in early stage 4 as there are so many new shorts providing supply at lower price levels and they don't seem to be too concerned with "who's on the other side of the trade".

 This is the 10 min chart, a "W" like pattern is in place already, just watch for the shakeout/stop run on a short term intraday basis.

This provides a great/cheap entry and low risk as a stop can be "REASONABLY" placed below the "W", not at an obvious level where other traders would place a stop; I'm always in favor of fewer shares for a wider stop, at least you have a better chance of letting the trade work and you can always add to it.

My target is based on the size of the base as well as the area I suspect BTC stops would be placed.

This is today's intraday action near the bottom of the base, thus it looks pretty timely.

Trade Idea: NFLX Long

I already put this one out with a reiteration... Trade Idea: NFLX Long .... Went with NFLX April (monthly) $355 & Equity long for Trading Portfolio

And left some room for an add-to...

"I took opened about a 2/3rds size Call position, just in case we get a little discount I can add to it and fill it out, the Trading Portfolio is leaning net short and I could use a hedge there so I went with a nearly full size long NFLX position, I don't anticipate it being much more than a swing trade."

I'll be filling out the positions, for the equity long, there's really not a lot of risk as a stop can be placed a few percent below, but I would personally leave some room for a stop run/head fake in the area of about $349.90. In fact, if you want to place a high standard on the trade idea and get the best entry/lowest risk, you might consider setting an alert for <$349.90 and consider that the make or break for a long entry.

I'll have some charts up shortly, the reason I mention a possible head fake is because it is already so close to support which would be a wider "W" base and they typically see a small stop run to give them some initial momentum as shorts will enter on a break of support and be caught in a bear trap and forced to cover as price reverses.

VXX / VIX Futures Update

I was just checking out the VIX futures or VXX (short term VIX futures), things actually make some sense there.

First we have the NFP tomorrow morning (Non-Farm Payrolls), I'd think with the ADP jobs data missing on Wednesday and Initial Claims missing this morning, the Non-Farm Payrolls are likely to be thought to come in at a miss tomorrow ands if the invisible hand at the Open Markets Desk at 33 Liberty Street in New York reaches as far as the BLS, then it wouldn't be surprising if the Non-Farm Payrolls come in at a miss, giving Yellen a little time that she could not buy herself at her first press conference which was at first take, a revival of Alan Greenspan's "Greenspeak" (muttering along for an hour and having no idea where he stood 60 minutes later), but realizing that she was just an absolute disaster.

In any case, I'm not an economist or a jobs forecaster, I don't think Initial Claims for a week makes that much of a difference and ADP is such a noisy series that I stopped reading their emails long ago when I was on the distribution list for their Payroll data.

All I can go by is what I expect based on what I see and then confirmation or non-confirmation of expectations based on what I see.

Here's what I see as of now for VIX futures/VXX...

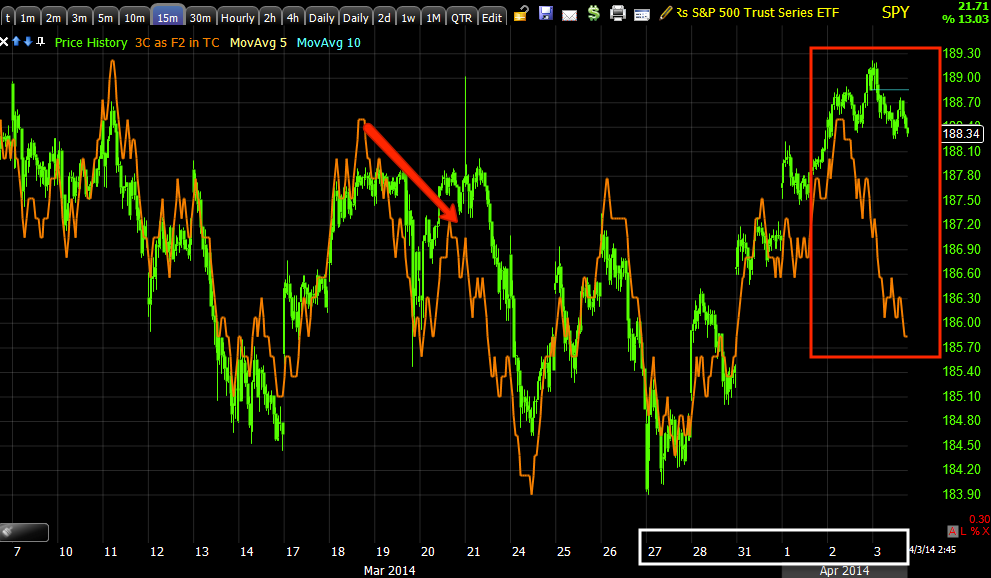
 We have the break of the trendline, the relative strength in VXX that was seen throughout even the February short squeeze rally, it seemed like it was never going to break (and thus never be accumulated in size), but it finally did and very close to the start of the Cycle (smaller) from March 27th. We want to see larger volume on the break of the diagonal trendline as well as the horizontal and there's a slight pick up (this tells us supply is available which is what is needed to accumulate as well as lower prices), we saw some of that, nothing spectacular though.

During the accumulation process it is VERY typical for prices to get very range-bound and volume to drop, you can think of it as Wall St. doing their business in a sneaky way that doesn't attract attention, no different really than the way you'd play poker, not showing your cards, trying to keep your "tells" under wraps. This is why I'm always at heightened attention in a dull market.

Looking at the price action since the break, does that look like a mature or proportional reversal process to you?

To give you a better graphic, this is something like what we have thus far, just imagine price shooting up from here, it would look very tight, angular and odd, not proportional.

This is still a tight process, but the bottoms are almost always much tighter than a topping reversal process. Note how I drew in price to create something like a typical "W" bottom and how the process is now wider, that would require that VXX come down a bit and if you saw the charts from the SPY Put follow up post, then you probably know what the VXX intraday signal looked like.


 "If' VXX dropped to form a "W" shape as drawn above, we'd need to see evidence of that in the form of a small negative divergence, intraday would do it.

It would also be VERY high probability that a "W" process would have its own head fake, meaning a lower low on the second bottom of a "W" pattern as this is a fractal concept. I'll be setting VXX price alerts for either a horizontal trendline or below the $40.70 area.


This is the same 1 min intraday chart I used in the SPY Put decision, there was an intraday negative divegrence as you see above so that fits nicely so far.

"If" the SPY were making a true head fake move or a bull trap, we all know that they aren't just a pop above resistance by a few cents like yesterday's SPY +.33% move, they are convincing and are usually a bit stronger than that as they clear the ask stack, so the SPY to set up a bull trap/head fake might...
The 15 min chart (with the smaller cycle highlighted on the time scale) is leading negative, so a NFP pop and a SPY move above would still have very high probabilities of being a head fake move and this 15 min chart would likely put in a deeper leading negative low as a bull trap is set up via distribution or even churning.

 As for the VXX 1 min in scale, you can see a lower low would help the accumulation process, but we are already leading positive, just not in a flying divergence that the VXX is known for at extremes. The other thing of note is the positive divegrence started on the first day of the break lower, this is not typical, usually it wouldn't start until the base region (I'm guessing the $41 area) is reached which implies some urgency.

 The 5 min chart is leading positiver, it doesn't have to go far for a flying divergence as I drew in, a second bottom or "W" would be enough to do it as far as time, we've seen these develop in an afternoon.

With almost any other chart, I'd be looking AT A LONG RIGHT NOW, BUT I KNOW AND A LOT OF YOU KNOW WHAT AN EXTREME IN VXX LOOKS LIKE AND THAT'S WHAT WE HAVE BEEN WAITING PATIENTLY FOR.

The 10 min chart already has the base of a flying , leading positive divegrence, it doesn't need to go far to put one in, note also I drew the "W" with a head fake/stop run (under the yellow trendline-thus the reason for the price alert).

 The 15 min chart shows the same kind of divergence already in effect, like I said, if this were any other asset, I'd already be looking at a long position.

Note that there was not enough distribution at the highs of the chart to show up on a 15 min chart implying that they used enough to move prices lower, but weren't eager to let go of any more than they had to.

 The same is true of the 30 and 60 min charts, both also have the same leading positive divergences as you see above on the 30 min.

VIX futures went positive at the first moment of the break below the trendline, they are still very positive on the 15 min chart.

VIX Futures...

We don't really have far to go as you can see above, but I think we have a little to go.

SPY Follow Up

Yesterday we entered SPY April $190 Puts... Trade Idea: SPY PUTS with the understanding that it would be a short duration trade, thus the need for leverage and the reason I used April options when I'd normally go further out.

"I'm going to enter what I think for the moment, will be a short term trade, however the longer term set up I don't think is far behind and I think you'll understand what I mean when I get out the next Broad Market Update I'm working on.

In the meantime, I'm looking for a quick move down in the market, I'm targeting the SPY April $190 PUTS, full position size."... 
From 
Trade Idea: SPY PUTS yesterday.

Here's the P/L and the reason for the closure of the position and what I'm thinking as the next move.


This was the full size position from yesterday's opening of the SPY April $190 puts, 100 contracts at a cost basis of $2.10
 The fill was $2.49, putting the gain at +18.5% which is fine, I wasn't expecting a large move yet.

About those expectations, as you look at the charts try to keep in mind what out perspective was as of yesterday without hindsight of today's charts. This also ties in to my earlier post on the smaller cycle trend.

 SPY 1 min, note what the chart looked like as of the close yesterday, today we see a small 1 min positive divegrence forming, although it's in Leading Negative position, this is like a small intraday bounce, there's no where near enough objective evidence for mew to trade this long, even though I think the probabilities are for an intraday bounce...once again the difference between probabilities and a high probability/low risk trade as well as dealing with emotional issues, in this case GREED or fear of missing a move.

 Looking at the exact same 1 min chart a bit closer, you can see yesterday's 1 min negative, although there were many more charts than just a 1 min and today you see a move in price JUST BELOW yesterday's afternoon intraday lows (typical shakeout of short term traders) and a positive divegrence intraday today at those lows.


This is the same chart looking at the SPY 1 min ion an intraday basis, my gaol with options is to get out BEFORE there's any slow down in momentum. We "should" see a small rounding/reversal process even intraday, but by the time that comes, the probabilities are high that the loss of downside momentum and time decay start eating away at the gains, thus I want to be out before that happens and if I have the chance, I can always re-enter the position at better levels in to some price strength/3C weakness.

This is the 5 min chart of the SPY's mini cycle, THIS IS WHERE IT'S IMPORTANT TO LOOK AT THE CHART FROM YESTERDAY'S PERSPECTIVE.

I said that I expected this to be a short duration trade, the reason why is yesterday we were making our first leading negative 3C low as you can see the first lower 3C low, thus we don't have a large or mature leading negative divegrence. Today we have added to that leading negative low with a second one so the next SPY PUT position (if it sets up), will likely be a longer expiration position, likely May depending on how deep the signal is and what the rest of the market, VIX futures, HYG, etc look like.

Other indications that would have given me more objective evidence to take the gains on what was expected to be a short duration trade would include VXX which usually trades opposite the market and its 3C signal intraday.
 VXX's intraday 1 min was going negative so that tells me it's likely to move down and the market up, thus I want to plan my trade and trade my plan and take the gains before that happens.

If you're not using 3C, there are a lot of other ways from MACD, Stochastics, RSI, etc, but  the intraday NYSE TICK and a few trendlines is a great indicator for early warning of trend changes intraday.
 Here's the channel of the 1 min NYSE TICK data which everyone should have, I don't want to wait until it's trending up, but note the small area where a lower low isn't made while we are still in the downtrend channel... that's early warning.


Or conventional indicators like a 50 bar moving average wghich I prefer on a 5 min chart as that's what a lot of day traders use, but that's too long for this kind of trade so a 50 bar on a 1 min chart does the job...
 I want to get out just as there's evidence of a turn in the m.a.

Or even better... Everyone wants to use the hottest new indicator or Holy Grail, but you can increase the accuracy and lead time on signals by using that boring old standby, ROC (Rate of Change) and apply it to some of your favorite conventional indicators.
 ROC of the 50-bar 1 min ma shows a divegrence and that's early warning that the trend is changing or at least the character or the trend.

Or... For Worden users since you can't apply ROC directly to price, apply it to a 1 bar moving average of price which is the same as price and make the m.a. invisible, apply RPOC to that and you are using the ROC of price.
Again a divergence showing the character of the trend is changing and changes in character lead to changes in trends...

I hope some of you made a nice little double digit return for barely any market exposure.


Closing SPY $190 Puts

I'll have a follow up

Broad Market Update (Mini-Cycle)

I think the reason this particular mini cycle from March 27th is important is not only that it's the first one that has  been or was able to break the relative strength in VIX futures or VXX as I have posted recently VXX which should move opposite the market was showing such broad relative strength that it was moving up with the market (there are some reasons that can happen that have to do with hedging, but I don't think they are relevant in this particular situation, at least not to the degree of true demand that we saw supporting VXX/VIX futures) and this breaking of that relative strength has been an issue for 3-4 weeks. I think nearly 3+ weeks ago I said, "I'd like to look at some VXX longs, but there's too much relative strength in them to be able to buy them on price weakness, thereby lowering risk, which may not have seemed important then, but it sure would right now if we had bought by chasing the asset...we'd have bought near highs in VXX and be at a loss right now, that's why we don't chase assets, but rather let them come to us.

The other reason that is VXX related is Wall St. knows what the tape is, like Jesse Livermore of old who could read the tape and know where the market was going to go, it wasn't immediate like some wonder indicator that said, "NOW", but he could read the trend as he started out as a runner as a young boy in a bucket shop and learned tape reading. In much the same way, except to a much more advanced degree, Wall St. knows the tape,m they know the flow of funds that aren't represented in price action and they use price action now to get their positions in line with the underlying flow of funds or the tape which is what we are doing, piggy-backing the big boys, right or wrong, they move the market.

It was and is my opinion that VIX futures (VIX is also known as the "Fear Index" and as we know Fear and Greed are the emotions that move the market with fear being the stronger of the two) will be accumulated hard before a serious downside pivot, but in order for that to happen, just like us, they aren't going to chase the market, they'll bring VIX prices down, accumulate them before the market is to make a significant turn and that's what I have been looking for. If you are looking at price alone of VIX futures or VXX, you might conclude that the pros are rotating out of protection and in to risk assets, but that's an incorrect view of how the market works for so many reasons, from the chasing to just the logistical difference in how they have to trade because of size and how if they aren't careful, they'll push prices against their position (say dumping a large block and knocking prices down when they have more to dump, now they have to do it at lower prices or even a  loss).

So this mini cycle has been important and when we look at it in the perspective of "Multiple Timeframe Analysis" it's even more important. I don't have to get in to what the "flying divergences" (extremely strong leading divergences that we tend to only see in fear based assets like the VIX futures/VXX) look like and when they appear we know there's a major trend change at hand as well as how fast they can develop, we've beaten that horse enough.

In any case, we saw this mini cycle last Thursday the 27th, in fact the first part I saw earlier in the day and took some action to protect profits in puts like Closing XLF April $23 Puts for a +55% gain. Later in the day, after not seeing any divergences in the averages beyond 2-3 minutes, that Thursday the first 5 min (respectable) positive divegrence showed up.

You may recall how I felt about it at the time (the difference between probabilities and high probability/low risk positions not being the same thing)...

"So after a week of divergences that were in place for 2-3 days, but none beyond 2-3 mins., today we transform from a slow signal environment to a suddenly increased signal environment in which we have many market averages with at least 5 min positives and some even with 10  min positives, yet I have not been running around crazy throwing positions out there... I did close a some that I felt were not going to gain any more or not much more that would make the risk I'd face a reasonable proposition.

So why not add long positions like 3x leveraged ETFs or Call options? 

On a day like today with divergences building and some building to quite long timeframes, it's hard to keep your finger off the trigger, but just like I had to conquer fear, I've learned over the years, "IT'S OK IF YOU MISS A TRADE, THERE'S ANOTHER BUS COMING". 

If I don't feel that the situation is as favorable as I can get, sometimes I'd rather let go of greed, take a chance and possibly miss the trade, I think it's far better than taking what might be considered a sub-optimal trade."

And then there was a list of the reasons I didn't feel this was a move that was worth the risk.
This is the smaller cycle that aligns with the larger February cycle, thus for me, it's important... first because of the VIX futures accumulation and as it has developed a little more, because it is lining up in multiple trend/timeframe analysis with the tail end of stage 3 and in some cases like the IWM stage 4 of the larger February cycle.
 This is the Feb. (larger) cycle in stage 3 for the SPY, the IWM already made stage 4 with a volatility shakeout. The smaller cycle that I'm showing below started with 5 min positive divergences on March 27th (Thursday), but 1 day only which isn't enough for me to feel strongly enough about the probabilities to deploy assets, but rather to be patient, manage current positions and wait for the market to get in to position where we can enter larger trades that come to us with much stronger probabilities.

Note how the mini cycle aligns with the Larger cycle?

 This is the smaller cycle from FMarch 27th's 5 min positives which were 1 day (that Thursday) and were the first time on more than a week of preceding trade that any positive divegrence moved past the 3 min mark which is kind of my unofficial line in the sand, as asset must have at least a 5 min divegrence to have enough reason to trade.

Again, you can see how this smaller cycle has dovetailed with the larger one nicely, so now it's not only the VIX Futures that are a good timing indication for a strong market pivot to the downside, but the health of this mini cycle as well.

SPY 2 min...If we look at the SPY you may recall we had symmetrical triangles in all of the major averages on 3/27, for technical traders these are consolidation/continuation patterns, they have no inherent bias of their own like the ascending or descending triangles, but rather depend on the preceding trend entirely to give them a bias and the preceding trend was down, meaning most technical traders would expect that triangle to break to the downside and start the next leg lower, this is where Technical traders get chewed up and used all of the time because they are so predictable in what they will do or how they will react to these price patterns, thus as we could have predicted even without 3C signals, the triangle does the opposite of expectations and breaks to the upside.

The stages are color coded, stage 1 accumulation in white on a 5 min leading positive divegrence market wide that day, stage 2 in green which is mark up and you see 3C making higher highs and lows with price, then stage 3 distribution or the top in red and you see 3C makes the first lower low with a leading negative divegrence, thus I liked the SPY puts yesterday and continue to like them as a hold as they are at a double digit gain right now.


 SPY 3 min, remember the longer the timeframe the less detail, but clearer the trend.  Again we have moved from stage 2 to stage 3 and thus the SPY Puts from yesterday are working today as the divergences looked great, this had nothing to do with price position for me, it may have in creating the divergences, but I wasn't shorting a new high.

 And the SPY 5 min with the original 5 min positive on the 27th and the leading negative right now.

If we were to overlay the smaller cycle on the larger one note the overall 3C position, more an d more deterioration the further in to stage 3, even at a new all time high.

If I labelled the larger cycle, you may recall we first saw accumulation Jan 27th and it ran with a head fake move lower, then a small "W" at the lows that all we positive divergences or stage 1, you can see stage 2 which was noted Feb. 4th that it would have to be incredibly strong to change sentiment to bullish which is the reason it was run, to allow the pros to off load shares via selling or shorting (they both come across the tape as a sale).

Note the position of price and 3C at Points "A" and "B", again further deterioration of stage 3 and the entire Feb cycle looking exactly as we predicted before it even started to move, this is where the cycle is moving to stage 4 (IWM already has).


 DIA 2 min from the 27th

DIA 3 min

And most importantly the DIA 5 min

IWM 2 min, this is a bit sloppy, always move to the longer timeframes if there's not a clear picture, remove the noise.

 IWM 3 min has a cleaner trend than the 22 min chart above.

And IWM 5 min.

However in the IWM's case it is already in to stage 4 and a volatility shakeout.

IWM 10 min trends are clearer.

QQQ 2 mi again you can count the stages, 1 (accumulation), 2 (Mark up), 3 (Distribution) and the leading negative is moving to 4.

 QQQ 5 min, that makes things pretty clear.