Monday, April 9, 2012

Taking a Quick Look Around

So today is what I've been calling a 'TOFU" day, the only thing on the US economic front today was a 3 and 6 month bill auction, the main event is Bernie speaking at 7:30 tonight. Europe was closed o there wasn't any bad news (of which I expect plenty) today. Today was a perfect day for the market to do some backing and filling, but whatever happened around 3:30 happened pretty fast and it still isn't clear to me what exactly it is.

As mentioned earlier, ES quickly retreated BELOW its VWAP starting around 3 p.m. and really picking up pace minutes before the close, by 4:30 ES was trading at 1374.25 which is only about 1 point off the intraday lows after having reached 1382.75. Think about that, ES gained 8.5 points and then lost all but 1 point in the last hour of the day.


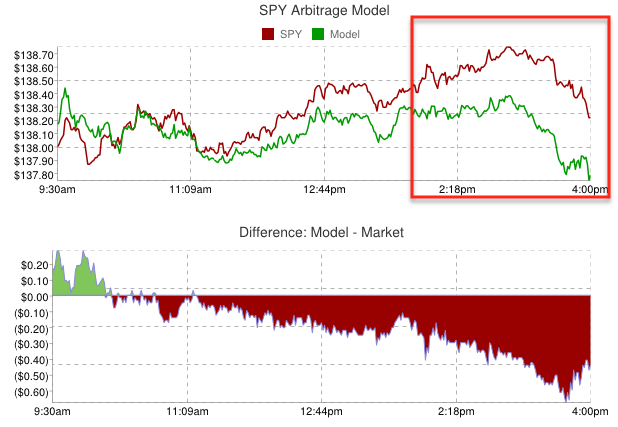
ES actually moved below the CONTEXT model and quite sharply as you can see to the far right.

 The SPY arbitrage model lagged the SPY all day, which isn't surprising as I don't believe this was anything more then a technical move (backing and filling the gap), but look how fast the SPY model fell apart toward the end of the day, easily moving to a new low, although the SPY didn't see quite the same momentum.


The VIX actually had somewhat impressive day, but is still very far below the implied value.

 Here's the descending wedge behavior in the VIX I mentioned today and many times in the past, the first move was a false breakout as that is what technical traders expect to happen based on years of indoctrination that Wall Street uses against them. The VIX went on to do what wedges almost always do, form a base. Today the VIX was very close to breaking above that base.

 The daily 3C positive divergence in the VIX now is much stronger then the last divergence that sent the market lower by 20% last July.

 The VIX also broke above its 50 ma today.

Look at the momentum in the VIX in the afternoon.

Some other important averages and their 50-day moving averages...
 The Dow-30 broke its 50 day today.

The Russell 2000, which should lead any risk on rally, broke its 50-day decisively.

You might expect with a little intraday bounce to see yields rise and bonds fall, not the case...
TLT was flat all day, for at least today, there was no rotation out of bonds and in to stocks.

As far as the sector that carried the day, it was Tech as you might imagine, but remember what the Q's and AAPL looked like on 3C today (and when I say Tech, I pretty much mean AAPL).

 XLK's relative momentum vs the SPX...

XLK vs XLF, but even Tech retreated pretty quickly at the end of day.

The 3 main risk groups broke down like this: XLF -1.48 ,  XLK -.66,  XLE -1.26.

HYG (High Yield Corp. Credit) broke below its 100 day moving averge today for the first time since November.


 HY Corp Credit was not excited about stocks' attempt to bounce.

 Longer term as I suspected, Credit made a new low here.

High Yield Credit which considering its beta and its cheapness would be an obvious place for risk on money to flow to, yet it made a new, lower low today as the market started to turn down. Credit is obviously worried about something and has been for some time.

The move in the $AUD was definitely interesting (see last post), but the retreat in ES and the market in general can't really be attributed to dollar strength.

While supportive of a bounce earlier, it didn't see the kind of upside momentum later that would turn ES like it did.

For those in to Dow Theory or Dr. Copper, the divergence between both and the Dow-30 is obvious, but this is what I've been showing you in the underlying trade for some time so it's not surprising, it is however a red flag.

 Transports in Green/Dow 30 in red

Copper in green/Dow 30 in red.

I've been saying (generally speaking) I wouldn't be long anything in this market right now, the worm can turn too quickly to get out of the way. So much for Goldman's long the Russell 2000 call discussed last night.

As of today's close, up to 43 days of R2K longs are now at a loss, that's nearly 2 trading months (22 days per month)

R2K as of today's close.

In any case, something odd seems to have went down today, maybe Bernie' speech will shed some light or perhaps this is just the continuing change of character.

The dominant P/V relationship in the major averages was Price Down/ Volume Down which only tells us the market is not in an oversold position, although that is to be expected on today's light volume.

Today's movement came from lower than avg. volume (NYSE 725 mln, vs. 805 mln avg; Nasdaq 1330 mln, vs. 1699 mln avg), 


Decliners outpaced advancers (NYSE 640/2387 Nasdaq 466/2079), and for the first time I can remember in a long time,  new lows outpaced new highs (NYSE new highs/new lows 23/59 and NASDAQ new highs/new lows 28/72).


The A/D ratio however is enough to create a 1 day oversold condition, that is unless we are t the edge of the cliff and then 1-day oversold conditions won't matter.


I have a feeling something is going to hit the wires soon, maybe from Bernie' speech, maybe on the EU open, but today's market action just didn't feel right toward the end of day, or in other words, something is changing. You know where I have stood on this market and a snap wouldn't surprise me, when the snap comes is often a surprise.


The last month and a half or so have seen the underlying trade deteriorate badly, not only in 3C, but breadth, margin, flow of funds, insider selling, credit markets, carry trade unwinds and now the re-emergence of EU problems and that apparent problems in the US and China as well.


I'll probably update again after Bernie speaks or if anything unusual happens in ES or currencies.


Not Sure What Changed....

However starting about 3 p.m. and intensifying in to 3:30, something looked to change in a hurry. I'll need to update and get some scans running, but one obvious red flag I see sticking out is the $AUD which tends to be a good leading indicator for the market.

 Here's Sunday night's open of the $AUD/USD pair (part of a carry trade favorite that has been under pressure for over a month). The $AUD opened with a bit of a slide, but by 9:30 New York time (market open), as mentioned in a risk layout update, the $AUD looked supportive of an intraday (maybe longer) bounce to back and fill some of the gaps created from Friday's NFP miss. The green arrow represents about the time of the NY open to close.

 Around 3 p.m. something changed in the $AUD, I'm not sure if there's some fundamental economic data out, but the decline started and became very sharp in to the close.

Take a look at what ES did over the last hour of trade...
ES crashed through its VWAP on heavy volume retracing a significant portion of today's intraday move.

I'll keep digging around and run some scans to see what's up here. It could be as I suspected earlier, today is a "Tofu" market day with little on the economic front and with Europe closed, there's no bad news coming out in the way of sovereign yields pushing toward 6%, especially in Spain. It my simply be  market participants took what they thought they could get today and backed out in a hurry before the close.

I'm sure some more digging will turn up something. All in all, I'm pretty happy with USO's close. While USO may or may not break with the $USD correlation, we've seen accumulation cycles set up before and they will run that cycle to completion even if it breaks with the $USD correlation, although that typically doesn't last too long.

QQQ Update

The Q's have been one of the most unimpressive of the market average ETFs today, even for a gap fill bounce.

 QQQ 5 min shows only  a very small relative positive divergence today, the negative divergence is much bigger.

 That weakness is being fed from the shorter charts like this 2 min that went deeply leading negative toward 3:30

 The 1 min never even made it to intraday confirmation.

The most obvious place to look is of course AAPL...

 AAPL 2 min chart could have easily confirmed the move in AAPL today a long time ago, it didn't happen.

The 5 min chart on AAPL remains leading negative. Something is changing in AAPL before our eyes and we've had warning about this, price is often deceitful, but as I remind you every now and then, about a month or so ago a -1.7% decline in the Dow-30 had a month of longs under water. In other words, when the worm turns, it can be brutal.

Positions-FAZ/AMZN/USO

I went with 1/2 size positions in FAZ May 22 calls for the model portfolio and AMZN May 195 puts.

At this point, I'm willing to keep the USO trade open (it can act somewhat as a hedge if need be), which is up nearly 10% for today.

Here's why I still like USO

 The intraday 1 min chart has held up pretty well thus far.

 Both the 5 min above and 15 min below seem to have longer positive divergences in place and as mentioned, it' a hedge to some degree if I'm too early on FAZ/AMZN, but the nature of how quickly the market seems to be changing in the last 30 mins when smart money is most active is impressive.

Financials

I want to get this out quick, XLF's 3C chart is turning negative, FAZ is turning positive. I will look to re-establish the FAZ Calls.

Also I'll look to re-establish the AMZN puts as that chart appears to be breaking down as well.

AAPL is another that 3C is breaking down on. I'll probably go with some 1/2 size positions as I already have coverage in tech.

BIDU Update

BIDU is another that looks like a major triangle top with a probable head fake breakout/bull trap. I have maintained the put position there as I want some short side coverage in case of an overnight surprise even and with Europe opening tomorrow, you just never know.

 Here's the suspected head fake/bull trap breakout from a large triangle, usually these are tops. BIDU gave a confirmed reversal signal after breaking out of the large triangle and looks like it is seeing continued selling in to any strength.

 The 60 min chart has gone leading negative since the breakout, the daily charts are already leading negative. I'd estimate conservatively that 80% of the time before we get a major reversal we see head fake moves like these and when they fail, they tend to fail spectacularly.

 Today's intraday action on a 2 min chart shows no confirmation at all and a leading negative position.

The 1 min is just as bad if not worse. If you are interested in BIDU and don't already have a position there (short), you may want to consider phasing in to the trade, adding a little on days like this and the rest can be added on a worsening divergence or a break below the $144 area and a move back in to or below the large triangle.

SPY/ QQQ intraday confirming ES

 QQQ 1 min is hitting  a relative negative intraday divergence.

 No 1 min strength bled in to the 2 min chart and it has been leading negative most of the day, again implying selling in to strength.

 While the SPY looks like it has decent intraday confirmation and strength on the 1 min,

A closer look shows that looks to be starting to fade.

ES Update

Again, as expected, ES is showing underlying trade suggesting any strength is being sold as ES is now approaching a new leading negative low and is currently at the worst reading of the day, again suggesting that strength in price is being used to sell in to or short in to.

Risk Layout Update

This is an update to the earlier Credit, currencies, etc update; thus far everything looks as it should indicating an intraday bounce, but nothing that is changing underlying sentiment and trade, just the typical wiggles and increased volatility we talked about.

 High Yield Credit is moving to its intraday lows, it is not interested in following the market, so there's a divergence there, where as earlier it looked to be somewhat supportive of an intraday bounce.

 Yields were also somewhat (mildly) supportive of an intraday bounce, since they have diverged with the SPX and are now in a negative position.

 The Euro showing early dollar weakness was one of the main factors that was supportive of an intraday bounce, legacy arbitrage (weak dollar=stronger risk assets). That is starting to taper off. We'll want to keep an eye on USO, although I think it has more to go in the near term, but  stronger dollar will pressure almost all risk assets, especially oil.

 The $USD's early weakness was supportive of an intraday bounce and probably part of the reason we saw some positive divergences on the short timeframes in 3C on the averages. The dollar seems to be leveling out.

 HY Corp. Credit is also not willing to follow the SPX/Market as a risk asset, again, the credit markets are much bigger and much more informed then the equity markets.

 From Thursday through today, the relative performance of the major Industry groups vs the SPX, you can see financials have fallen out of bed from Thursday's action. The safe haven assets are more in rotation vs. Thursday, Utilities, HealthCare, Staples. Energy hasn't seen that big of a change and this may be supportive of the USO trade from today. Basic Materials have fallen off, as well as Industrials. Discretionary is relatively unchanged, Tech is surprisingly strong.

Looking at this afternoon only, Financials are showing better relative performance (thus closing FAZ and looking for a better entry), Energy is looking better as the day moves on as are industrials. Tech and Discretionary seem to have lost momentum and as you would expect on some risk on mood intraday, the safe haven sectors are declining this afternoon.

All in all, no surprises really except the strength in Tech since Thursday and more recently it seeming to lose some momentum.

ES/S&P E-mini Futures Update

ES looks like what I would suspect on any intraday bounce. While I'm not saying I think the bounce is done, I am seeing negative divergences in to higher prices.

The positive 1 min divergence in ES (white) got ES moving up, however 3C is NOT confirming the move up and is showing a negative divergence like we have seen on every bounce over the last several weeks, suggesting once again, any strength in price is being used by smart money to sell in to. As market makers and specialist must take market orders and as the NFP print came on a day the market was closed and festered in retail's mind all weekend, retail obviously put in the sell orders (many probably before heading off to work) and the middle men have to accept orders to fill at market. I believe this is why the NYSE TICK was so extremely negative right on the open. The MMs and specialists are probably not keen on holding inventory at the opening levels and would be looking to sell that inventory in to any strength they can conjure up through widening the bid/ask spreads, some tactical breakouts, etc.

AMZN/FAZ


FAZ was a decent 1 day gain and this is about the 4th AMZN trade that has made money, although not as much this time.

I see a short positive divergence in AMZN and a negative divergence on FAz, both I expect to be short lived, however why not take the gains and re-position?  I'd prefer to reposition today if the signals come through, but I'll wait on those.

 AMZN 2 min 3C trend, note the positive divergence today that is leading positive, this looks like a bounce in AMZN.

The premise of the AMZN trade was a head fake breakout above resistance, in yellow we saw a nice candlestick reversal confirmation and AMZN broke back below the head fake level, however as we almost always see, when important support is broken, there's a volatility shakeout. If I'm a longer term trader I ride it out, but since the signals are pretty clear, it's been easy to trade around them and this makes about the 4th profitable AMZN trade since this head fake breakout started.

 AMZN's longer term 60 min trend, leading negative. This is why if I'm a longer term trader I wouldn't mind holding AMZN, but again, with the clarity of the signals, important support having been broken, I'd rather take the profit and reposition for the next short on a volatility shakeout.

 FAZ 2 min 3C trend with several positive divergences, although there was early confirmation, the leading negative intraday suggests a gap fill is likely, again, with good signals, why not take the $ and reposition.

FAZ 15 min longer term trend looks very good with a strong leading positive divergence, in yellow is the gap area, we know how often gaps are filled. Still, if the opportunity presents itself, I'd prefer to re-enter or re-position before the close, that's not something I control though, we'll hve to let the market tell us where to re-position.