Friday, October 11, 2013

EOD Wrap...

I'll probably put out a video or a more comprehensive weekly wrap over the weekend, I like to step back from the market for a day or so and look with fresh eyes, but I did find the close interesting and couldn't resist commenting on it especially because of this post, "Market Update/EOD Hints" which was posted 1 minute BEFORE the EOD ramp in to the close and especially because the post written 15 minutes or so earlier (before it was posted) started like this...

"It doesn't matter too much what the market does price wise from this time (meaning 2:30-close after the op-ex max pain pin is no longer that important).

The reason why? Simply, if we have some very negative signals in to the close, the probabilities are higher that next week the market picks up where the actual signals left off, not where price left off, we have seen this numerous times whether it be day to day trade or over even a 3-day weekend.

In fact, if underlying trade is suggesting a move down via negative divergences, then a strong closing ramp draws in the weekend warriors who work 9-5 and place their limit orders "based on what price did", over the weekend or early Monday morning before they head off to work. THESE ARE THE SUCKERS THAT GET CAUGHT HOLDING THE BAG IN A BULL TRAP SCENARIO, it's for this reason that EOD price action on a Friday after the op-ex effect of "Max Pain" has diminished is of little concern to me, but EOD 3C signals are very important to me."


Almost predictive of Wall St. behavior, I think it's of some importance to see what the really important clues looked like... I don't want to get too caught up in this "correction/pullback" scenario because it's really almost immaterial as the move that means something to us and is helpful is a move higher in the market.

The only reason a correction is important is for 1 VXX Call position trade of speculative size and more importantly, to give the market a wider footprint or base from which to launch it's bounce/rally from, THAT'S IT!

So considering the current working theory is that we get a market pullback that is constructive (helpful for the bounce/rally we expect to proceed it) and as I have already posted in several different versions... may look something like this...

Option "A" is what we already have and that's a "V" reversal, besides being rare, they also are a reversal "event" rather than the much more common reversal "process". The reversal process offers a larger footprint which can support a stronger reversal (up) move and that is because the market has a chance to accumulate a larger position that offers more support.

Option "B" is a pullback, although not that deep, however it is just about what CONTEXT is calling for right now which is VERY interesting.

Option "C" would fill the gap and offer a much more stable base from which to rally from, it would most likely be a constructive pullback which would also offer us some higher quality short term trades. Finally it would give us a better set up for core short positions and this is the most important reason for a bounce/rally at this stage in the market, in fact in my view, for Wall St. it is the only reason.

Now for something truly ironic considering the last article I posted re: End of Day (EOD) trade, the ES (SPX Futures) CONTEXT model. One thing you missed in what would have been a 90 chart post last night was the chart showing ES and CONTEXT meeting or reverting to the mean, this shows as we have seen in the past, the CONTEXT model can be remarkably accurate.

You know I've been calling for a pullback since Thursday when we picked up some VXX calls for said pullback in the market, that was before this SPX futures model, CONTEXT started saying the exact same thing starting around 5:30 this morning with a very small dislocation and ending at 4:42 today with a differential between ES and the model of $18.5 ES points, which would create a pullback equivalent to the one I drew above in green, but CONTEXT has further room to erode as futures open Sunday.

Just as interesting are my comments above from the EOD post before the market closed, basically,

"It doesn't matter what price does the last hour to me, it matters what 3C does"  and CONTEXT is pretty clear that the way it sees institutional risk assets, smart money is preparing for a pullback, so the little EOD ramp which is insignificant technically, really means nothing compared to what follows.

For instance these EOD 3C charts become very interesting, not only because of their negative divergences, but because they say smart money is selling in to the end of day ramp just like the CONTEXT model says smart money is selling the assets they are known to almost exclusively trade like credit risk, interest rate curves,  or carry trades, etc...

 The 3 min intraday DIA chart shows clear accumulation (the same time we bought VXX puts) and today we see even stronger distribution (as we bought VXX calls). Compare the end of day ramp in price compared to the size and strength of the leading negative divegrence, that's telling us the distribution or selling of the DIA by smart money is huge, but still of short duration just like the move we expect.

Or how about the Q's? We see perfect price/trend confirmation as 3C moves with price until today at the price highs, then we see underlying trade via 3C showing massive distribution, even in to the end of day ramp.

Again, although the divegrence is impressive, it is short in duration and the timeframe (3 min intraday) which fits perfectly with our idea about what comes next put forward Thursday.


Or take the SPY, once 3C distribution starts, the SPY can't make any higher gains, there's selling taking place preventing gains and the end of day ramp? Still distribution.

So 3C not only does what we'd expect since yesterday, but fits perfectly with CONTEXT.

How about the Index Futures like TF (Russell 2000 Futures)
We see that premarket accumulation that sends price higher today and distribution throughout the rest of the day, PARTICULARLY WE SEE DISTRIBUTION AND VERY STRONG RIGHT AT THE END OF DAY RAMP MEANING WHILE PRICE LOOKS BULLISH, SOMETHING VERY DIFFERENT IS HAPPENING BEHIND THE SCENES.

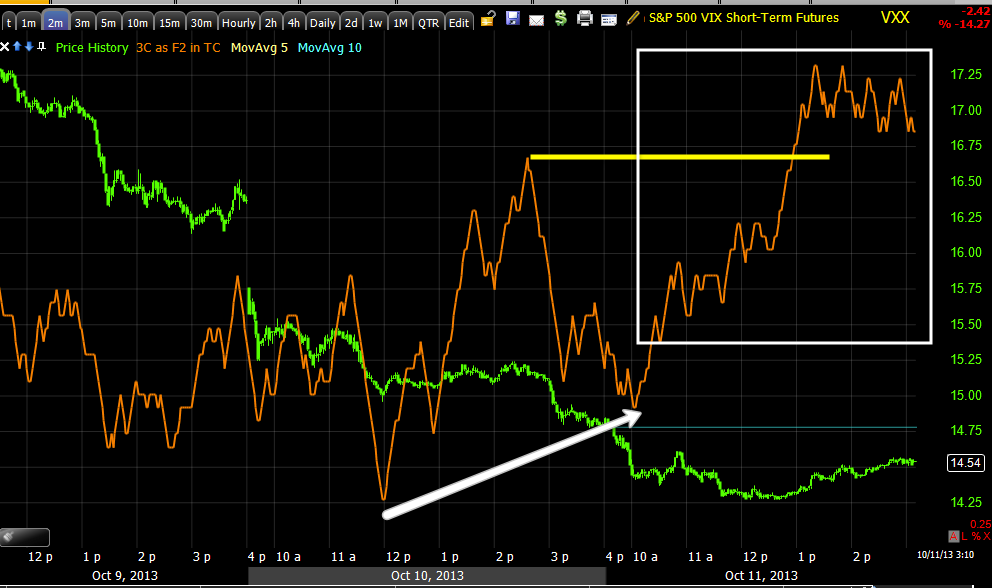
What about other assets? How about out VXX Call?

The negative divergence worked perfectly for our +40% VIX Put, this current positive divegrence in VIX futures should do justice by our recent VXX call position, VIX also trades opposite the market.


Our VXX Call should do well with today's leading positive divegrence adding to yesterday's.

Take a look at what happened to credit today, an institutional asset...
We have accumulation here as the market reversed Wednesday & Thursday as we expected, but look at the distribution today in High Yield Credit.  Is it any wonder CONTEXT looks the way it does?

There's a lot more than this, I've just scratched the surface, but it looks like we have a near PERFECT call on the market, it has been a great week thus far as far as our expectations and trades have gone, our expectations moving forward just got a huge boost of objective data backing them up...

I'll probably have a member's video out this weekend or a more in depth post, there are a few assets that look like we can make some good money in a short period of time and our longer term trending positions look like they are setting up exactly as we had hoped.

Have a great weekend!


Market Update / EOD Hints

It doesn't matter too much what the market does price wise from this time (meaning 2:30-close after the op-ex max pain pin is no longer that important).

The reason why? Simply, if we have some very negative signals in to the close, the probabilities are higher that next week the market picks up where the actual signals left off, not where price left off, we have seen this numerous times whether it be day to day trade or over even a 3-day weekend.

In fact, if underlying trade is suggesting a move down via negative divergences, then a strong closing ramp draws in the weekend warriors who work 9-5 and place their limit orders "based on what price did", over the weekend or early Monday morning before they head off to work. THESE ARE THE SUCKERS THAT GET CAUGHT HOLDING THE BAG IN A BULL TRAP SCENARIO, it's for this reason that EOD price action on a Friday after the op-ex effect of "Max Pain" has diminished is of little concern to me, but EOD 3C signals are very important to me.

So lets take a look, I'll also be confirming in some other assets like leading indicators and several other types of futures/credit, etc.

Russell 2000 Futures
 1 min TF, there's a positive divegrence leading in to regular hours (9:30) with the typical head fake just before a reversal starts, I imagine higher prices were part of the max-pain pin, as those contracts (hypothetically) are closed out at a loss there are fewer contracts and the transition from Friday's specific Max pain operation transitions back to the larger cycle operation with clear leading negative divergences.

 However as I have maintained since the idea of VXX calls came up yesterday, I see them as a "Short DURATION" position, that's why they need the leverage. 

At the 15 min chart of R2K Futures, we have a positive divegrence sending futures higher and today's price action is in line, no negatives because this is a longer timeframe for more serious trends, a pullback doesn't effect this trend and isn't strong enough to even show up here.

As for the migration (strength and therefore probabilities the move takes place) of the intraday negative divegrence, here's the DIA as an example...

 1 min leading negative

migrates (meaning the 1 min negative was strong enough to move over to the next longest timeframe ) to the 2 min.

The 3 min is leading negative, ***Note how ALMOST all of the leading negative divergence on this timeframe is exclusive to today.

 The DIA 5 min chart DOES NOT see migration of the negative divegrence.  This means while the 1-3 min signal is strong, the 5 min signal is much stronger as the first timeframe that represents institutional activity, thus any pullback is likely to be short in duration (as explained yesterday when entering the initial position). Today confirms what was seen and expected yesterday on the entry of VXX calls.

The green arrows show 3C in line with the price trend or confirming the price trend.

Other Averages' divergences... I'm showing the longest charts w/ negatives, there are negatives on shorter charts, there's just no reason to show all of them.

 IWM negative out to the 5 min, almost all from this afternoon.

 QQQ 5 min also leading negative, there was earlier damage, but the majority was done this afternoon.


*I use the SPY as a different example...
SPY 3 min positive in to the lows, a negative today, there's a gap, that makes an attractive pullback target.


SPY 30 min shows something very different, this is a very strong timeframe, it has nothing to do with a 3 min chart.

Note distribution in to the F_O_M_C, you may recall my opinion that the F_O_M_C was leaked and the charts I showed of the $11 move in gold 3 minutes before the policy statement was read and gold heading much higher right after.

The 3 - 5 min chart represents a short duration correction/pullback, the 30 min chart represents the upside we've been expecting leading to highs that can easily be shorted as retail chases and creates demand that Wall St. needs to put on positions the size they do without sending price against them.

Longer charts like 60m, 2-4 hour and daily+ represent the primary downtrend we expect, this is why we want to use price strength above certain levels to short in to THE EXACT SAME WAY SMART MONEY DOES.


SPY 4 hour represents both the bounce to the upside or rally aas well as the overall negative divergence

 The SPY 4 hour represents the heavy distribution already in the past, the massive damage to the market . I drew in 3 candles, 1) a short term pullback, 2) a loss of momentum and reversal to the upside, 3 the upside move starting and 4 is the rough area I'd expect price to reach before entering shorts in size, this represents the area retail WILL chase prices (the confirmed breakout) and create demand, which is what Wall St. (as well as ourselves) needs to sell in to and be able to sell or short (they are the same thing on the tape). Wall St. needs it to keep price from going against them, it's largely a volume issue, for us it's not so much a volume issue as it is getting the best entry and the lowest risk.

THIS IS THE DIFFERENCE BETWEEN THE PROBABILITY OF SOMETHING HAPPENING AND A HIGH PROBABILITY TRADE WITH AN EXCELLENT ENTRY, LOW RISK AND GOOD TIMING.


THE INTRADAY 5 MIN 50 BAR THAT MANY INTRADAY TRADERS WATCH IS VERY CLOSE TO SEEING A BEARISH INTRADAY BREAK, MY TREND CHANNEL IS ALSO RIGHT THERE NEXT TO A STOP OUT FOR LONGS.

The larger 60 min 50-bar trend shows what I think are reasonable areas for a short duration pullback, they can move toward these levels and still not break the new trend.

My momentum screen set to intraday 3 min shows momentum (top) failing, RSI is neg. divergent, MACD (setting: 26/52/9) is negative and Stochastic (period:50) has also turned negative.

As for VXX, VIX short term futures...
 The 2 min chart I wanted to see make a new high earlier today has done so, it is leading positive and in good shape for the VXX position that is in place.

 You  can see our VXX Put from earlier in the week and the leading negative signal that caused us to put it on, leading to a +40% gain in 4 hours and now you can see a 3min leading positive divegrence that is even more extreme than the previous negative divergence.


The 5 min chart shows a lot more than you might realize. At "A" there's a breakout above a triangle, this is what traders chase, they call it "confirmation" which use to make sense, now it is just used against them. At "B" we have the breakout move they will chase, if you look at this as a 4 stage cycle (as the market is fractal, this would be stage 2 mark-up). At "C"  we have stage 3 distribution/top and this is where we are short with puts.

Remember, "From failed moves come fast reversals",  this is because Technical traders are taught that is a move like a breakout from a triangle fails (TA says it shouldn't", then you should reverse your position and go short. Some traders will do that, others will hold on and see if their stop which is placed right under the triangle, holds. At "D" price fails and the longs are stopped out as their stops on the books (totally visible-would you show your cards playing poker?)  and everyone knows exactly where they are anyway, just below support. At this point supply picks up as additionally shorts step in on confirmation of a failed technical price pattern, between stops and additional new shorts, there's plenty of volume for Wall St. to accumulate in size and on the cheap. At "E" we get the move ABOVE resistance that isn't suppose to happen according to TA, this squeezes shorts and encourages retail longs to but, this creates demand which sends prices higher, it causes more shorts to be squeezed creating more demand and Wall St and ourselves can sell in to price strength (Wall St. also has the demand/volume they need for their larger positions).

As I said last night and Wednesday when entering VXX calls, everything still looks to be exactly on track.

Market Update***

We have VERY clear negative divergences in the market averages as well as the Index futures, those are confirmed by positive divergences that are even stronger now in VIX futures and the derivative assets like VXX, UVXY, XIV, etc. 

The consistent news is that I don't see this as any significant change in expectations, NO the VXX call didn't take off yesterday as early as I would have hoped and as I made clear last night, "Don't expect much in the market today on op-ex until at least 2:30 as most contracts are wound down.

Often the actual price action after 2:#0 as the op-ex pin action fades, is erratic, but the underlying trade is very often very useful in determining where we pick up on Monday. Yes Monday is Columbus day, banks will be closed, but the market open so expect volatility on lower volume, it's really an ideal area for a pullback to take place.

In any case, I'll get charts out, but negative divergences intraday have set in. I'm expecting some downside in to the close, short of that, then Monday.

At this time I do NOT intend to open other positions because of the expectation of a short duration move and the wild card of government over the weekend, so far I just have a spec. size VXX call.

I'll only add additional positions if they are really standing out.

Charts coming...


XOM Follow Up -GREAT Position

In case you didn't like options, I suggested you maybe consider ERX as a leveraged way to play the counter trend moves in XOM, although I prefer XOM over ERX (not because of the amount of leverage, strictly because of the signals, but I can't think of an ETF that is as close to XOM as ERX-"3x Energy Bull").

The last follow up for XOM was this "XOM Follow Up / Add-To" post of Tuesday October 8th.

In that post I included this chart that shows where XOM was a core equity short, where that short was covered in anticipation of a counter trend bounce, where XOM calls were entered including the same day as the core short being closed and where the calls were closed and the P/L report for each, that's this chart, just add Tuesday as an additional new entry or add-to for the last call position that was opened (and remains open).

 This is a daily XOM chart, the red "S" is where the core short was covered for a +5% gain, it never really got a chance to get going, but I will be re-entering XOM as a core equity short on price strength, it's actually near the top of my core short list. 

The white "C" the same day was a call position opened, the following red "C" is part of that call position being closed (the linked original post describes the positions in more detail) and the gain, etc.

This is the 1 min intraday, that alone is enough to consider closing a call position, depending on the expiration and strike obviously, a November expiration vs next Friday are two very different scenarios.

There's some migration, the 2 min today is also negative which increases the probabilities of a pullback through price rather than a consolidation through time  (1 min only negative is 50/50 chance of either, add the 2 min negative and probabilities of a pullback go way up).

The 3 min chart  shows the reason why I featured XOM as an add to on the 9th, you can also see today's action, negative, but not horrible, more of an intraday/short term issue.

The 5 min is nearly perfectly in line, however the price action looks a little too parabolic for me, which means I'd expect the charts in the intraday space to continue to deteriorate until there's a pullback in XOM, this may be a great opportunity for anyone who would like to start a new "speculative"/"swing" long or add to an existing position.

The 10 min chart is clearly positive enough to take XOM quite a bit higher from here, of course nothing moves straight up and thus the reason I brought up the subject of what to do with calls earlier.

I don't really need to go further than the 15 min chart, which suggests a fairly strong move, I wouldn't be surprised (since 3C is at a new leading positive high) to see price make a new high for this chart before all is said and done. I have a very specific area I'm watching to add XOM back to the core short (equity short for a trend trade) portfolio.

Again, this 2 hour chart is an extremely strong chart/signal, we see the distribution at the top when XOM became a core equity short, at #1 in white where the XOM short was covered in anticipation of a counter trend rally and call positions opened and as we have made a lower low, we have a stronger leading positive divegrence, this helps me in determining how far I think XOM can go before running out of gas.

This is a multi-day chart, these are stronger signals than anything you have seen in this entire post, probably all day. The distribution in 2007 was very strong and this is what distribution use to look like before the F_E_D got involved in the market to the extent they did in late 2008 and ever since.

You can clearly see the market wide accumulation of Q1 2009 and through 2009 as F_E_D / F_O_M_C policy was more aggressive, adding treasuries to their MBS QE program that was started late 2008, adding T's was the trick.

The leading negative divegrence in place right now is stronger than anything we have seen in years because the market is built on a sand foundation of easy money that HAS to be unwound, that's what the taper process starts, the unwinding of accommodative policy which is always much trickier to exit than to enter and always has dire consequences for the market. Being we've never seen this amount of accommodative policy and a F_E_D balance sheet so bloated, I don't think anyone can imagine how bad this can actually be once they start raising rates.

In any case, the upside XOM target I'm looking for to start a new core short position is above the parallelogram defined by the red trendlines, IT IS NOT A BULLISH CONSOLIDATION!

I'm looking for a move somewhere > $96, $100 would be an obvious psychological level which also means this is about my expectation for our long positions moving forward.

Mor than anything, you just need to decide what trades you are comfortable with a there are quite a few available here in different timeframes at different areas/levels, but I would not miss the core short >$96-$100-ish.


XOM Calls Trade Management

We just recently opened some XOM calls that are currently just about at a double digit gain. I believe intraday they are going to see that gain erode, perhaps in to the red, I will cover XOM in greater detail, but this is time sensitive. Since the calls are November, I feel there's enough time for this position to do well and there are VERY strong charts supporting XOM on the upside.

I just think it's a question of how you want to manage the position tactically, I decided to just stick it out as I can't be sure I'm going to get that much of a better entry is I closed now. Furthermore, the charts in XOM are so positive, it's like the AAPL situation, sometimes we get too fancy for our own good in trying to cut around the fat.

Charts are coming.

Adding to VXX November Calls

It's not the price move just a second ago, in fact I'd rather that didn't happen yet and I still think there's a chance that VXX breaks the intraday lows before really taking off, it was the inverse of VXX, XIV that made up my mind.

The leading negative divergence here serves as confirmation.

Nothing has changed about the short term duration of the position in my view.

If I were on the fence and had time to watch the asset, I might make a VXX move below the intraday lows (somewhere around $14.25 or lower) the trigger that causes me to enter as it gives a better entry point and reduces risk as well. 

I'll set an alert for that price level and if it happens, I'll update the 3C charts for you so you can see whether there's stronger accumulation , which is what I'd expect, or not.

Remember, because this is a position that I view as likely to be very short term in duration, I think it should be treated as a speculative position. My position sizing will reflect "Speculative" position.

VXX Update

Which is essentially a market update as VXX moves opposite the market. VXX's intraday chart I have been watching is looking better.
Since I captured this chart a few minutes ago, 3C has moved above the former high.

I think there's a decent probability of a shakeout below $14.25.

Considering the VXX Call is a smaller than speculative position and I'm only looking to bring it up to a speculative size position, I'm a lot closer to doing that right now than I was 15 minutes ago.

I'm going to look at a few other charts and make a decision shortly. I still see this as a short duration position and thereby I personally prefer the leverage of options, but there's always UVXY which is a 2x leveraged equity asset if you don't like options, but like the idea of the position.

VIX / VXX

First, here's my custom indicator inspired by DeMark principles, it gives simple buy or sell (short /  cover) signals and they are fairly rare. This chart was featured Wednesday in the Daily Wrap as the Financial media were making it sound like the VIX was off on a tear and wasn't coming down for a long while.

 This is the exact chart from the Daily Wrap October 9th linked above. We had a buy signal in July that led to a move higher and a clear sell signal this week that led to a large move lower the next day, which we did well with as we had an open VXX Put from the day before which we closed the next day (Thursday) for a +40% gain for only 4 hours of market exposure.

 Here's what the same chart looks like as of today.

This is a 5 min chart of the VIX Futures, it's not intraday, but it's great for very short term signals like the VXX call opened yesterday.

You can clearly see the negative divegrence that was part of the reason the VXX put was opened and now we have a relative positive and a leading positive (the stronger of the two types of divergences) divergence which is growing stronger.

The VXX (Short term VXX futures) is also in an intraday (2 min), positive divegrence.

The 5 min VXX is in a relative positive divegrence, this is a longer and stronger timeframe so the divergence isn't as impressive here yet. If the shorter term 1, 2 and 3 min charts continue to improve, there will be positive migration to the 5 min chart and that's where our probabilities increase dramatically and ideally where I'd like to add to the VXX Call position.

 Part of accumulating or distributing for smart money is doing it in a way in whivh your very large orders don't send the market's price moving against your position. As I mentioned yesterday, I was listening to an interview of a Wall St. fund that was trying to fill their own order rather than use a market maker or specialist who are skilled in filling large orders. This firm (they didn't say which asset they were trying to enter) said they had moved price against them by $5 in the first day alone, I know that's a relative number since we don't know if it was a $52 JPM or a $1000+ PCLN, but they were not happy.

The point being, to accumulate in large size, they need to create supply and the easy way to do that is to hit stops.

Note the first major stop run was the gap down- FEAR produces movement. The second and most obvious came from the breakout from the triangle which saw some upside volume meaning longs bought the breakout, STOPS WERE PLACED RIGHT BELOW THE APEX OF THE TRIANGLE FOR LONGS WHO CHASED AND BOUGHT THE BREAKOUT MOVE. Some more volume was created as support at $14.31 was broken.


The 2 min chart of VXX is already leading positive, but I'd like to see a new leading positive high, see where I drew it in on 3C (orange).

I'll be watching for this and the tone of trade as well as the market in general as the VIX trades opposite the market.

VXX Position Follow Up

As you know, based on my feeling the market will pullback, I opened a new VXX November $15 call position yesterday, but at VERY speculative size. That means the position has room to add to and still keep it at "speculative" size.

I see several charts coming together as expected and this was part of last night's (I don't even want to say how many charts) analysis. There were at least a half dozen charts dealing with the VIX alone, from our Wednesday sell signal which is a rare signal for that indicator that played out perfectly yesterday to the very short term position entered yesterday.

I'm going to collect some charts and post them, but I figured I'd give you a head's up so you can apply your own tools and analysis to the subject while I prepare the post and possible "add-to"  position which is even more attractive as a new position for those who did not enter yesterday.

Financials Follow Up XLF / FAS

Since my expectations are for a CONSTRUCTIVE PULLBACK (which may be a little skewed in its appearance today because of the normal Friday op-ex action; even the weeklies are consistently producing op-ex "pins". Last night I reminded that the market often opens on Friday and loiters for a majority of the day, around the area of Thursday's close, at least until about 2:30 when most on the contracts are wrapped up) it makes sense not to sit through leveraged draw down when the probabilities are still very high that these same positions can be re-opened at lower prices as the pullback wraps ups. 

I decided to go ahead and stick with some of the November expiration Financial calls, but as I always post before I make any changes, FAS I decided to wrap up for now mainly because it's a lot of resources to be just sitting there. Those resources may be better utilized or at least removed from the simple risk of "market exposure" which is higher than normal now because of the uncertainty surrounding the government debacle.

In any case, here's the minimal P/L for the FAS long trading position and what I see as the probabilities right now.


At a cost basis of $68.93 (with roughly $10.5k of open risk) and a fill of $70.56, the P/L for FAS came out to an insignificant gain of +2.3%.

Charts...
 This is the near term 3 min chart, mostly intraday action showing the accumulation/positive divegrence where FAS was a buy and showing today's negative divegrence & the reason for closing the position for the short term.

As far as Financials being a short, like FAZ long or XLF puts, remember the difference between probabilities and a high probability, low risk position. Probabilities are for a pullback in Financials, I DO NOT  think that this means Financials are a high probability short position, I think patience and seeing what the underlying trade looks like during a pullback to set up the next position are the wisest course of action for the moment.


The much stronger, much higher probabilities represented by the 30 min FAS chart show a very strong relative positive divegrence followed by a more powerful Leading Positive divergence. There are no signs of any distribution here so I believe the wisest course of action at the moment is to trade Financials (FAS) from the long side, using price weakness to enter new positions or add to existing one.

Closing FAS long & Short Term Financial Longs

If you have short term, leveraged Financial longs such as XLF calls or FAS trading positions, I would consider easing up on them or even closing them, you should be able to re-enter them shortly at a better price.

I will be closing the FAS trading position opened (long) right after I post this.

Daily Wrap Part 2

This is what I had planned, so I hope you can see why I waited and I think we all appreciate the last two charts above this (all screen captures that I post are saved to my desktop, these were just the captures for last night's Daily Wrap (I blurred out any files that were unrelated).

Yes, each one of those little black spots is a chart, each of the white spots is a P/V relationship, a CONTEXT model or SPY Arbitrage. The one area circled in red is a cluster of about 20 files, these were all for the Daily Wrap, can you imagine?

I do think there is huge value in going back and reading Wednesday's Daily Wrap , see what we were expecting for yesterday:

-Check out the candlesticks I drew in Wednesday night as probabilities for yesterday's closing candlestick.
-Check out the rare, daily VIX sell signal on my Custom DeMark-inspired "Buy/Sell" indicator. -Look at what the 3C charts in Index Futures, Market Averages, Industry Groups & Bellwether Stocks had to say.

It's not that long of a post, but compare it to Thursday's close, there were some incredible forecasts there that we made some good money with yesterday.

Now, to deal with today's.

In any case, there are some important charts that I will share with you, I promise it won't be anything like this.

As for opening action, it's quite normal after yesterday's performance to see follow through orders, people chasing as they missed yesterday's move.

OK, lets move forward, I just want to remind you that sometimes we learn more about the market and our trading by looking back once in a while.