Tuesday, January 6, 2015

Daily Wrap

I think we have the broad strokes pretty well covered, however there are some interesting factoids and some charts I promised.

If you go back to our December 12th forecast, thus far everything has happened. As that forecast was fleshed out over the next several days, one of the events we anticipated was the taken for granted Santa Rally to lure in longs initially with good market performance in to the typical period for the Santa Rally and then for it to fail miserably setting a bull trap which it did, but there was a second part to that specific forecast which was the January effect which is also taken for granted by traders as if it was a birth right and that the failed Santa Rally would roll over in to the January effect. If you are thinking like a criminal, what better way to make the most number of people wrong at once with two seasonal events that are assumed to be a given.

TODAY MARKS THE 3RD DAY OF TRADE IN JANUARY AND THE WORST 3-DAY START TO THE MONTH EVER!  In addition, we have the worst 5-day performance in the SPX since Sept. 2013 with the Index finding support today at the 100-day moving average (recall the charts posted yesterday with moving averages and support areas) which also coincides with the psychological $2000 level on the SPX.

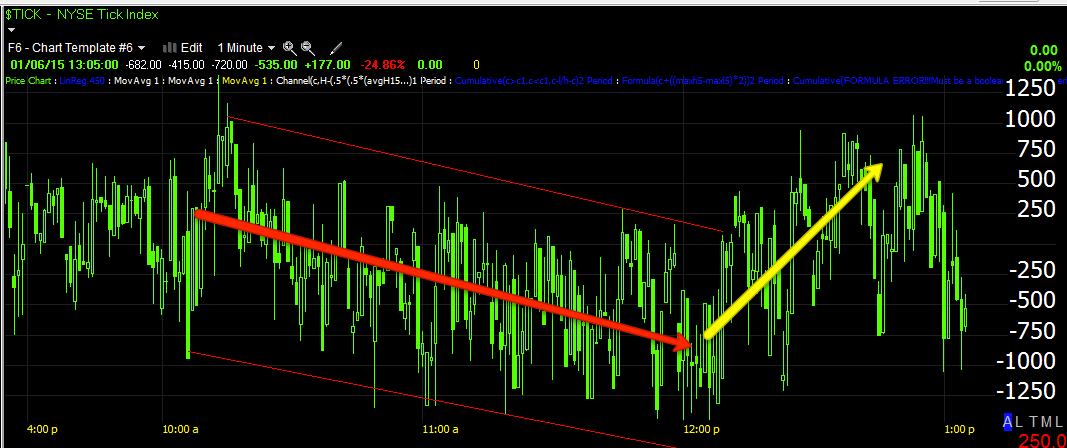
I think I have been clear about what I expect from a market bounce, an oversold bounce, not something that is supported and to that end, today put in the second Hindenburg Omen in a row. The last two clusters sent the market lower so this also fits with our near term and longer term analysis.

As for Leading Indicators, none of them are really screaming near term. The VIX short term futures (VXX) and spot VIX once again underperformed on a relative basis vs the SPX. TLT also underperformed on a relative basis, but I suspect we are seeing a very parabolic looking move in bonds and as such in yields as they sold off hard in to the noon time hour, taking the market along with them as they usually do. This could be a short term capitulation or exhaustion event which allow yields to give the market a little room for a near term bounce.

Take a look at the Treasury bond futures in 5, 10 and 30 years...
 This is the 5 year Treasury bond futures on a 5 min chart, in fact all are 5 min charts and all are negatively divergent with 3C.

10 year T-Bond Futures.

30 year.

Interestingly, the SPX caught down to the near term 5 year yields today, but not to the 30 year yields which are well below the lows of the 16th and have retraced all F_O_M_C gains, this I believe points to what comes after the bounce attempt we are expecting, the averages continue to feel the pull of the 30 year yields lower.

Remembering this is a 5 min chart and this is the minimum divergence that must be in effect for me to take even a short term trade, the negative divergences above confirm nearly perfectly the Index futures 5 min positive divergences.
 NQ/NASDAQ 100 futures 5 min positive like ES and TF (SPX and RUT futures). These are also confirmed by the 5 min VIX Futures (not VXX, but actual futures)...

VIX 5 min negative divergence.

However, this is part of the reason I'm expecting a short lived move on any bounce. At the 7 min Index futures charts they look like this...
 ES 7 min (SPX futures) are in line or confirming the downside, not positive and any move up in ES from here will create a leading negative 3D divergence.

Confirming this short term roof on a bounce, take a look at the same 7 min chart in VIX futures...
It too is in near perfect confirmation, thus any move down in VIX futures should leave a leading positive divergence in 3C, again confirming the shorter term nature of our expected bounce and what happens next.

These are confirmed in the major market averages as well.

The most often used ramping lever for the market is HYG, HY Corp. Credit and as such, we have positive divergences in the 1-3 min charts, short term...
 HYG short term 2 min positive to ramp the market and a bounce, but it doesn't move much beyond.

The 5 min HYG/3C chart is in line/ downtrend confirmation, thus another roof on our bounce.


as for other credit (HY) assets I've looked at, I've noticed most were positive on December 31st and January 2nd, after that at the 5th and 6th they gave up the positive divergence and fell back to in line. In fact our Professional sentiment indicators did the exact same thing.

 Only PIMCO's HY Fund is leading.
PHK vs SPX indicative of a near term bounce, but the lack of HY credit confirmation again puts a roof on a bounce.

HY Junk credit is perfectly in line with the SPX's downside with no divergence at all.

As for the rest of the Index futures, they are clearly showing where the probabilities lay...

*Remember the 5 min charts are positive, at the 7 min charts we move to confirmation, essentially losing any supportive indications which may be considered the line in the sand and after the 7 min charts...
 TF 15 min leading negative

ES 30 min negative

NQ 60 negative

TF 4 hour showing how bad I really expect the downside to be once our bounce is finished.

As for the averages... If you didn't get in when we were putting out Trade ideas like the December 23rd's I like QQQ Short Here or December 30th's Trade Idea: (Trend) Transports (IYT) Short (and many others), I have encouraged a lot of you to NOT CHASE the trade, but be patient and let it come to you, such as the December 30th, QQQ Update & Trade Set-up or today's trade set-up, Trade Idea: (Longer Term) Financials Short / FAZ Long. Al of these are showing the same thing as Index futures, Treasuries/Yields/Leading Indicators, 3C charts, etc just like the averages below...

 SPY 1 min showing accumulation in to today's intraday lows which is interesting because our custom VIX Term Structure Indicator that has had a remarkable track record flashed this today...

 After the red SPX:RUT custom Ratio Indicator started showing a positive base forming and then gave out just like several Leading Indicators mentioned above, the VIX Term Structure below flashed a buy signal at the intraday lows. There have only been a handful of these signals and each one has been accurate, although the size of the signal is proportionate with the expected move it is flagging, for instance on a longer term basis...

Note the small signal to the far left and the proceeding small bounce following it and then the larger signal at the August lows where we forecast an oversold bounce and its size and of course the largest, "Face Ripping" rally at the October lows we forecast over a week in advance and the size of that signal. Today's to the far right was intraday and fits with the short term intraday charts like the 1 min above or...

The QQQ 5 min which has a much larger negative divergence as the main theme and a smaller positive divergence now as a kind of corrective theme.

 However there's no larger divergences like at the October lows, this 10 min IWM shows numerous small divergences along the 6 week range, they are dwarfed by the leading negative divergence we forecast on a break above the range, which is still very much in effect, thus the shorter term charts represent smaller, near term moves and these intermediate or longer term charts represent the highest probabilities and what comes after the short term chart divergences a usual in Multiple timeframe analysis with multiple asset confirmation.

And the QQQ60 min chart which has deteriorated badly, but just a expected.

Thus far, EXCELLENT confirmation, the F_O_M_C minutes are really the only wild card and why I've chosen to approach trade set ups the way I have, it's a no lose proposition or as close as you get to it in the market.

Finally, our breadth indications...

The Dominant Price/Volume Relationship among the component stocks of the major averages was almost identical, all saw Close Down/Volume Up like yesterday which is a short term oversold indication, almost always resulting in a next day close higher. The only average that didn't have a dominant theme was the Dow. Of the averages in the theme, 67 of the NDX 100, 1011 of the RUT and 273 of the SPX 500.

Additionally only 9 of the Dow stocks are > than their 50-day, only 41 of the NDX 100 are > 50-day and 174 (less than half) of the SPX-500 > than their 50-day. Of the Russell 2000, less than half (027) are > 50-day and 1011 are > 200-day so very poor breadth. If you look at this as a market of stocks, we are in a bear market, it's only the magic of Index weighting that makes things look better than they are.

Of the 9 S&P sectors, only 1 closed green, the Defensive Utilities sector (watch it be the laggard tomorrow) at +0.06% and the laggard today was Financials at -1.53%, interestingly featured today, watch them lead tomorrow!

Morningstar Industry groups were worse today than yesterday with only32 of 238 closing green.

The Percentage of NYSE Stocks > Their 200-day Moving Average is less than 44% at 43.96%

The Percentage of NYSE Stocks > Their 40-day Moving Average is worse at 33.96%.That will do it for tonight, you know what we are looking for and what looks to be the best use of a bounce, I'll put out the best looking assets for trades as we see how much we get, the Minutes at 2 p.m. tomorrow could be a wild card, but just as with the F_O_M_C, I suspect the market price action will initially determine the sentiment of the market despite what they say, people get the minutes like the F_O_MC and see the market react well and assume all is well, it clearly was not at the F_O_M_C and as I showed earlier today, we already retraced almost all of the F_O_M_C gains since their release at 2 p.m. on 12/17, we retraced ALL of the 17th's closing print.

If anything should change in futures tonight, I'll update you.


Closing Update

I'll include some charts right after this, but whatever happened this morning, whether Bill Gross's comments, "Bad news is good news is bad news" on the macro economic data front this morning or pricing in new ECB/QE information that is less than the exciting QE the market has already gone ahead and priced in according to GS and JPM, months ago which means short of doing something bigger than what the market has priced in, the risks are to the downside on disappointment, personally I think that's what we saw today on the ECB's option #3.

Our bounce looks alive and well which brings me to another possibility, although I'm doubtful of it, a leak of tomorrow's 2 p.m. F_O_M_C minutes from the last meeting. Don't scoff, it wasn't too long ago the F_E_D was caught red handed sending the minutes out about a day and a half early to some 154 large funds/Private Equity via email. There are so many things wrong with this event that you can't say it was an accident. First the market is suppose to receive the same information at the same time, anything other than that is usually frowned upon as insider trading. So why would the F_E_D send out emails to tell people what the minutes said when clearly the fastest way for everyone to receive them at the same time is a mass release on their website? I'd like to know how to get on that mailing list. And of the 154 firms that received the minutes early, not a single one sent a message saying, "Uh... excuse me, but I think you made a mistake, these aren't due out until Wednesday", not one.

So while I tend to doubt that is what was behind this morning's move, it's not like the scenario of a leak is without precedent.

On that note, as always, BEWARE THE F_E_D KNEE JERK REACTION, it's almost always wrong as we have seen today as nearly all of the averages have retraced all of the gains since the December 17th (2 p.m.) knee jerk reaction. ON A DEC. 17TH CLOSING BASIS, THE MAJOR AVERAGES HAVE RETRACED ALL OF THE F_O_M_C GAINS AND THEN SOME.

The point is as always, the knee jerk move, which the market seems to be primed to set up as "UP" based on the recent positive divergences, is almost always retraced within 2-3 days. The last one took a bit longer, but consider our scenario before the F_O_M_C which included the Santa Claus Rally initially looking strong to pull in longs and then slamming the door which happened yesterday with the worst Santa Rally since 1999, EXACTLY WHAT WE FORECAST which was based on mass psychology or thinking like a criminal which are concepts that have all come from objective evidence of charts over the years.

I personally would rather short in to price strength and keep my trades on the same side as probabilities, but I know some of you are short term traders and if not already long are going long for the bounce we expect. I'll be looking for the pivot, the moment in which it looks to fail and that's where I'd want to open positions like FAZ (3x short Financials) or add to them if I had the room or 3x leveraged market shorts like SQQQ, SRTY, SPXU, maybe NASDAQ Biotechs short (BIS), there should be more opportunities than you can shake a stick at so that's my approach, but I'll keep you day traders up to date as best I can.

I see no reason at this point with the charts from late last week and early this week along with what happened in to today's lows, that we shouldn't expect a market bounce.

If, there's some leak in the minutes as we have caught about 3 F_O_M_C leaks over the years, which isn't a lot, but they were very obvious; I'll let you know as in that scenario, things may change a lot faster than you expect.

Generally speaking though, just like the last F_O_M_C, price is setting the tone and interpretation of the data initially, the knee jerk, so if we already have positives lined up, unless there's something about a rate hike at the next meeting, I'd expect price to set the tone so long as the minutes don't have any big surprises. From there, it's just about looking for the near term positives to turn negative and to enter our positions.

As I said, I'll include charts, but don't forget, tomorrow at 2 p.m. and I'll be watching closely in to the event for any leaks.

Trade Idea: (Longer Term) Financials Short / FAZ Long

Since right now just about all I can do is manage positions which requires very little, keep up on the market which is a bit more time, but still leaves me with some time, I figured I'd post some "Let them come to you" trades.

Financials (short) are one of my favorite areas to have some exposure, but I want to enter a new position or add to an existing one which has room (according to risk management rules) on a bit of short term Financials price strength, already knowing that the probabilities are for financials to fall significantly further.

So we'll start with XLF and my preferred position which is the 3x short Financial ETF, FAZ, not to be confused with the 3x long financials, FAS.

First we want to establish the highest probability resolution of price action, not short term, but the underlying trend of money flow either in or out of Financials. As usual we'll be using multiple timeframe analysis and multiple asset confirmation. With all of the timeframes and 3 different assets, if I posted charts of every one, we'd have nearly 30 charts so I mixed up the representation so you can still see confirmation without a bunch of charts you'll never look at.

The strongest timeframe down to the nearest term, weakest timeframe, but most probable near term move.

 6 hour XLF (Financials with the last significant positive divegrence at the October lows, the current divergence is leading deeply below that level while price is significantly above the same level making this an even bigger divergence than it appears on the chart. The underlying flow has been distribution and heavy, but in to higher prices and demand as smart money's positions are large and need higher prices and demand to move them without crashing price around them. Selling can include short selling, it comes across the tape as a sale just the same.

 XLF 2 hour which is usually what we use for the very long term view shows the same patterns of Oct. low accumulation and strong distribution in to the move higher. These are the highest probabilities, to the downside as this is not being supported and certainly not accumulated, but distributed.

XLF 60 min shows the same with a bit more detail.

Here I switch to FAZ, the leveraged ETFs tend to give faster, more accurate signals in the faster timeframes, I suspect it is because of their leverage that these positions have to be moved in or out of first. FAZ is the 3x short Financials and its 30 min chart went from negative to in line confirming the downtrend in price to a huge leading positive divegrence. Thus again, the highest probability is Financials down/FAZ up.

The 10 min chart of XLF tends to confirm the same with a more detailed chart, 3C is at a new leading negative low.

However short term we have been looking for a bounce. The 3x leveraged long Financials FAS shows that positive divergence currently. To the left is the positive we forecast on December 12th which gave evidence on the December 15th/16th lows with accumulation, a move higher above the IWM range area and distribution in to the move. On the downside, this is the recent positive divergence suggesting a bounce that will allow us to short Financials in to temporary price strength, with underlying weakness, thus a better entry, lower risk and good timing.

 FAZ 3 min shows recent accumulation and the move up corresponding with the move lower in the market during the Santa Rally, but also a near term negative divergence on a short term time frame (3 mins) to the far right.

FAS/3x long Financials confirms at the more detailed 2 min chart with a larger positive divegrence in to today's intraday lows which we called out as gaining a foot hold earlier in the day for an upside move.

FAZ's 1 min chart confirms as the earlier move in the market down (up in FAZ) sees 1 min distribution.

Everything here suggests that XLF and FAS see a near term upside bounce as we have expected and FAZ a pullback, thus giving us an excellent opportunity to either short XLF in to price strength and intermediate and long term negative divergences or to buy the 3x leveraged Financial short, FAZ on a near term pullback as probabilities clearly favor FAZ making a much stronger move to the upside than it has just started to. In my view, we haven't even taken the plastic protective cover off this market on the downside yet, there's plenty of opportunity, so this looks like an excellent position, we just need to pay attention to the short term charts after a bounce begins and look for the right entry.


Market Update

It looks like the earlier post or the last post about the market gaining a foothold is becoming more and more true.

However I'll be the first to admit fault with this, chasing small moves like this that are against probabilities to keep the positive gains coming in. In cases like this, I strongly believe you let the trade come to you, you stick with the probabilities and not try to catch a quick move in the market that is against probabilities like a long. I learned a very painful lesson in AAPL after having made the case for months when AAPL was the stock that could do no wrong. I was positioned short and decided to try to trade around a small divergence, against the probabilities and a sudden piece of fundamental data that had not been discounted sent AAPL sliding lower, ultimately almost cut in half in 8 months and I missed almost all of it because of tinkering too much so it's something I struggle with and often have to relearn the lesson. On the other hand, sitting still, letting your shorts work and taking advantage of a bounce to trade with the probabilities and short in to it makes much more sense.

Right now my personal portfolio on the whole is up +3.72% today, thus if a bounce materializes as I still suspect it will, I can use it to my advantage, but if it doesn't, I have no risk, just gains.

In any case, additional information is showing up suggesting the market is getting a foothold as well as suggesting that this morning's move lower was indeed a piece of fundamental data that had not been discounted because the market didn't know about it, I have charts that suggest that is the case which I'll show you.

According to GS and JPM, ECB full on monetization/QE has been discounted in to the market months ago, meaning anything less than full QE will have a negative effect on the market because they've already priced it in. Of the 3 plans the ECB floated today in an apparent trial balloon, I suspect plan #3, which creates a scenario in which the ECB does not violate its charter, one in which the Germans are less likely to block and one the market will not like, was the fundamental reason as the market "discounted"new news on the ECB QE front. Plan 3 puts the burden of monetizing debt/QE on the individual EU nations' central banks rather than the ECB, which raises a whole host of issues as sovereign nations, like what if France, Germany and Spain refuse to participate? Where's the QE, where's the juice the market is addicted to? I see this as the most likely as it won't be challenged in court, it doesn't violate the charter and perhaps in some way it moves Draghi closer to his grand design of forcing sovereign nations to give up more of their freedoms to form a Capital Market which Draghi described as,

"This means governing together, going from co-ordination to a common decisional process, from rules to institutions."

This is obviously more than likely the brainchild of the vampire squid, GS as they effectively run their own , larger nation from behind the scenes. Ever notice how many European leaders are or have recently been ex-Golman employees? Like Draghi himself?

In any case, I suspect that would be enough to send the markets lower as EU sovereign bond spreads widened on the unwelcome news. 

Or perhaps it's the fact that the month everyone anticipates the ECB to launch QE, they are still putting out different options as trial balloons, making it obvious they are no where near a decision that can be implemented in January as the market has already discounted.

In any case, intraday, take a look at the reaction in VXX, XIV and VIX futures.
 VXX 2 min intraday going negative in to the move this morning and early afternoon, suggesting the market is indeed going to try its hand at the bounce we have seen indications of as weak as they have been.

XIV, the inverse of VXX (short term VIX futures) is confirming with its own positive divegrence intraday as well.

And the VIX futures themselves show absolutely no hint of any divegrence before the market decline (VIX ramp), thus I suspect this was fundamental information that had not been discounted and the market move was part of the discounting of this new information.

The QQQ 2 min has a decent intraday positive divegrence which is leading, still short term.

The IWM has the same. A reversal to the upside from here would leave a "V" bottom, while not impossible, it's unlikely, a reversal is most often a process, not an event so I suspect a move back toward the intraday lows and a "W" base as drawn with the yellow arrows.

And the 3 min SPY which was in line with the move lower last week still has it's larger positive divergence, although still small and still only a 3 min chart.

 Today's NYSE TICK trend showed us real damage being done with -1500 hits on TICK, but as you can see, the downtrend has been violated, early warning of a likely upside reversal, although I still think another move toward intraday lows to widen out that "V" base is likely.

HYG, one of the most common levers was also brought in with a 1 min positive divegrence this morning at the lows so I suspect it is here to save the bounce.

As for the major averages, almost all of them have taken out all post F_O_M_C gains, those that haven't are about as close as you get to doing so.


Market Trying to gain a toe hold here

Despite some intraday charts in line like SPY 1 min, there are still positive divergences on 3/5 min charts in the averages.

The VXX looks like it is about to take a turn to the downside soon...
 VXX 1 min going negative intraday as well as longer term charts.

The USD/JPY going positive intraday, looking as if it will make a move higher soon.

And of course the TICK Index...
 NYSE TICK intraday is breaking to the upside out of this morning's downward trending channel.

 The 1 min IWM is putting in a relative positive divergence.


 As are the Q's, although this is still very weak.

The longer intraday charts still have positive divergences although quite a bit of damage was done this morning.

Whether the market keeps making lower lows or bounces to a +1.5% gain today, the change in volatility is a clear message of the market that this market is in trouble.

This is what we were looking for

It's hard to imagine the market recovering from this, it can be done, but hard to imagine.

When our December 14th forecast was looking for a move above the IWM's 6 week range, it wasn't a bullish event that was occurring although it looked that way as it happened, it was a bull trap being set that would give the market the same downside momentum as the break below the range on December 15th and 16th did for the upside momentum on the 17th and after, except for one thing and that's that markets fall faster than they rise.

While I'm not making any changes to the current analysis and we're in good position either way, I do want to demonstrate that this is what we were looking for to happen, once the bull trap was set, all that needed to happen was for their stops placed on the breakout above the range (IWM on 12/18) to be hit, then downside momentum picks up at a rapid clip. This was a head fake move that we anticipate just before a transition from the October cycle's stage 3 top to stage 4 decline.
IWM daily will pick up more downside momentum below the range.

And the major averages including transports have now almost erased all F_O_M_C knee-jerk gains. Everything has worked near flawlessly so far from the head fake, Crazy Ivan, the Santa Claus rally FAIL and now it appears the January Effect FAIL.

Macro Data or ECB Leak, the MArket Doesn't like One

I'm not sure if the initial move higher ay 10 a.m. on the disappointing ISM, PMI and Factory orders (bad news is good news) suddenly turned south or this maybe has something to do with the leaked 3 ECB bond buying options, the 3rd of which seems the only plausible one, in which National Central Banks would buy their own country's sovereign bonds rather than the ECB, this was one of the 3 options and the only one that doesn't violate the ECB charter. Whatever may or may not come about, the leaked "3 options" didn't receive a favorable response judging by the spreads in the EU sovereign bond spreads.

Either way, the market didn't like something this morning...

SPY 1 min this morning breaking red.

However the point of this post wasn't on this subject, this just happened to materialize during writing it.

The point was the levers that are used to move the market and why I believe this is a short term bounce, a corrective oversold bounce.

Beyond the levers themselves, you already saw the 5 min futures charts for Index futures (positive) and some other charts for the averages in the same area...
Other than the 5 min positive in the SPY, note price actions pattern, it looks like an upside down Igloo/Chimney reversal point.

 QQQ 3min positive, but judge the divegrence size compared to the negative that preceded it. Using the concept of "Price will move at least to the area the divergence was first seen", would mean we could expect a move in QQQ to at least $102.75.

The same is almost exactly true of the IWM and it's minimum bounce target would be $118.20.

Again though, my point was to show you the things that make this a weak bounce or rather a bounce that is not well supported, one that I would feel very confident in shorting in to.

 This is the 3 min HYG positive I mentioned yesterday, still not very big, but there's generally only 1 reason they accumulate it at all and that's as a ramping lever for the ,market.

Here it is on a 10 min chart for perspective so you can see it really is not that big.

And compared to the positive divegrence at our 12/12 forecast and the December 15/16th lows, it's not even on the same scale.

 VXX 10 min shows the recent negative, also a ramping lever, but again compare to the larger positive at a basing/rounding area for VXX, this should reassert itself soon.

And TLT which has been in line shows the first crack on intraday charts today.

However at 2 min there's no negative divegrence .

So even the ramping levers have very small divergences suggesting a very brief move, I didn't say a weak move or at least didn't mean that.

 The SPX: RUT ratio indicator was also giving an early head's up on a positive divergence which seems to have moved the market to a small base, it has given out, I assume after having done its job or at least reflected it.

 Of the HY credit assets I have been following, this one gave initial support, but hasn't done much since. Junk HY Credit isn't helping out much.

However PIMCO's HY Fund is showing a small base here.

I believe the bounce is still on, but either way, bounce or not, we are in good position to either let short positions continue working or taking advantage of a bounce and then return to let short positions work.

The 5 year yield is not helping the market and is dislocated to the downside, any SPX bounce from here just makes that dislocation worse, thus I believe this is another bit of evidence of the short term nature of any such move with what we can see right now.

The 30 year yield is also in a position in which it is putting substantial downside pressure on the market so I don't think any bounce gets too far with these tractor beams pulling at the market in the opposite direction.

However first, the market needs to recover from the morning downside. Keep an eye on the intraday NYSE TICK, if you see it break it's channel to the upside, you'll have an early head's up on a reversal intraday.