Thursday, February 21, 2013

A Quick Look

I'm just getting in, but I took a look at the market and the places we are involved and I have to say, I feel pretty good about our current positions both long term and short term; in fact today's QQQ and IWM calls are in the green and look set for a decent move, GLD calls are also looking good in the near future/

Here's a snap shot of futures now for our purposes and the closing 3C charts in the asset we are in right now. First futures...
 The 5 min SPX Futures have a great leading positive divergence, this should send our weekly calls up higher in the very near term.

 NASDAQ futures also have a great looking 5 min positive divergence, these have typically lasted about a day or two for some pretty decent moves in the weeklies.

 The QQQ intraday chart did nothing but improve, this is still very short term, but that's all we need for the weekly calls.

 Our longer term short positions we have been building should do fine as well, this long term, very important 60 min chart shows a horrendous leading negative divergence, like i said first thing today, the snake's back is broken, there may be some writhing about and we can trade that, but the back of the trend is broken, this divergence is evidence of that.

 IWM intraday continued to improve as well to a fantastic leading positive divergence so we should do very well in those weekly calls entered today, I'm glad we added near the lows of the day.

 Again the long term chart, 30 min IWM has a serious leading divergence and that bodes well for our longer term core short positions.

As for the GLD calls, this 5 min leading positive divergence is huge, this should be another winner.

Even the dominant price /volume relationship was perfect, Close Down/ Volume up, indicative of a short term wash out low, we should see some near term upside as the charts above show. We'll take advantage of the short term signals as long as we can, but the most important thing is to match the tool to the job, this way we can take what the market is offering rather than try to impose our expectations on the market.

So far so GREAT, I look forward to tomorrow and the weeks and months ahead, it looks like all the planning and patience is really paying off.

Talk to you very soon


Appologies

I'm going to have to say that again in about 2 hours, I'm running late to pick up my wife, but I saw some opportunities and I thought you should get the benefit of those, especially for being so understanding of me peeling off early.


I'll probably try to get a quick update out later tonight, I'm guessing after my wife goes to sleep, it depends on what needs to be said, if it's important I won't leave you hanging.

As for emails, I'll get to them.

I'm glad I stayed long enough to see these moves start.

I think we'll do good with what the trades are, remember the pendulum effect, it's strongest in times like this, but don't let your emotions follow it, it's time for evidence, logic, patience. Yesterday was the most important day of the year, moving forward, mark my words right now.

TTYS!

Adding 50% to GLD Calls, probably at $150 strike

Still March, this will bring the position to half way between a spec and full size.

GLD LOOKS INTERESTING HERE TOO

 GLD 2 min has recently turned leading positive, it seems like this has been a consolidation through time rather than price, as for the gap below, I never said I expect this to be a trend, maybe it gets filled on a subsequent pullback?

The 5 min chart on an intraday basis has also gone positive in the same area.

As for gold futures, the 1 min chart isn't telling me much, but it can move before I finish this post, the other charts are telling me something.

 5 min YG (gold) futures is leading positive


15 min is also very impressive. Now, the reason for the longer Calls in to March is because I think this "Could" be more than the typical 1-day trade...


I'm not saying it is going to be a trend, but this hourly chart's divergences are stunning.

Market Update

***This post was started just before the last post re: adding to spec. IWM/QQQ Weekly Calls (expiration next Friday)

Still Chugging long and I'm even considering adding to the call positions, if I were going to be able to watch through the close I probably would, I still might.
 ES, while not my favorite (SPY) is leading 1 min

 ES 5 min has a large relative positive and a leading positive, this is about the size of divergence we have been taking these weekly option trades on.

 NQ 1 min leading positive-this one is the one I like ,  the Q's and IWM

5 min large relative positive and leading positive.


 DIA support and a FLAT range, perfect for accumulation, the yellow arrow is the break, stops and short orders triggered as volume rises, this is the igniter for a reversal as stops allow accumulation at lower prices and wit some supply and locking in shorts creates automatic demand as they have to cover when price reverses adding to upside momentum.

 DiA 5 min(this is significant for a small move) leading positive divergence.

 IWM 5 min leading positive, 5 min is the first timeframe outside of intraday trade and in to institutional.

 IWM is flat in a range today and breaks support, volume kicks up.

 QQQ 10 min leading positive, most of it around the move below support, this is a good signal for the size trade we are looking at.

 QQQ 3 mi is sharper as a shorter time frame, leading positive clearly.

 Q's break of support, the head fake move or failed move, "Failed moves turn in to fast move".

 SPY 5 min leading positive, again not my favorite, but good enough.

SPY support and the head fake hitting stops, committing shorts.


NYSE TICK has not hit extremes, but why would it considering price action, what is important is the highs at lower moves.

THE 5 MIN 50-BAR MOVING AVERAGE WILL BE KEY HERE, ONCE PRICES MOVE ABOE IT, MOMENTUM SHIFTS.

Adding 50% more to QQQ/IWM Call Position

I'll get the charts up next, but what do we look for in a move or reversal? 1) Accumulation 2) either a trend down in price with that accumulation or a flat trend and 3) tight before a reversal we look for a head fake move that takes out stops, commits shorts, all of that has happened.


Leading Indicators

Considering the time I have left (I need to leave around 3 pm to pick up my wife or "Vife" in Hungarian), I'm not going to post too many charts, but I do like what I see in Leading Indicators, HIO is one of my newer ones, "High Income Opportunity Fund"and it's looking good. Currencies as shown this morning are in favorable position for our longer term positioning.

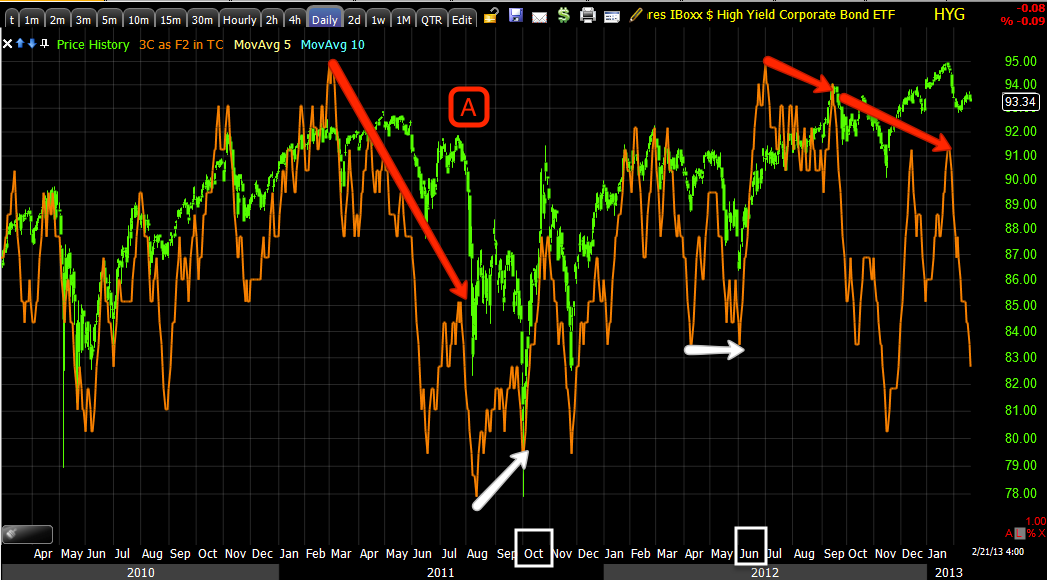
As for HYG (High Yield corporate Credit), I'm convinced the very recent uptick there (still in a major dislocation with the SPX) is one of two things, a short squeeze and a very liquid form of High Yield Credit that is exceptionally cheap.

It's really the divergence between Credit and the SPX that is the signal, but we can use 3C to see when credit is going to turn before we even get the price signal we use.

High Yield Credit is what we use for Leading Indicators, although yo could use IG if you could find a liquid enough form. A move to IG would be like a flight to safety trade and be bearish for the market if the SPX is rising and Investment Grade Credit is rising, this is why they are called "Leading Indicators", we don't want to chase anything, we want to get in at the top where the risk is lowest and the price is the best (for shorts-bottom for longs) and picking tops and bottoms use to be  fool's game and still is for many, but we have some tools that give us an edge.

As for HY Corp.

 At "A" that's the summer 2011 market crash of about 20%, you may recall we nearly doubled the model portfolio over the next 2 months trading 2-3 day moves with leveraged ETFs, then we predicted a new low and a strong rally after, the new low was October and HYG led the market there too as the SPX hit it on October 4th. Then the 2012 May 1st decline in which all 9 of our core shorts built over the preceding 2 months all went to double digit gains as we correctly predicted a head fake low and a move to the upside on June 4th. The current HYG negative divergence is worse than the 2011 summer divergence, price is higher, that makes the divergence worse.

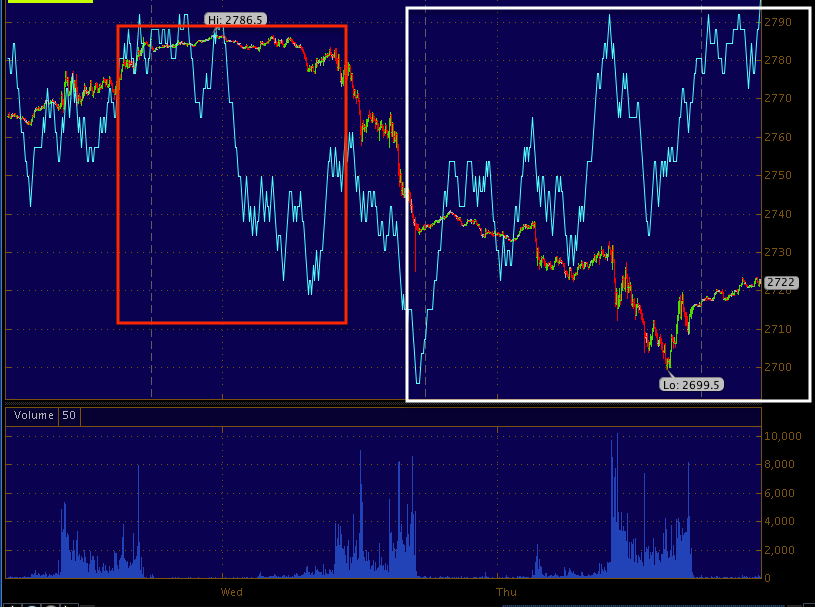
As for the break down, that was the first red flag for the SPX, we saw a recent bounce in HYG and I told you what I think it was, that is seeing distribution too now so we are on track.

One final point with the 5 hour (and thank you everyone for the emails on getting that timeframe on TOS)...

The thing about the market is it is "Fractal", meaning the patterns and behavior you see on a 5 hour chart you will also see on a 5 day or 5 min chart.

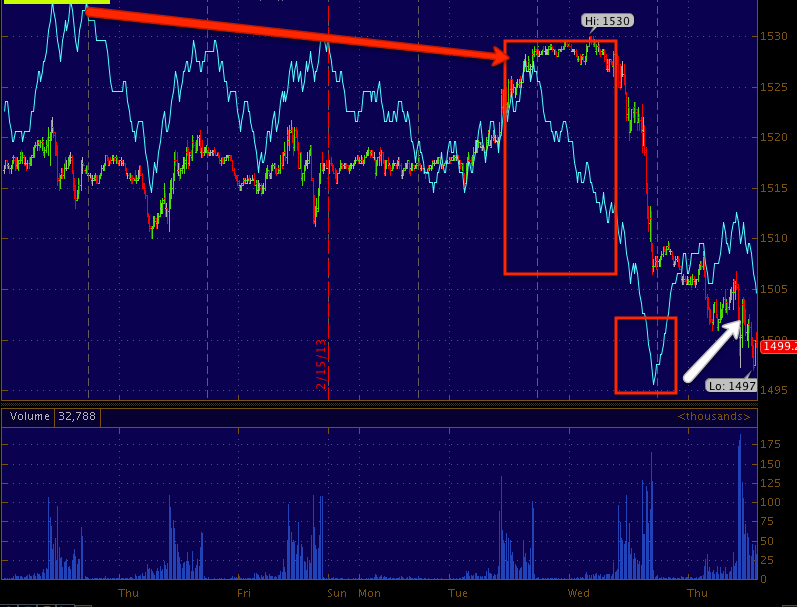
This is an excellent example of what I call the "Pendulum Effect", although rather small compared to what I think we will get when trend 2 (decline) kicks in, it shows the overshoot to the upside, breaking out of the Bollinger Bands, a clear warning and then as usual, the overshoot to the downside. This is why I say, "When coming up with a target, multiply whatever you think is reasonable by 2-3x".

So I do think we will see a move back toward the channel or median of the Bollinger Bands, the market wants to keep as many people wrong as it can at any one time.

ES and NQ both Leading Positive

I have the Leading Indicators layout open so I'm watching 3C on the futures and both the S&P and NASDAQ futures are seeing huge leading positive divergences, I think if you like the idea of any of those weekly calls for a very short trade, you don't have much time before lift-off.

Futures Charts

There's not a whole lot to see that's too interesting right now, but I've had several requests...


ES SPX
 1 min with some intraday relative divergences.

 5 min, with a very nasty divergence in to the highs, a relative positive, this is what the current weekly calls are about.

 ES 15 min, this has been showing a pattern of distribution, it took that channel buster for large scale, all out selling in to it to break this apart. As I said earlier, there can still be  lot of wiggling around and volatility, but the back of the trend is broken. I'm not sure I'd call the far right white arrow a positive divergence as it is still headed down and the 15 min chart obviously takes a longer time to move.

NASDAQ/ NQ
 1 min is leading positive as I captured this, that's right after I posted the move in the TICK.


 5 min  very negative through the highs, a relative positive and leading positive, this is kind of why I favor the NASDAQ/IWM over the SPX/SPY in addition to the 3C charts on the averages as well.

15 min, you may recall late last Friday I was thinking about pulling the trigger on some calls and you can see the positive divergence late last Friday, I decided not too because of the G-20 and the 3 day weekend introducing a lot of uncertainty, but it would have been the right call to make, Again to the far right I'm not sure we can call this positive until the day finishes out.

A lot of damage has been done, but yesterday as the market was moving down, the "Buy the dippers came out in force if you follow the Twitter Stream, it went down lower and they averaged down; right now they'll need one heck of a move to get out of those positions if they are even still in them, the stream went quiet from what I understand implying they likely sold at a loss, but like with the GLD calls, sometimes it's just a little patience and I suspected that, that's why they are March month.

Lots of movement now

The TICK isn't at extremes, but it is very consistent almost like a buy program just kicked in.


All short term timeframes in GLD improving

Probably no pullback

UNG / GLD Update

As for UNG, this isn't a situation of "what position do we take?", it's a situation of, "If it pulls back in to the gap, shows underlying strength, then it's worth taking a look at, until it does, it's not" -at least not for a new trade.

GLD is a bit more difficult, the timeframes it is negative in are 1 and 2 min, this is very close to the negative divergences in the 1 min timeframe only that can cause a lateral consolidation as we have seen, usually when the 2 min is negative too, we get some price correction, but I do think GLD moves higher, if you like it, you might consider phasing in with a partial position here just in case this is all we get on the downside/correction side and leave room in case we do get a correction through price rather than time.

UNG
 The 1 min shows a head fake move on the initial spike up after the EIA this morning and still looks like a pullback is likely, there's no positive in the short term so no reason to buy options right now.

 The 2 min chart is the same.

 Out at 10 mins where it's more important, but not so short term, this looks good for our equity long position.

GLD
 The 1 min negative divergence can cause a lateral price pattern like this...

 However add the 2 min and usually we get a price correction

 The 3 min chart is still positive so any intraday distribution looks to be simply to keep GLD in the area or perhaps to lower it, but it's not strong enough to move the intraday 3 min chart so it's really not strong at all, more tactical stuff by the specialists it looks like than anything else.

The 5 min chart isn't hurt at all, still positive, this keeps me confident in holding the open call position in GLD.

Gold Futures look exactly the same, 1 min negative divergence while the stronger 5 min chart is very positive. I think the phased in entry, leaving room to add if price drops a bit still makes the most sense, but don't lose sight of the fact that this has ALWAYS been a speculative trade, it's not a position trade and not a trade to go swinging for the fences

Market Update

In many cases, yesterday's late afternoon positive divergences keep building which I suspected was a possibility as they failed to bounce by 3:40

 DIA 1 min leading positive, short term only

 DIA 3 min leading positive

 IWM 3 min leading positive

 IWM 5 min starting to lead positive, still not very big, but good enough

 QQQ 1 min leading positive

 QQQ 5 min leading positive

 SPY right now is my least favorite, 2 min small leading positive

The TICK vs the SPX shows improvement in the TICK (see the Histogram at the bottom) while the SPX is moving slightly down, the TICK is lateral, along with divergences, this is a good short term bounce sign