Tuesday, July 22, 2014

Daily Wrap

There weren't really any smoking guns today, nothing too far from what I expected yesterday. CPI data came in this morning a bit hot at 2.1% which is above the F_E_D's mandate or preferred 2% range, the problem is that the trend in multiple economic reports other than just CPI have been showing a developing trend of inflation which I mentioned the day before the last F_O_M_C which Yellen played down as "noise", but the F_E_D has grown considerably more hawkish since with Bullard's "The market is wrong...The market doesn't realize how close we are to our goals", meaning a rate hike which I suspected came from the top even though Yellen sounded like a complete dove at the post F_O_M_C press conference, the minutes though revealed something quite different and it was clear Bullard was sent out with Yellen's blessing and since it has been one after another including Yellen herself testifying in front of Congress making some contradictory, yet much more hawkish statements. Initially I thought this was all about inflation, the one thing that would force the F_E_D's hand on rate hikes no matter what they may want to do,  however since then it seems it's not just inflation, but falling real wages, the "Stag-flation monster".

In that context, it would normally make no sense at all for the market to be up today on the hotter CPI data, but this isn't a market that is discounting on the fly just as of yet, even though it has moved away from the Bernanke put and is discounting as it has not been since 2009. The reason in my view is quite clear, just take yesterday's switch from SRTY which I closed at a 9% gain to open URTY yesterday on expectations of the IWM finally bouncing off the 10 min positive divegrence in place for over a week. Here's yesterday's decision to make the move, Trade Management: SRTY/URTY and here are some of the charts behind the decision which I was not completely comfortable with...IWM / SRTY / URTY Follow Up.

As I said yesterday, a "Rising tide lifts all boats", so logically it would have made sense to close SQQQ and FAZ as well, but the chart support for that trades was not there leading me to believe the Russell 2000 would show significantly better relative performance than QQQ, SPY, DIA and Financials, as it turns out it did and I closed the URTY long todayMoving Out of URTY and Back to SRTY, as charts started deteriorating, SRTY / URTY / IWM Follow up,  as I'm not going to make the same mistake when we called the AAPL top, were all set with a short and then chased a small bounce only to see AAPL run that divegrence over on news Third Point had eliminated AAPL from their top 5 holdings sending AAPL from all time highs to a loss of -45% in 8 months. That's the mistake I don't want to make with respect to the broader market and the reason I didn't flip SQQQ and FAZ which turned out fine as the URTY +3.6% gain for the day hedged the entire portfolio and added some green on the day.

Despite the Russell 2000's outperformance today, it is still -0.5% year to date.

I suspect as I did for most of the last week that the IWM has more of a bounce in it, however there was deterioration today, that doesn't mean we can't bounce more, but in the absence of an excellent reason and entry in what I'd consider a counter-probability trade, I'd rather have the default positions set to longer term core shorts which is why I moved back to SRTY today which is already at a gain. If there looks to be a strong opportunity for a trade, I'll take what the market gives, but this is not the same trading environment of 6 months ago, this is the higher volatility, more unpredictable environment that surprises you with a gap down from overnight trade on something like Banco Espirito Santo contagion of the European periphery as we have already seen. While we are on the subject, another linked ESI company, RioForte sought bankruptcy protection today so the Portuguese contagion story is far, far from over and NOT priced in the market despite what the talking heads may be saying.

This morning was interesting as I posted earlier, we have seen these pre-market gold dumps and saw another today that seemed to be the typical pre-market futures gold dump, but this one came 9 minutes before CPI was released on a positive divegrence (the dump was accumulated) only to see gold futures shoot to 1316 on the CPI release (inflation as gold is a natural inflationary hedge), this was a clear set up.

At "A" gold futures are dumped 9 mins. before CPI and are accumulated at lower prices, at "B" CPI comes out, gold shoots up 12 points to 1315 and at "C" there was already distribution as the trade was done, whether this was coincidence or not at "D" the fall accelerated as the Housing data was released, I tend to think they were unrelated.

However the question still remains as GDX and GLD to a lesser degree have been some of my favorite long term longs and we did great with a +40/+50% long NUGT position and have been waiting on a pullback since...

With this GDX negative divegrence, it should have pulled back a long time ago and we should already be long NUGT rising the next wave higher, however as posted in yesterday's SLV update, SLV / Silver I'm starting to wonder if the GDX/GLD and SLV bases which are typically bought on inflation EXPECTATIONS are now discounting and distributing as the F_E_D's cure for inflation is going to be the same that drives the market lower, HIGHER RATES, SOONER AND FASTER THAN THE MARKET EXPECTS,  which is the thrust of Yellen's warning at her Congressional testimony if you listened closely. Perhaps the market is rethinking how far the F_E_D will let inflation go before reacting with a heavy hand.

One of the best ways I know to determine what's really going on is to get some downside movement and see if it is accumulated because right now we have a typical distribution range and some serious negative divergences that HAVE NOT led to a pullback. This is also why I haven't been posting any NUGT/DUST trades, the signals haven't been there and price shows why. Gold and Silver had mixed closes.

Treasuries did take the inflation data serious this morning as the 5 year, 10 year and 20+/30 year yields all closed regular hours at the lows of the day, meaning the normal treasury/market correlation was inverted today, Treasuries were bid in what looked like a flight to safety during a risk on market move, however it looks to me to be all about the CPI print and F_E_D rate hikes.

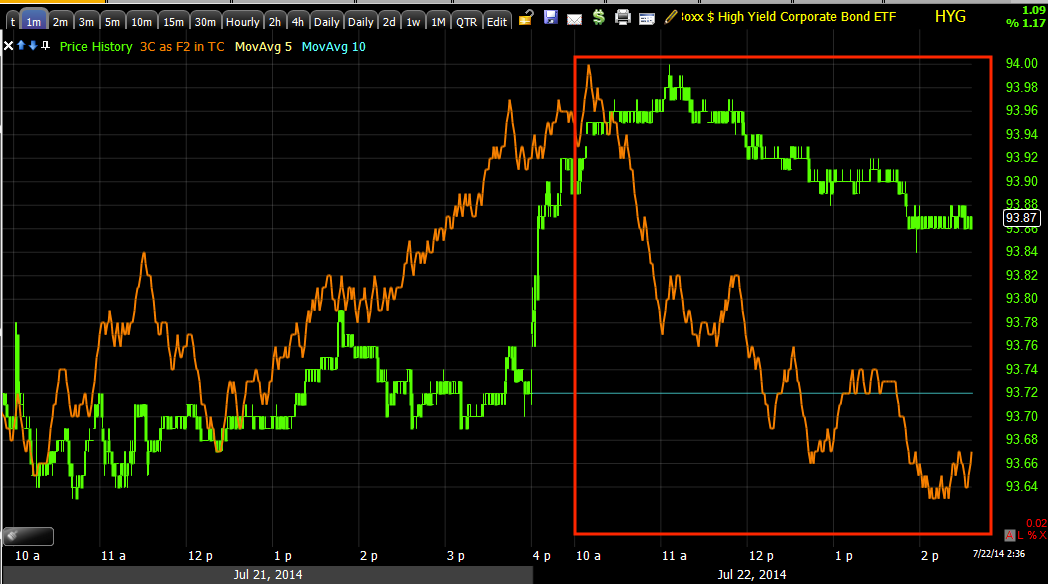
HYG and most High Yield credit was up on the day as we expected from the divergences seen yesterday, however credit did dislocate to the downside in to the close, it's not the smoking gun short term for an IWM led bounce that this is for the bigger market picture...

This divergence between HY Credit and the SPX should be taken VERY seriously,  this is one of several reasons I was willing to sit through a bounce and maintain shorts like SRTY, "A trader that can be both right and sit tight is a rare thing", it's more about the sitting tight with signals like this and again, note the intense deterioration as of July 1 as soon as Window Dressing for Q2 ended (we are seeing this everywhere).

My guess from intraday 3C charts is HYG has some more support to lend the market, but just as bad as this chart is, don't forget the HYG divergence.
No matter what the intraday HYG short term divegrence is, it doesn't come back from this (4 hour leading negative divegrence, intense distribution and again, right around July 1).

As for sectors today, it's almost a mirror opposite of yesterday, Daily Wrap . Seven of Nine S&P sectors closed green, the laggard was.. you might have guessed it, Utilities, but only down 0.21% (A flight to safety trade). In similar fashion, of the 239 Morningstar Industry and sub-industry groups I track, 205 of 239 closed green, almost the mirror opposite of yesterday again.

The Dominant Price/Volume Relationship for the component stocks of each of the major averages was mostly Close Up / Volume Up which is the most bullish, but often leads to a 1-day overbought event with the next day closing lower. Ironically the Russell 2000 is the only one without a single dominant relationship, it was split between Price Up/Volume Up and Price Up/Volume Down which happens to be the most bearish of the 4 P/V relationships.

I didn't like the daily closing candles for most of the major averages and feel fine about having closed URTY and back to SRTY as the default core position, this doesn't mean an IWM led bounce is over, but there are breaks and noise days and with larger upper wicks on the daily candlesticks (higher prices rejected) in the SPX, R2K and the NDX with a small body on the day. Bigger picture, the VIX is showing an interesting candlestick pattern.

The last 4-days in the VIX candlesticks is a bullish pattern called "Rising 3 Methods" which is a  consolidation/continuation pattern implying a move higher in VIX (obviously lower in the market).  The 3 candles since Thursday have all fallen within Wednesday's real body which is the formation. While it is called "Rising 3 methods", the number of candlesticks inside the body of the large one do not have to be 3, they can be 4, 5, 6, etc. as long as they stay within the real body of the large candlestick. All things considered, I would take this candlestick pattern seriously as well.

The SKEW Index remains elevated for a 23rd consecutive day, which should be very disconcerting for any market bulls. This is the longest period at elevated/red flag levels since the CBOE started publishing SKEW. This means premiums for deep out of the money puts are on the rise as there's a perception that there is tail risk or what is more commonly known as a higher probability of a Black Swan event/Market Crash.

Guess when the SKEW moved in to the red zone? June 19th, the day after the F_O_M_C.

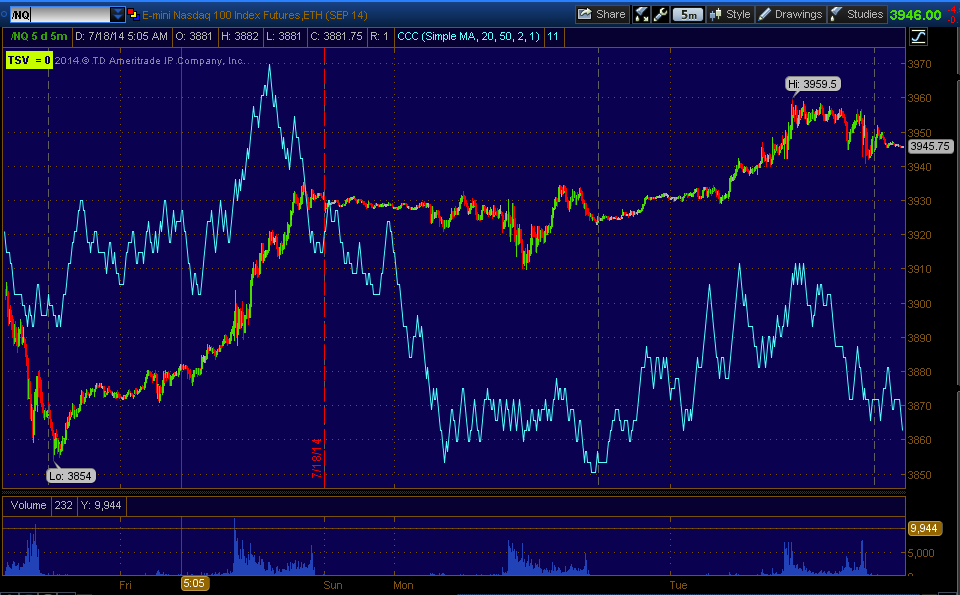
As far as Index futures go, there was a little more damage in Russell futures than I expected this early as they were leading positive and are now in line, ES and NQ (SPX and NASDAQ Futures) are just seeing plain, all out damage.
 The 5 min r2K futures was leading positive which is another part of my reasoning for moving to URTY yesterday, today that has deteriorated a little to in line.

 ES is just seeing all out damage as is...

NQ

For the time being, I expect the IWM to continue to lead its bounce with a rising tide lifting all boats, however relative weakness in the other averages. We'll just monitor developments as the bounce we expected last week and got in the SPX and Q's was not nearly as strong as anticipated with immediate distribution in to the first day of higher prices, something that is a definitive change in character as we use to see several days up before distribution would start. The IWM did show distribution today on the move, which is the reason I moved out of URTY and back to SRTY.

Just as a reminder to keep your eye on the prize and the strange events that have taken place since July 1st, here are some breadth charts as I am posting several a night to try to keep everyone sharp and not just focussed on intraday jiggles.

 The percentage of NYSE stocks trading 1 standard deviation above their 40-day moving average, note the severe decline and especially since July 1

This is by far the deepest decline in a non-piullback situation.

 Percentage of NYSE stocks trading above their 40-day moving average, also a severe decline, the biggest for a non pullback situation and starting in earnest at July 1

 The Most Shorted Index which has been used to ramp the market via short squeezes is just seeing deterioration which makes sense with the indicators above as well as the one below..

 The NASDAQ COMPOSITE's Advance/Decline line which has been ugly for several months, but July 1 started something new altogether. The key to July 1 is nothing other than the first day of trade after Q2 window dressing which is just a big deception.


 Now we can add the Baltic DRYS Index to the charts of concern as it just hit 18 month lows and the worst July since 1986. I know about the overcapacity, but do you think that really matters when 2014 GDP revisions look like this?

 World GDP 2014 Consensus

Our MCP positon started showing some interesting signals, interesting enough for me to put this out yesterday, Trade Idea: (short term options) MCP Call and the reason as of yesterday...   MCP Chart follow up

The 5 min chart above is significantly stronger in a large leading positive divegrence, I suspect something is up.

As for earnings tonight, you probably know AAPL beat on EPS, Gross Margins and Mabook sales and missed on Revenue, I-Phone sales and like NFLX last night, gave lowered guidance expectations which is all Wall Street really cares about. AAPL closed AH -0.58%.

We'll just keep doing what we do until the next signal, but with leading indicators, credit, breadth, 3C charts, etc all falling off a cliff, I'd be thinking about how you want to be positioned for something more than the next week as the unpredictability of this market is rising exponentially and not in a bullish way.

Adding 25% to HLF Short Position

Make sure you saw today's earlier HLF post to understand the basis of this position, HLF Trade Follow Up

The HLF position (short) we've had open and in the green is seeing a bounce on Ackman's presentation day of his "Knockout" evidence HLF is an Enron like scam or so he says, I really don't care, but I do know Icahn doesn't like him and this bounce is more than likely Icahn trying to humiliate Ackman on the day of his HLF knockout presentation as I showed earlier this morning.

I said I'd use higher prices to add to the half size partial position which I'll bring up to 75% of a normal position size and I'll show you what I'd like to see to add the final 25%.

 On the Ackman Humiliation bounce we are starting to see negative intraday divergences, I want to use the price strength to add to the position as the longer term probabilities are still very solid.

 To add the rest, I want to see this 3 min chart which is still in line, go negative. The 1 min will have to show a stronger negative divegrence and migrate to the longer timeframes, but based on the accumulation behind this move, I think that is very high probability.

 This is the 5 min accumulation to set up today's move, as I said earlier, it's more than enough for today's move, but it's not enough accumulation to be any kind of a game changer and the highest probabilities are with the largest underlying trends...

Such as this 60 min chart leading negative in a H&S pattern that has already broken and shaken out initial shorts.

Second Half of USO Trade Setting Up

On July 14th I posted this USO trade idea/s, USO Trade/s Set-up described as...

"Initially I was looking at USO as a long/bounce trade and I still think there's a decent long bounce trade there, but the bigger trade is shorting the bounce as you get a better entry at much lower risk, of course there needs to be a reason to short USO. "

The first part of the trade (the smaller trade), the bounce is off and that's looking like it's just about done, I'd be taking gains off the table personally at this point.

The second half is looking like it is setting up, but there is something I'd like to see to make the trade more interesting.
 USO 30 min positive divegrence, the 14th is when the trade idea/s were posted, the first being a bounce and the second shorting in to the bounce. The 30 min chart is just starting to show deterioration.

The more detailed 15 min chart already shows a significant amount of deterioration in USO, I confirmed very similar charts for /CL (Brent Futures).

 We'd expect the shorter charts to be negative as well such as this 5 min

And intraday the divergences are picking up downside traction as seen above on a 2 min and below on a 1 min...

 These are best used for timing at this point.

This is the daily chart, we were 1-day off the bottom when the trade idea for the bounce was posted so there should be gains in the trade. I'd like to see a gap up and confirm distribution on that gap and open a put at that point, sorry, but I'm not that interested in the trade without some leverage.

What we'd want to see by the close is something like a bearish engulfing candle and I think there's room in the reversal process for another day in the area. We'd also want to see volume higher than the previous day, however for a put entry, it would have to be early so we'd need to confirm distribution on a gap up so if you are interested I'd set price alerts above recent intraday highs so you know if we have a gap up immediately so we can check it and enter a put or leveraged inverse ETF.

Leading Indicators

There's no real smoking gun, there is some deterioration in assets I'd expect to see it in and as I mentioned this morning I believe, "keep an eye on treasuries and flight to safety trades" such as XLU which is flat, however we do have some interesting Treasury/rate action.

We did expect HYG to move north as a short term market lever and possibly TLT and VXX down to activate the SPY Arbitrage lever, but thus far today other than HYG, TLT is not buying nor are the 5 or 10 year treasuries. There are signs of High Yield credit also not buying and our professional sentiment indicators are weak at best, definitely not leading to the upside.

Lets take a look at a few...
 CONTEXT's ES model is showing about a 16 point differential between ES and the model with the model about 16 points lower, I have a feeling a lot of this has to do with treasuries today.

We expected HYG (High Yield Corporate Credit) to be higher today as a ramping lever for market support, however it has seen some underperformance vs the SPX above (green).

This is the 5 min HYG chart, I posted this yesterday and expected HYG to move up, this was part of my analysis that went in to the decision to take off SRTY at a gain yesterday and replace it with URTY for a short term IWM bounce SRTY and riding out any bounce.

 On the HYG move up today, we are already seeing signs of distribution and of course this is going to keep moving longer term in the direction of highest probabilities as  seen below on a 4 hour (strong underlying trade/flow) chart.

This leading negative 4 hour divegrence in HYG is going to drop credit even lower than it already is as you may recall the massive dislocation from the SPX ever since window dressing finished as of July 1st in which we see indicators, breadth, assets, etc. everywhere deteriorating massively as of July 1, this is why window dressing is called the "Art of looking smart", most of those positions added the last week or so of Q2 seem to have been sold July 1st as we expected, but I didn't expect such clear demarcation right at July 1st through numerous assets and indicators. The other date of course is June 18, the last F_O_M_C meeting.


 High Yield Credit which has no link to manipulating the market higher as HYG does , as you can see it is not buying as equities are, given the choice between which to follow, I'll take credit every time.

 This is TLT (20+ year treasuries) intraday vs the SPX, I inverted the SPX prices (green) so you can see where TLT "should" be (normally right in line with the SPX), there's significant outperformance in TLT today which is something, as mentioned above I had thought we should be on the lookout for today.

This is across the curve as well...
 Here I left the SPX intraday normal (not inverted) and used the 10-year rates, remember if rates are down, the treasury/bond is up, in other words it looks like a flight to safety trade, but there are more complicated issues with bank collateral as the F_E_D has absorbed most collateral, so it's not as simple as it use to be.

Remember April 30th (month end) setting the second highest usage of the F_E_D reverse repo (1-day) for month end window dressing and then at the end of Q2 on the last day the facility set an all time new record high for usage, it looks like banks (the 94 that participated) are about 1/3rd of a trillion short collateral so they use the 1-day reverse repo on the last day of the quarter, the next day it goes back to the F_E_D so the banks can fool clients and regulators which is ironic considering who they got the assets from and who their regulator is, they are one in the same.

5 year rates have fallen as well meaning 5 year treasuries are up on the day. This typically acts as a magnet and pulls equities toward rates.

As far as carry trades, just taking a quick look, it looks like the beat up EUR/JPY will bounce, but I don't know that it will have any meaningful impact.

 intraday positive in EUR/JPY

The 15 min EUR futures do have a positive divegrence for a bounce, but I think that is all, go to a longer chart...

And the 60 min Euro is in line so I don't expect this to be much more than a short term bounce and I don't really expect it to be much of a market lever.

Market Update

Right now the intraday signals for the IWM are improving, they aren't in an area that I'd consider re-entering URTY, but they are along the lines of an IWM continued bounce, reiterate, BOUNCE that we have been expecting.

The relative performance of the SPX and NDX is as expected, poor not only in terms of percentage gains, but underlying trade as well.

The same intraday trade seen in IWM is also seen in the Index futures, as well as showing ES and NQ looking much weaker intraday.

All in all, this is VERY similar to last week's bounce (not an impressive one) in the SPX/NDX in which distribution was nearly immediate on any price strength. I do think the IWM has more upside to go, but I remember the AAPL lesson all too well and I'm not going to be on the other side without very good reason and a very good entry like yesterday.

 IWM 1 min intraday from our earlier negative to some upside recovery.

The same is seen on the 2 min chart to the far right for the IWM which means the divegrence is growing stronger, but still a very weak intraday divergence, however in the context of the expected IWM bounce I think this is significant, not significant enough to re-enter URTY, but worth paying attention to.

As expected, the relative performance of the Q's and SPY has been poor. For that matter XLF/Financials as well which is why I did not change the SQQQ and FAZ positions and today seeing their relative performance, I'm glad I didn't take that risk.

 QQQ intraday 1 min

QQQ intraday 2 min

SPY intraday 1 min and it has a VERY slight move up in 3C, not at all like the IWM, really of not much interest other than the fact the IWM shows it, otherwise I'd consider it noise.

And larger damage in to any strength as seen on the 3 min SPY chart.

As I said, the Index futures reflect the same...
 Russell 2000 futures intraday 1 min

NASDAQ 100 futures intraday 1 min

SPX E-mini's intraday 1 min

As far as the TICK data, there's no trend much like price except for the opening gap where there was a print above +1250, since then it's exactly as you'd expect.
Intraday NYSE TICK.

I just pulled up the leading indicators template and am going to have a look around there , if there's anything of interest I'll post it.

SRTY / URTY / IWM Follow up

Yesterday's decision to move from a longer term position in SRTY to URTY for a shorter term anticipated bounce was one that was difficult and didn't sit well with me, but it did hedge the portfolio and added some gains as I suspected the S&P, Dow and NDX would all see relative weakness vs the IWM.

There's still a significant divegrence in the IWM on the same 10 min chart so I may or may not decide to do this again, but what I do know is that if I don't have an exceptionally good reason to be in URTY, then I better be in SRTY and the reasons for today at least were starting to run dry.

 IWM intraday 3C chart was not only going negative, but leading negative, that's good enough reason for me to exit yesterday's URTY long, Trade Management: SRTY/URTY and back in to SRTY, Moving Out of URTY and Back to SRTY

This isn't typically the kind of trading I prefer, but I think with the big picture and the 10 min IWM divergence which is serious as well, but not anywhere near the big picture, both have to be taken seriously or at least the opportunities there. As I said yesterday, I wouldn't fault anyone for just staying in SRTY and keeping their eye on the prize if you have the risk tolerance for that.

 There's migration from the 1 min chart to the 2 min so the distribution is there and moving along to larger underlying signals,  this is exactly what we saw last week in SPY/QQQ which is very different from past bounces that wouldn't see distribution start for at least a couple of days as they made their way higher.

 The IWM 3 min never confirmed today's move up.

As mentioned, the IWM 10 min positive divegrence I have been talking about for more than a week is still there, I would not expect to see any changes in it this early, but I will be watching it.

As for SRTY, look at this intraday divergence , leading positive.

I found this interesting considering the next chart...
 The IWM is nearly perfectly in line on this 3 min chart except a small positive divegrence to the left and a negative divegrence yesterday where I exited it in favor of URTY for a very short term trade. Today there's a positive divegrence in SRTY on the same chart.

 This was the chart that sealed the deal for me yesterday to move to URTY for a short time as I suspected the IWM was finally going to move as SRTY's 10 min was and is leading negative, this is why I "may" re-enter URTY at some point, but this is really not the area to over-trade against the probabilities so  I'll need very good reason.

The probabilities are still firmly anchored on the long term charts like the60 min SRTY leading positive divegrence which is significant is you make a relative comparison between 3C here and back in March at a similar relative price area.