Tuesday, June 14, 2011

Today's Trade

It was a strange market in that the 1 min 3C divergence persisted through most of the day. Typically when a 1 minute divergence persists so long without a correction in prices (one could argue closing trade was the correction, but I feel otherwise) usually the divergence migrates to longer and more important charts.

While for most of the day, we did not see this, toward the end of the day we did. That's about the time the market started selling off into the close.

 Spy 1 min -the first divergence ended with a small dip, even the 3 p.m. spike was still in a relative negative divergence.

Note the 5 min divergence from 1-3 p.m. ending with a retracement toward the close.

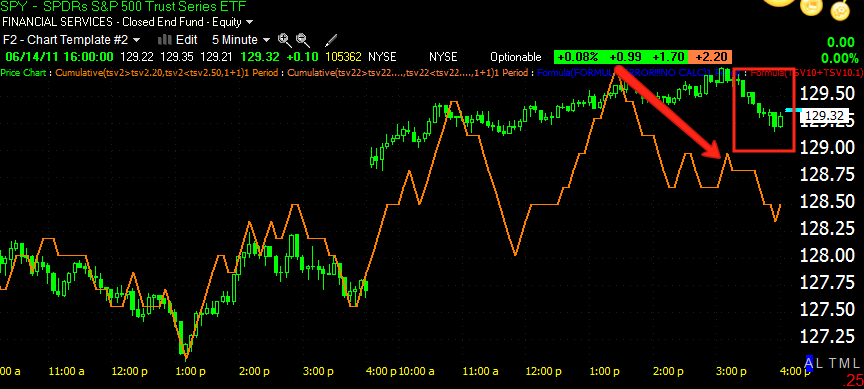
The 1 min ended in a leading negative divergence, the 5 min ended with selling pressure into the close. It's still very possible that the late day weakness could carry over to the open. If this is the case, we'll be looking for signs of a positive divergence into any weakness to buy into.

The price/volume relationship today was dominant and bearish-Price Up/ Volume down. This reflects trades backing away from higher prices, but is usually found in a maturing uptrend, this is not even an established uptrend so my take on the P/V relationship is one of skepticism as to whether the market can really bounce. There's a lot of media calling attention to "6  consecutive weeks down in the market" so the skepticism is natural.

The one bright spot was 5+% gainers which were dominant with 106 closing up on higher volume, that's  the strongest relationship and about the extent of any positive price/volume relationship action.

What I did find odd, but somewhat understandable was the top 10 sub-industry groups today: Building Materials, Recreational Vehicles, Home Improvement Stores, Department Stores, Sporting Goods Stores, Gaming Activities, Electronics Stores, Movie Production-Theaters, Cement  and Heavy Construction.

Most of these are likely to be among some of the biggest losers in a bear market. It makes some sense if you look at the bounce as an opportunity for Wall Street to set up short positions, which is the same way I view the usefulness of any bounce (although as I said earlier, a bounce is certainly tradable).

All of these groups performed in the 3% - 4.25% range-solid gains for industry groups.

Of the worst performing groups (There were only 5 groups of 239 in the red today and the losses were from -.11% - -1.77%) : Manufactured Housing, Regional Mid-Atlantic Banks (which were among the best performers yesterday), Dairy Products, Credit Services and Closed End Debt Funds. The only one that stands out is Manufactured housing which has been a poor performer over the 11 timeframes I track including 1 day, 5 day, 10-day, 21- day, 31 day, 42 day, 52 day, 63 day, 84 day, 126 day and 250 day. Manufactured Housing has shown losses in every timeframe.

As for our bellwether, AAPL-it showed improvement in 3C in all timeframes other then 1 min (like the rest of the market). The positive divergences grew sharper and advanced further. I take this as a healthy sign for AAPL and by extension, for the overall market.

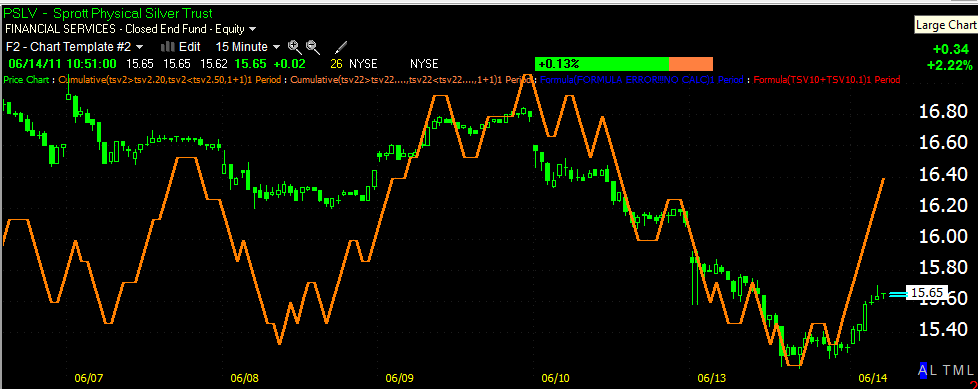
In precious metals, silver did show some improvement today, as if t would be willing to participate in a market bounce, it's not quite at the point in which I would consider it a buy as I believe there may be early weakness tomorrow, it is on that weakness I would consider it for a purchase. This is all predicated on the theory that our bounce probability is still alive, which I lean toward as the most likely outcome, even if we get some weakness tomorrow.

As for Gold, I think it too has the ability to bounce, although I don't see GLD as going to much further north then $150.50 where there's decent gap resistance.

Energy
USO looks like it wants to head higher, I think the $41 area would be a reasonable target for any bounce in USO. More broadly speaking, the energy group represented by XLE did manage to break through it' short term downtrend line around $73.7. XLE in general looks to be much weaker then other important industry group such as Technology which looks set to outperform. You might consider buying TQQQ to play a bounce on any weakness (so long as there's a positive divergence). In fact, between Energy, Technology and Financials, Technology looks to be the strongest group as of today.

As for Bernanke's prepared comments today, they were explicitly geared toward Congress and the impasse or gridlock there with an emphasis on the debt ceiling and budget deficits. Bernanke seems particularly concerned with the Republican idea of a short term technical debt default. There was no language about regulation of the financial industry as we have seen the last two trading days, thus it didn't do much to move the market.

As for the European wild card, Greece, thing are not looking good there. EU finance ministers can not agree on a path forward, there's the disagreement between Germany and the ECB with regard to the bondholder situation and it all may be a moot point if the Greek parliament can't pass their intermediate term austerity/budget measures which is looking less likely everyday with PMs peeling off from the majority parliamentary party nearly everyday the last several days. In effect, PMs are summing up their vote in terms of "I'd like to be able to safely walk down the streets" as the Greek population is not in the least supportive of more austerity measures. It's seeming more and more like Greece will default in one form or another and the implications of that will be very dark for Europe and as such, the world economy.

As I have maintained for quite some time, I do believe that we are moving closer and closer to a market meltdown that will have equity investors trading in the first secular bear market in equity history and it is within this framework that I believe those who quickly adapt will have unprecedented trading opportunities.

I'm going to run some more scans and take a more intensive look at market breadth and I'll be posting a follow up later tonight.

The Miners Trading System Update

As for tonight's signal, both systems remain long DUST. System 1 is moving closer to a long signal on NUGT as I expected would be the case on any market strength, but for the time being, DUST is still indicated as the open trade.

As I mentioned last night, if you are not trading the system currently, I would personally wait for the next new signal to be given as the DUST trade is getting choppy, but still above the 10-day moving average.

Retracement-Stocks Almost Always fall faster then they rise

Here's a quick look at the SPY retracement of the opening to the intraday high (not including the gap)

Currently the SPY has retraced nearly 62% of the intraday trade higher-not including the gap. So it took the SPY 5 1/2 hours to build that intraday trade and only 1 hour to retrace 62% of the rise. This isn't meant to be an indication of action moving forward, it's just to illustrate the following: Two things drive the market-you might say supply and demand, but actually as this chart shows you, the two things that drive the market are FEAR and GREED and judging by the retrace, which emotion do you think is more powerful?

Fear indeed.

It's important to understand this concept for chart reading. When we view a chart, we usually look at signals, moving averages, price patterns, support, resistance, but a price chart is much more powerful if you can translate what you are seeing into emotion and if you can place yourself in the emotional moment of the chart you are viewing. With  little understanding of human nature, charts (especially long term charts-devoid of the daily and intraday wiggles caused by Wall Street) will give you insight into how the market will react.

Finally?

The 1 min negative divergence has been persistent through the day and through multiple tickers. Is it finally taking hold? It appears to be.

 SPY 1 mn chart, the break of the diagonal trendline didn't last long before we saw new highs. At those new highs note the small H&S top.

 Adding a custom indicator tht cumulates volume, we can see this mini H&S top is valid as volume declines on rallies (yellow arrows) and increases on declines-(red arrows). The break from the H&S top is complete. It doesn't have much in the way of an imp;id target, we've already passed that.

Here's today's NYSE Tick chart which has been trending laterally all day until 2:30 or so when it started trending down, showing more NYSE stocks were starting to tick down.

As far as where this is going, I don't see the point in a divergence that long that has not effected the 5 min chart. I think a late day sell-off could be accomplished with a much shorter negative divergence so I'm going to assume that this weakness carries over in to tomorrow's open, perhaps with a gap down.

Ultimately nothing rises straight up or falls straight down, I'm not worried about a gap down in the a.m. as the longer charts have managed to stay positive and even build on it. I do think if we do get such a gap down in the a.m. it will likely represent an excellent area to go long the market as long a we have a positive divergence confirming the gap to be a head fake.

I would guess we'll see continued sell-side pressure into the close. The psychology of the close will be important to get traders to commit to a downside gap and make the effort worthwhile.

TBT Chart Request

A member i looking at TBT as a potential short sale candidate setting up, it's not there yet and the member realizes this, it's just one on the shopping list as the prevailing trend is bearish and any strength (although we can and should play the bounce) should be viewed as an opportunity to set up low risk/ high probability short positions.

 TBT is a leveraged short ETF on the 20+ year treasury, it makes sense that treasuries are seeing a flight right now as money is moving into equities. However, TBT represents a significant top, which would mean treasuries are putting in a significant bottom. Today TBT has done fairly well.

 This daily chart shows TBT's daily cycle from accumulation, to mark-up, to distribution to decline-all 4 stages. The white line within the white box (the accumulation area) represents an estimation of the average accumulated position. TBT moves higher and 3C confirms the mark up phase until November when distribution starts. Distribution never occurs into falling prces, always into demand. Wall Street wants to sell into higher prices, not lower. Finally TBT tops around February and begins stage 4 decline which is where we are now. The bounce is a mere counter trend rally and should be used to set up a long position in bonds.

 The hourly chart looks very much like the broader market which makes sense as people flea the safety of bonds and enter risk assets on a market bounce.

 The 10 min chart is currently in confirmation of the trend.

 The 1 min chart looks much like the rest of the market, suggesting some sort of transitory weakness.

On the daily chart, TBT will probably head toward the $35 level, a break above $35 would be even better as far as setting up a low risk trade, which when the time comes would be in UBT.

AAPL Intermediate Trend Chart Request

 AAPL 1 min accumulation areas in white. The negative divergences on the 1 min on AAPL, are similar to the market. Perhaps we'll see some profit taking into the close or a brief gap lower on the open tomorrow as they haven't developed into a pullback of any real significance.

 The 5 min chart is bullish looking with accumulation at the break on the 13th I showed last nght. The 5 min chart is in a leading divergence so the 1 min negative divergences are contained and don't appear to be any real threat to the bounce, other then some transient weakness perhaps.

 The 10 min chart (the longer the chart, the more important the signals) also shows the same accumulation on the dip below resistance I showed last night. Currently this is a strong leading positive divergence today suggesting more upside for AAPL.

 Finally the 15 min chart with the same accumulation zone at the break of support on the 13th. The 15 min chart is also in a leading positive divergence which is very bullish for AAPL in the short term (over the next few days-week).

Here are the likely resistance zones, the gap around $340 will probably offer resistance and we may see a consolidation in the area, but I feel AAPL has more upside potential based on what we see right now. I'd guess it will make a run toward the $350 level, whether it can post a new regional high above $355 depends on the tone of the overall market, it would be an excellent opportunity to look at AAPL for a short position if that were to happen.

For now, it seems like AAPL and the market may experience some brief price weakness, but it shouldn't have too much trouble getting past that to post higher highs.

A Curious POMO Today Worth Commenting On.

In the current and thus far final QE (QE2) there are only 12 POMO operations left and for our newer members, a brief explanation is in order.

Bernanke straight up lied to Congress when he said the FED "Will not monetize the debt", POMO (Permanent Open Market Operations) have been the underpinning of most of the 2009 -2011 rally. Since the Federal Reserve cannot buy Treasuries directly from the treasury department, they've relied on an agreement with the Primary dealers such as Goldman Sachs and about 40 others. These primary dealers buy treasuries at Treasury auctions, hold them for a few weeks to a few months and simply flip them to the Fed during POMO. In return, the Primary dealers have collected very handsome fees from the Fed for holding these treasuries for a short period of time (with almost no risk) and have used those profits to bid up risk assets like the stock market and commodities-and that's about all that has kept this rally alive and that is why the rally is going from "The trend is your friend" to the part when the "trend starts to bend at the end". The PDs have made hundreds of millions, probably more like billions of dollars through their flipping treasuries to the Fed. This has created an artificial demand for treasuries and allowed the government to sell its debt, with the end buyer being the Federal reserve, thus monetizing the debt. However, with QE slated to end this month, the PDs may be holding more treasuries then they can effectively offload in the remaining $51 Billion of monetization.

Today's POMO showed this panic as the submitted to accepted ratio came in at a staggeringly high 8.9x, meaning the PD's offered up $28.4 Billion in Treasuries and the Fed only bought $3.2 billion. This submitted to accepted ratio is much higher then the average running a little higher then 3x and is the highest submitted to accepted ratio in all of QE2.

The end effect may be the Primary Dealers end up holding treasuries they never expected to be stuck with. The implications of that could go in several directions, but one direction would be the PD's short of cash die to having it tied up in treasuries they can't unload before QE2 ends, may have to resort to selling other assets to raise cash, It may also cause a fire sale in the short end of the curve where they have the most exposure.

One thing is for sure, today's operation was no where near normal and wreaked of panic on the part of the PDs. This could have material effect on the market moving forward if the PD's need to raise cash.

And There Goes the SPY

 SPY breaking the uptrend line.

3C negative divergence (1 min) has just grown worse and worse into higher prices.

Again, we are looking for an opportunity to go long or add longs as the pullback starts to show signs of ending.

Keep an eye on FAS

FAS seems to be leading the start of a pullback, the SPY shouldn't be far behind.

 FAS broke the triangle support line,  and as of now the two intraday support levels below it.

Here's the 5 min negative divergence.

What we'll be looking for is a floor in the pullback to go long FAS as well as other equities on signs of the pullback starting to dissipate, but for now, 1 bridge at a time.

Market Update

 DIA 1 min-this volume move may be the hint we've been looking for as a precursor to a pullback intraday.


 3C went even deeper into a negative divergence at the exact time.

 The SPY pulled a similar move

As did the 3C negative divergence.

Put RIMM on Your Short List...

RIMM's inability to bounce today, plus the competition it faces from AAPL and others makes it seem like RIMMS future isn't going to b so bright moving forward.

 RIMM's 5 day chart with two areas of support, one now broken.

 Here are the two areas on a closer view on a daily chart. Note RIMM hasn't moved up at all today, and while that may not hold true in the days ahead, it's days like today when you can sort out who's who in the zoo. While most stocks will fall in a bear market and I believe that's exactly what we are moving toward, some will fall further and deeper then others. Looking at RIMM last night, I could see a probable target in the mid teens, if things really fall apart, single digits are even possible.  So I want RIMM on my "short" short list. If I have to choose a short between AAPL and RIMM, I'm gong with RIMM.

RIMM's daily chart and cycle-July-August accumulation, mark up until late 2010 and distribution in early 2011. RIMM has entered stage 4, decline and it's a bit uglier then the market, again showing weak relative performance. I'd watch for a bounce in RIMM to $42.50-$45 as an entry point for a short sale position.

Market Update

 DIA 1 min, Still negatively divergent, there's some slight improvement recently. This could be more of a consolidation then pullback. Stocks consolidate in one of two ways, through price or through time, thus far this has been a consolidation through time.

 The 5 min chart still looks like it wants to pulback.

 For any one holding long positions, the DIA has improved and should have upside during the days ahead.

 QQQ 1 min. is still negatively divergent.

 QQQ 5 min is close to inline, but slightly negative.

 The 60 min chart again shows there should be more to this bounce then just a 1 day wonder.

 The SPY briefly hit a new high, volume didn't pick up much so I don't think it's the false breakout we'd expect to see before a pullback.

 The SPY 1 min 3C chart looks like there was some distribution at that minor breakout I mentioned, we'll see, but it seems like a pullback is still in order.

 The SPY 5 min chart seems to support the pullback view.

 The IWM also saw a slight breakout above resistance with a negative divergence there. Since the IWM has gone into a consolidation triangle.


The daily chart in the IWM is now positive, which is quite an achievement for a bounce. This is why I think this bounce will have some legs.

USO has gone negatively divergent at the highs. We should see some downside/pullback there.

If I'm holding long positions already, I'm inclined to hold during a pullback and maybe add a little. If I'm flat, I'd prefer a pullback to go long, but in the big picture, I don't think it will matter too much whether you wait for a pullback or pick up some shares here.

A Pullback just allows us better positioning at less risk.

USO PULLBACK

USO also looks ready for a pullback. The longer term charts have improved, so this may be a short term trade buying opportunity.

Indicies Pullback

It looks like the DIA and QQQ are very close to an intraday pullback, I'd imagine the SPY will follow suite.

 DIA 1 min

QQQ 1 min

Both are in serious 1 min negative divergences suggesting an intraday pullback.

There's always the possibility of a false move right before the pullback, th averages would have to make a new intraday high for that to occur, it's just something to keep an eye out for a it marks a great timing indicator.

Precious Metals

 The positive divergences in PSLV were nearly negligible. Right now it's responding better then it did yesterday with a slight leading positive divergence. I don't think there's any inherent strength in silver on its own, I believe this is more a case of , "A Rising tide lifts all boats".

 The 5 min divergence, again, it's there, but nothing that would explain the move in silver absent the market move.

The 15 min is simply in line, no divergences.

As for GLD

 GLD 1 min -there's no 1 min positive divergence.

 The 5 min hasn't been positive until this morning.

The 15 min 3C is showing a positive divergence as of yesterday and a leading positive today. Again, I think this is all market related off the bounce.

Pullback soon

 DIA 1 min

 QQQ 1 min

SPY 1 min

IT looks like the market is getting a little hot with 1-1.24% gains in an hour, I'd be looking for a pullback soon to add some longs you may like.

Here are a few I like: FAS, UPRO, UDOW, TQQQ, UCO. As for the market average ETFs, I'd either choose 1 or if you use multiple tickers, treat them as 1 trade for risk management purposes.