Tuesday, June 2, 2015

Daily Wrap

Since Friday, we haven't had any divergences of significance in the averages, however the Rounding/Head Fake top price pattern or "Igloo with a chimney", seemed to be the most appropriate probability and since then as this small flag in the averages (especially SPY) has developed, it has become a catalyst for such a move. I still think it likely needs to be done before whatever happens on Friday in Greece actually happens.

However a head fake move (the chimney price pattern), doesn't require strong positive divergences. There are usually some to tell us it's coming, but we actually expect to see negative /distribution in to such a move so today's price charts of assets that should bounce such as Transports with very weak 3C charts actually make some sense.

There's almost always some proportionality to the market whether between a trend and its reversal or the size of a divergence and the move that comes as a result. I mentioned earlier,  that I went through all of the Futures in every timeframe for the Index futures, for the $USDX (which was slammed today as expected with the second largest 1-day loss since March of 2009), the Euro and Yen futures, Treasury futures, gold and crude futures.

$USD's strongest 7-day counter trend rally since 2008 (yellow) followed by a reversal process of 4 days and the second strongest single day down in the $USD since March 2009!

Just imagine our TLT Counter trend bounce trade if everything lines up there.

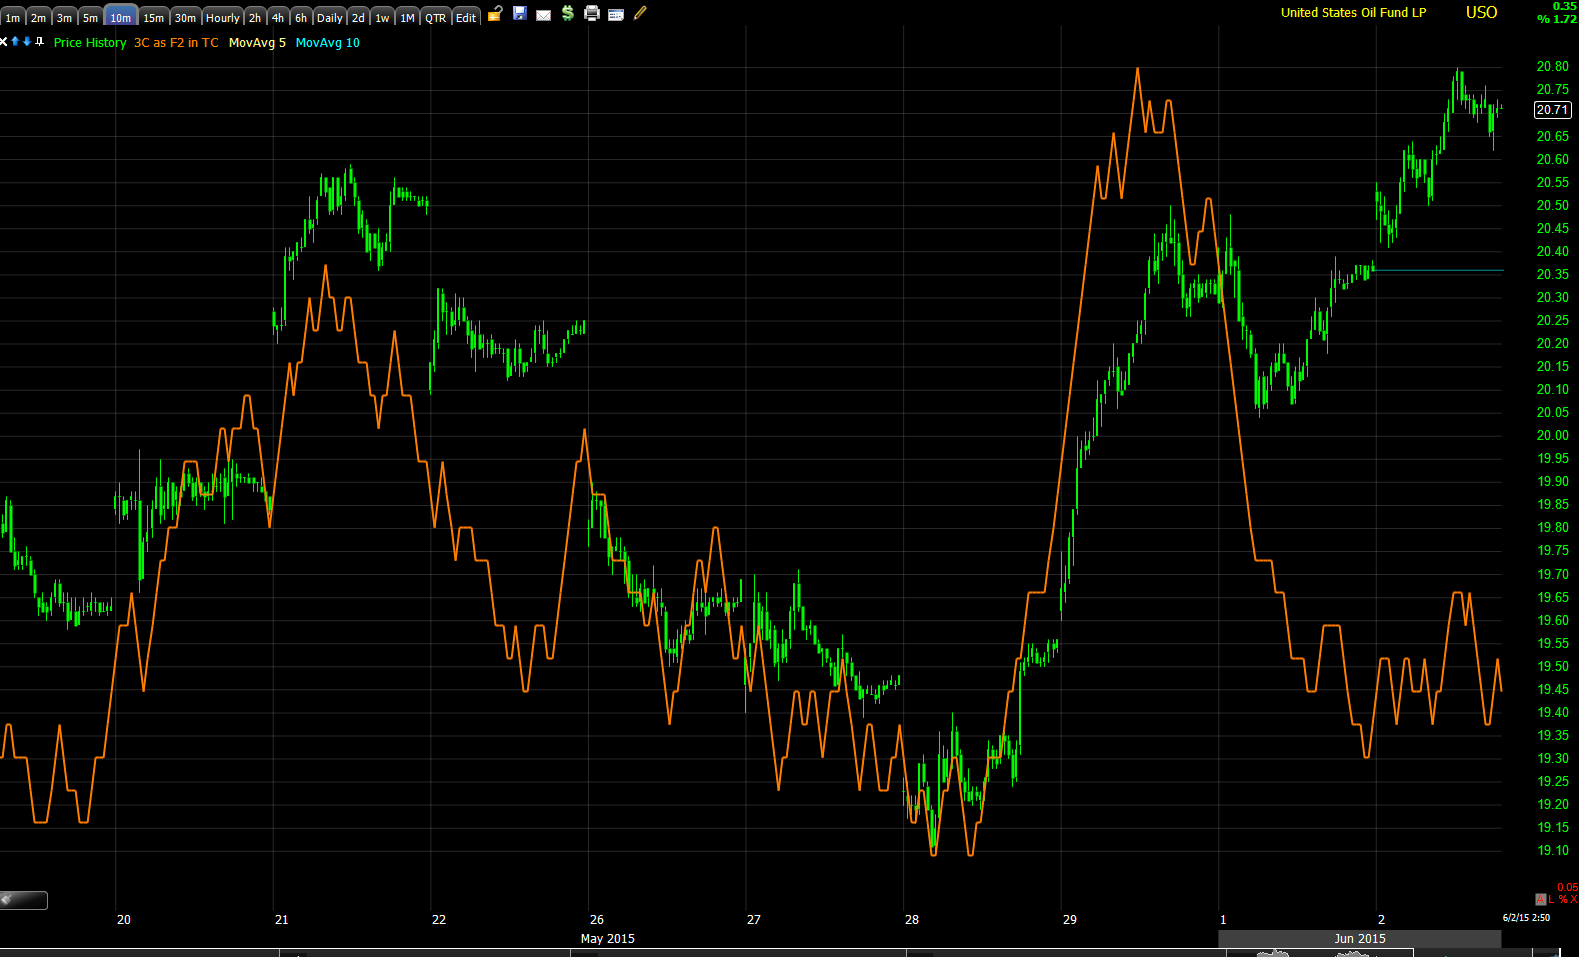
The standout other than $USDX futures which I showed clearly last night as being in a reversal process and near ready to resume its trend lower, was actually Crude with numerous near term negative divergences, thus the Trade Idea: Adding to USO July 17th $20 Put post.

I said that I thought it was likely that either the API inventory data posted after the close today or tomorrow's EIA data at 10:30 were leaked. The result since the idea and these charts, USO Charts...

Crude Futures (1 min) after the close on the API print with a second weekly gain of +1.8 mn bbl after last week's +1.3 mn bbl gain. Crude futures dropped immediately. We still have the DOE's EIA report at 10:30 a.m. tomorrow, but I fell pretty good about the USO put position and not because of the build, because of the charts.

However the point is, I didn't find the usual divergences I would expect in the averages, in fact only intraday ones that actually ended up being correct today...
Just like yesterday's bottom call and top call, today's negative intraday divergence was right, but beyond a day trade, I wouldn't mess with it.

I'm still expecting the same thing I was as of Friday's The Week Ahead post, which again was the following (from Friday's post)...
"Note how the price pattern looks much more like a rounding top when Tuesday's decline is taken as part of the pattern rather than the end of the pattern. Furthermore the head fake "Chimney", which is where I want to enter watch list shorts that look more ready now than they have in some time as the market has been in an exceptionally tight range, never took place."

Nothing has changed since then, in fact a catalyst or technical trigger has just become more clear to fill in the Chimney portion of the top/price pattern...

This flag-like price pattern simply needs a breakout above SPY $212.50 and that should be the catalyst to fulfill the remaining top price pattern. I have little doubt that we'd see the necessary distribution to confirm a head fake move, it's already clear in Transports which unlike the market averages, have a clear base to "BOUNCE" from, no more than that, yet they are seeing distribution in to any price strength as seen earlier today, Transports Even Uglier Than I Thought.

However the point of all of this chart studying, with the majority of watch list assets showing the same theme which is major weakness or what I'd call an unrepairable crack just needing a foot over the cliff on a bounce or what would be the "Chimney " price pattern/head fake move.

Imagine the market and the watch lists being like a long , thin cliff with a crack in it and all it needs is a little "risk on", a foot over the edge to make that Crack in to a rock slide...

Not to be a simpleton or a joker, this is essentially exactly what I'm talking about and I'll show you on the charts...
The damage is done, the cliff is not going to magically repair itself. For that crack and what comes next, we need some simple risk-just like walking out too the edge of a cliff and that risk is represented by the Chimney" portion of the Igloo/Chimney price pattern.

The concept is no different than the set-up to the largest SPX plunge we've had since the September Igloo/Chimney top that led to the October lows.
 Note the rounding top and then the Chimney. the reason the "Chimney" is a head fake, but part of the actual topping process is because it surpasses the rounding top's highs and makes traders thing that the top has been invalidated by a higher high. As I always say, "This is one of the best price-based timing indications we have".  Note how the market fell like a rock as soon as the Chimney had played out.

Although I suspect it was probably the biggest 3-week plunge in many years, unfortunately I can only put together a weekly indicator real quick and the last week of 3 is the largest SPX weekly decline in over 2 years!

So what I found while going through futures... It wasn't any real obvious Index Futures' divergences with migration and multiple timeframes, except for that very serious damage, it was a small, almost hidden divergence that is about appropriate in size for the kind of move we need and proportional in size to the "What comes next" divergences...

 When I teach about how to use 3C, I always say to go through the charts until one jumps off the screen and is screaming so loud you can't ignore it. THIS IS NOT ONE OF THOSE DIVERGENCES. You have to be careful not to try to torture the truth out of a chart, if it's there it's there, if it's not, move along or be patient. In this case we need to know what the probabilities are and while I wouldn't normally put too much stock in a divergence like this (as you can see on the same chart similar past ones didn't lead very far), it seems to be the closest thing we have to our scenario and when compared to the "What comes next", it's very fitting.

For instance...
 The 30 min NASDAQ 100 futures with some boxes drawn to show the approximate strength of the divergence at each point without drawing all over the chart.

 The 60 min ES/SPX E-mini futures again with a strong timeframe and a strong leading negative divergence.

Or even stronger on the Russell 2000 4 hour 3C chart with the last and only positive divergence to show up on such a strong timeframe at the October lows. The leading negative divergences are obviously not only deeper, but much larger in scope.

Finally the strongest of charts and the cleanest underlying trend, the Es/SPX futures daily chart which has just fallen off a cliff in to 2015. Compared to the 15 min positive divergence, this is the "What comes next".

As for internals, I'm not even sure they matter right now, but they definitely aren't singing. There was no Dominant Price/Volume Relationship among the major averages today. The S&P sectors had a dull 5 of 9 green and the Morningstar groups were also dull at 141 of 238.

What wasn't dull was the $USD's trend change since the topping process mentioned last week and specifically in last night's Daily Wrap I think it's important to look at the symmetry and proportionality of charts which can only be gained by looking at enough of them You'll realize that reversals are very rarely an event that happens, but rather a process that unfolds. 

However once unfolded, things can get pretty volatile. As mentioned, within the span of 2+ weeks the $USDX puts in the strongest 7-day move in some 7 years and the second strongest 1-day decline in just over 7 years.

As the market starts changing trends, we'll be seeing a lot more of these "super" moves". The 2002/2003 bull market base to the 2007 top took about 5 years to build, it took about 16 months to tear it all down plus another -15% with most of the damage occurring in only 8 months so you might say bear markets decline about 4 to 8 times faster than they rise and bear market counter trend rallies as you just got a "TASTE" of in $USD, are spectacular trades.

Futures aren't terribly exciting tonight thus far, but we'll be on the lookout for a probable TLT counter trend rally that I have suspected since it broke its long term trend line. 

That will do it for tonight, I don't want to load you up with unnecessary information that has no useful purpose. I'd just say, be patient and let the trade come to you.  You don't have to make anything happen, if you are patient and demand the best set-ups, the market does the rest.

Treasuries Counter Trend Trade Up Next?

This morning I closed the TLT Put position, TLT Follow Up, for near a +40% gain and this was just on a simple pullback.

If you have followed the $USD forecasts including a bounce up (as of April 2nd's forecast) to be followed by a much larger trend down, which has occurred and then a counter trend rally which put in the strongest 7-day move since 2008, you see how strong these counter trend moves can actually be, one of the reasons I think money is a lot easier to make and a lot faster to make in a bear market as they fall much faster and their counter tired moves are ferocious.

So far today, the $USD which we called as being at the end of the counter trend rally/bounce Friday, has made the 2nd biggest 1-day drop since March of 2009. The obvious point is that these counter trend moves can be monstrous and if we can do +40% on a simple pullback, how much better can we do on a counter trend rally in TLT which had its idea rooted in this post, Bond Rally / Swing

All of the concepts that make this a powerful trade are posted right there and they are not unique to bonds or currencies, these concepts can be applied to ANY asset in any timeframe.

For the TLT counter trend rally to work, it needs to show accumulation and we generally aren't in put trades that are showing accumulation so it would be rather new near term.

Also keep in mind that bonds are one of the first assets to break down after a $USD-based FX Carry trade, so while it would make some sense that bonds hit new lows with the $USD breaking down, I also pointed out last night that Treasuries which outperformed equities last year, have already put in quite a trend reversal, one that stocks haven't seen yet. Thus a counter trend rally in bonds/TLT would allow the assets bought with carry trade proceeds to be exited at better prices or perhaps smaller losses in some situations. So we may expect certain behavior based on the norms, on a short term basis (the $USD counter trend rally was about 2 weeks), short term differences away from our expectations can very well be part of closing down a carry trade.

 TLT (20+ year Treasury Bond Fund) daily chart. In 2014 TLT/Treasuries outperformed the SPX with a +23.25% gain.

Note the lower lows and lower highs in TLT already, even after outperforming the SPX by nearly a 2:1 margin. This is a typical sign of a carry trade unwind, but while bonds are the most popular asset financed with carry profits, the chase for yield also saw equities get their fair share of proceeds.

 Yet, even though the SPX only put in a +12.39% 2014 performance vs Treasuries +23.25%, we have not seen the same kind of equity unwind yet. Perhaps... Treasuries will see a CT bounce allowing them to be exited at lower losses or no losses while rotation turns to equities?

 Since closing TLT this morning, it has started building a new positive divergence seen on a 1 min chart above, good thing it was closed when it was...

This has migrated quickly today to the 2 min above.

The 3 min

And already the 5 min chart in half a day.

Even the 10 min chart is starting to go positive.

However this is the second part of a larger base...

 You can't really understand the principles that would guide such a strong move in TLT/Treasuries if you don't understand the trade set-up, which again is here, Bond Rally / Swing.

The Counter trend bounce/Rally would be part of a Channel Buster and break above the long term TLT trend line which was recently breached in a trade thick with shorts.

I expect after this last portion of the base is in place, we'll see a strong move above the long term trend line,  but I don't see this as a reversal that will hold-the same thing I said about the $USD. It's a counter trend bounce, but as you saw with the $USD, they can be insanely strong.

 The larger  picture in TLT -30 min with the second area of the larger base starting today. There should be some reversal process, but I think we are much closer to the start of the trade than we may realize, I expect to be opening it this week.

Again, if we can do nearly +40% on a small pullback, imagine what we can do on a well-timed counter trend rally.

USO Charts

It appears to me from the charts below that USO which I fully expect to build a larger base, just put in a counter rend move. Oddly with the $USD down as it is today, you'd normally expect oil to not be putting in negative divergences. the one thing that comes to mind is perhaps leaked API inventory data out after the bell today poor tomorrow morning's EIA inventories for crude...

Most of the charts are obvious enough that they don't require any notation.

 USO's daily chart/base. I've expected USO/Oil to come back down inside the base and finish building it out and then moving to a reversal of trend and back to an uptrend off this base.

 USO has been trending lower back inside the base as you can see by the clear channel, maybe a bit too clear. The run at the yellow arrow looks like a counter trend mover and the break above the channel would suck in longs and squeeze shorts, using the predictability of the price pattern against traders.

The USO charts below are consistent in their divergences, however the really nice trade will be when USO pulls back and we see strong positive divergence building, that should be the entry for the intermediate or primary uptrend.

 USO 1 min

2 min

3 min

10 min

 15 min with red hash marks showing the trend lower back in to the base.

I went through all of the timeframes today in Index Futures, the $USDX, Euro, Yen, Gold, Treasuries and Crude. The most consistent divergences through the most timeframes without interruption was Crude futures, negative but in the short to intermediate ones I'd expect for an asset that is building a stage 1 primary base.

 CL 1 min

CL 3 min

CL 5 min

CL 10 min which I think shows the nature of a counter trend bounce's underlying trade very well.

CL 4 hour

Trade Idea: Adding to USO July 17th $20 Put

This was a speculative size position from yesterday, Trade Idea: USO / Oil (short).

I think I'll add a bit to it and bring it a little closer to full size.

USO / Oil Looks Primed for Short Term Pullback

You probably know I like USO for a longer term uptrend, but not before it finishes its base and I think this recent counter tend move of the last several days is failing here.

Quick Market Update

Today we have a worse signal than yesterday when we called an intraday top that some of you day traded (as well as an intraday low). Today we had no such intraday 3C low and the intraday top or 3C divergences look worse than yesterday's. Even TICK has fallen out of the channel, but there's just something here I don't trust. It may be that I have an expectation and despite the fact that there was no support for today's modest gains, they were able to pump them out any way. This fits with what I think the highest near term probability is, so perhaps that's why I don't trust calling an intraday trade/short right now or even perhaps something bigger.

The charts always make it more clear...
 SPY intraday 1 min today (red box on time axis is today).

 IWM the same, as bad or worse looking than yesterday's call for a move to the downside.

 QQQ with the same...

And even the NYSE TICK channel broke.

However as explained yesterday in several posts and a finer point in last night's Daily Wrap, my suspicion has been we get the Igloo/Chimney top, in which case we'd expect to see VERY weak 3C charts as well as it is a head fake move. This Flag has been the focal point for me in launching that moove, a break above the upper trendily which is where we are.

To fulfill the entire move, price needs to go in to the chimney area and the charts should remain very weak as they are now.

Perhaps it's because I think this is the most likely scenario.

Going through Index futures, they have fallen off a cliff which I have shown yesterday, 30 min, 60 min and 4 hour. The market is ready for a large, real drop (not a corrective move), those charts are reflecting it. Something just doesn't feel right near term in calling for a downside move intraday like yesterday on these negative charts. I get this feeling they are suppose to finish this chimney.


$USD About to Change Everything

It's difficult immediately to say which assets will be effected first and which will escape the move for a brief period and how long that might be. However this tells us about the trajectory of the carry trade and the advancing losses, that will be evident in the $USD's price action today and how sharp it is. Furthermore this will change June Rate Hike expectations as a "Strong $USD" has been one of the things the F_E_D has been complaining about as a block to raising rates, it just so happens that by chance, each time they've met, the $USD was in a moment of temporary strength like this last counter trend rally. With a clearly weaker $USD, that won't be an excuse used to avoid hiking rates at the June meeting.

One last thing on the nature of counter trend rallies, by definition they occur in an established downtrend, that's the only way a rally can exist and also be counter trend. As I have said for years, "these are some of the strongest rallies you'll see in any kind of market, which is why bear markets are so interesting to trade as they fall apart about 4 times faster than they build and their counter trend relief rallies are some of the funnest, most profitable trading you'll see.

The $USD's counter trend rally only had 7-days of actual rally that ended last week, however this was the strongest 7-day move in the $USD since 2008!

Now the charts as I suspect you are about to see how fast a carry trade at 300:1 leverage will send prices lower not only in the $USD, but carry trade financed assets...

 The intraday 1 min $USDX chart in line on the downside. I've been saying this move was over since last week and especially last night, it just needed to finish its reversal process which is simply the normal reversal of an asset, rather than the instant reversal many traders assume.

The 15 min $USDX chart with a clear leading negative divergence sending prices lower, but we are just getting started.

On a 60 min charts the area that spans the yellow arrow is the 7-day counter trend rally, the rest of the time (5 days) is the reversal process at the yellow rounding arrows. That decline in price to the far right is price, not a red arrow.

And on a daily chart as shown last night, the 4-days (now 5) of reversal process with long upper wicks and resistance as a rounding top took over. Today's daily candle is the long red one to the far right. Soon the $USD will re-enter its downtrend and make a new lower low.


Quick Market Update

Unlike yesterday, I'm not so sure I want to call these divergences intraday reversals which some of you trades with good success yesterday for double digit gains.

I'm more looking at this right now the same way we saw the weakness in  Transports Even Uglier Than I Thought

Here's an example and this isn't one average, this is EVERY average and every Index future. The price movement I suspected as of Friday would need this kind of market movement to complete it, but I don't think I've seen such weakness starting with no positive divergences even intraday at the lows unlike yesterday at least (morning)...

 SPY 1 min intraday which is the easiest chart to get confirmation from as it is the weakest. There was no positive divergence unlike yesterday at the a.m. lows and there's a clear negative divergence like transports in to the attempt to move higher.

The DIA shows the exact same thing. You could almost interchange these divergences between the averages and they'd have the same effect, the same very weak look.

 For instance, the IWM. You can see yesterday afternoon's negative divergence sending prices lower in to the close, but again unlike yesterday there's not even a hint of a small positive divergence such as we saw at that morning lows and the negative leading divergence is almost a spitting image of the DIA above (DOW).

 The QQQ 1 min intraday with the same.

And, all of the Index Futures look the same as ES (1 min) SPX futures below...
 Yesterday's afternoon negative can be seen to the far left then mostly in line overnight and absolutely NO confirmation of upside this afternoon.

Keep an eye on the TICK...

Should the channel be broken on the bottom, I suspect this VERY weak move will fall apart quickly, that I'd consider a day trade on.

Now you can see why I would enter no trades Friday with such weak charts other than those that have strong signals.