Tuesday, November 22, 2011

Today summed up in 1 chart

The NYSE TICK chart, no trends, almost perfectly balanced between the plus and negative side, basically no movement.

EOD Market Update

There's a little momentum over the last 15 minutes or so, still the market is pretty blah.
 ! min DIA shows a little positive 3C momentum, not much and only a 1 min chart

 On the next timeframe, there seems to be a short term intraday bottom, again, not very impressive.

 The 5 min hart is still leading negative, but I would think it will catch up to a more neutral position.

 The 1 min QQQ looks horrible

 The 2 min looks even worse!

 The SPY is at best in line on the short term chart.

 And negative on the 2 min-leading negative.

 This 5 min chart for the SPY is the only thing I can find that looks a little bullish.

Other then that, the fact that today's downside momentum is flat, that's a positive development short term and it looks like we'll get a candlestick "Tweezer Bottom" close over the last two days, which is a short term reversal, so maybe we'll get that bounce, but the market didn't react well to what should have been positive news, on the other hand it didn't fall apart today either.

The truth about bear markets is that we typically see more up days then down days, it's just the down days are much bigger, so a day like today and maybe a bounce is not at all out of character with a bear market. Another defining feature of a bear market believe it or not, is low volume. This week it is low for obvious reasons, but it seems like that is a theme that may stick for a while.

That's my best bounce case at this moment and I would like to see a bounce to get good positioning on shorts, either add-to positions or new positions for members.


GLD Update

 GLD daily is near some support and has put in 2 bullish short term reversal patterns, still I just can't get excited about owning GLD, even if it manages a bounce. The volume on the two up days in those Harami reversal patterns in the green boxes are exceptionally light volume.

 On an hourly chart, 3C pointed to the top in GLD and is now leading negative, which is kind of a big deal on an hourly chart as this is the longer term trend. As you can see, 3C is making new lows and price should soon catch up to that leading negative divergence.

 The 15 min chart shows the same, the top, a leading negative divergence and no sign of any accumulation here.


 Even the short 2 min chart can't even confirm today's higher prices

 On the other hand, the leveraged GLD short, DZZ looks very bullish, this is the 60 min chart in a leading positive position.

 The 15 min chart also leading positive.

And even though it's down a bit today, 3C doesn't look bad.

In my opinion, the market is too volatile to try to trade anything other then what looks to be the closest you get to a sure thing and for me, that means I want to trade stocks that have strong long term trends in 3C, meaning the 15, 30, and especially 60 min charts. The market will be volatile and choppy, I feel a lot better holding a stock through that volatility that exhibits strong underlying strength or very weak underlying action for a short.

USO Update

This may be getting close to a short position either via SCO or DTO.

 Here's USO's bounce which I talked about yesterday, my target was a bit higher around the red trendline, volume is very weak and thus far the bounce isn't very impressive.

 3C 2 min is negative at the bounce highs today and leading negative at that.

 The 5 min went negative as well, but there still seems to be enough accumulation in the 5 min to maybe take USO a bit higher.

 The 10 min is negative as well, I would at least expect some confirmation, but every time frame negative... not what I expected.

 The 30 min remains negative and is just in line with price action, which in my view, makes USO still a short worthy of consideration.

Here's my Trend Channel, I'm thinking USO may make it to the top of the channel, however, I don't think it is too early to start phasing in to a short position, via whatever vehicle you choose (short USO, buy SCO/DTO), my choice would be to buy SCO. However,  would phase in to the trade, decide what you risk management will allow for as far as position sizing and I would maybe enter 25% of that today, if we get a little more upside add another 25% (50% of the total) and then on a confirmation of the break lower add the remaining 50%.

Market Update

I seriously don't know what to make of all of this, first credit has ZERO reaction, the market really didn't react very strongly on a light volume week, if you had told me this news would be out in advance, I'd expect a 2% minimum move on such light volume and now the 3C readings are just plain strange.

 DIA 1 min saw the positive divergence, I'm guessing a leak before the IMF news came out, but has since went slightly negative and is in line more or less.


 The 2 min chart, is pure negative, look at how negative it went on the news rally!

 Here's the 5 min chart, again going from yesterday's positive divergence and then negative on today's news and leading negative.

 You see what I mean, at new lows here.

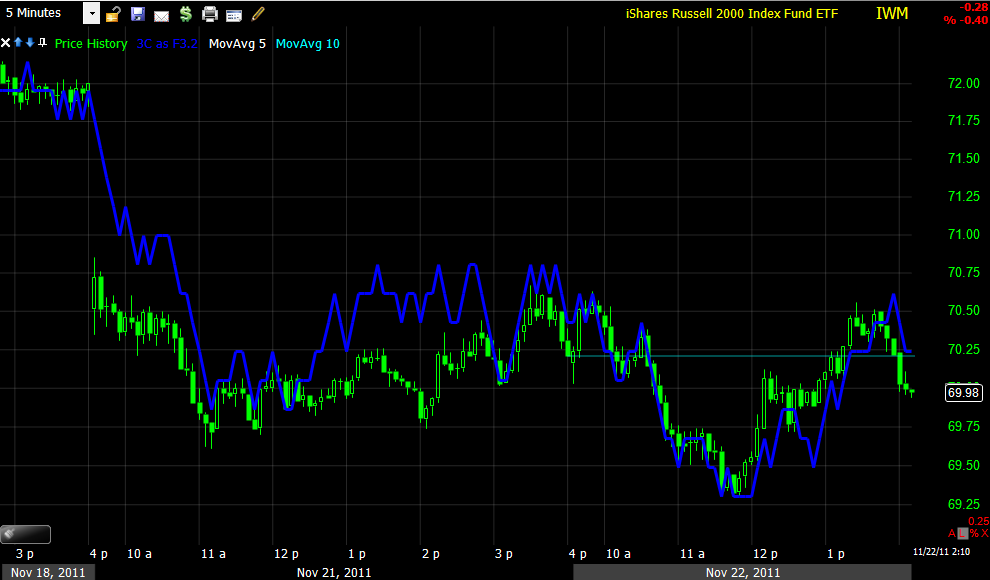
 The IWM 1 min chart is currently in line, nothing exciting here.

 The 5 min chart is totally in line?

 And the 10 min chart is negative in to the news rally?

 
 Here's the QQQ 2 min. from some strength yesterday that was perhaps used up i the afternoon rally to a very negative chart now.

 A close up on the 2 min is leading negative?

 The 5 min showed some strength building yesterday, it now shows strength falling apart.

 SPY 1 min has gone negative on the IMF rally

 The 2 min is only in line

 The 5 min appears to have some strength in it, but
 when zoomed, it's no stronger then yesterday at the close.

 And the 10 min is simply in line.

 ES is very strange, it is leading negative!

And the TICK chart, I would think would have a solid uptrend, instead it is lateral with as much action in the -1500 as the +1500 zone.

VERY STRANGE

Credit Indicators

With all that's going on today including the advance leak of the F_E_D minutes (remember these reports are in media hands under embargo and I suspect this is exactly how Wall Street front runs important releases as they may have a few friends that make a few extra bucks for sending them information), oddly there isn't much of a shift anywhere.

Commodities are doing better then they have recently, but nothing to get too excited about, High Yield Corporate is actually underperforming the market, the market is slightly ahead of the Euro, but again nothing huge, rates haven't changed much in 3 days, but just saw a sharp move down starting around 12:50, High Yield Credit moved up yesterday, but hasn't moved any higher then yesterday's move, Financials momentum wise seem to be underperforming the broad market, but JEF is in the news today with more trouble, and supporting all of these finding, the current intraday CONTEXT Model of the risk basket vs ES has converged.


You can see the current difference is at the zero line, meaning ES is in line with the model.

The IMF NEWS

This is a tough one to call. The IMF and the "International Monetary Fund" is really more synonymous with United States then "International" as the US is the biggest contributor and de facto leader.

Here's the news moving the market, and I do find it interesting that the first positive divergence of the day started just before the news came out-"Front Running" and probably by Congressional Staffers.


  • IMF APPROVES CREDIT LINE PROGRAM CHANGES TO PROVIDE LIQUIDITY
  • IMF CREDIT LINE CREATES NEW SOURCE OF FUNDS FOR MEMBER NATIONS
  • IMF ADDS EMERGENCY FUNDING TOOL TO ASSIST COUNTRIES IN CRISIS
  • IMF NEW CREDIT LINE AVAILABLE FOR SIX MONTHS TO TWO YEARS
  • IMF CREATES PRECAUTIONARY AND LIQUIDITY LINE
  • IMF SAYS ACCESS UNDER 6-MONTH LIQUIDITY LINE COULD BE UP TO 500% OF MEMBERS QUOTA
Nov 22 (Reuters) - The International Monetary Fund on Tuesday beefed up its lending instruments and launched a six-month liquidity line, throwing help to countries with solid policies that may be at risk from the euro zone debt crisis.

The announcement comes as concern grows over the spreading crisis in the euro zone, which has moved from Greece to larger economies such as Italy, Spain and France that are now under attack by financial markets.
The IMF said it was establishing a flexible liquidity line would act as "insurance against future shocks and as a short-term liquidity window to address the needs of crisis bystanders."

The IMF said the new liquidity line would be available for six months to countries with relatively good policies that are facing short-term balance of payments needs due to events not of their own making.

The language is interesting in that it seems to say that the help is available for innocent bystanders who are suffering through no fault of their own. This may be part of the answer to the question I asked earlier about the ECB and why they continue too finance debt.
Here are the downfalls that have come out in early analysis...
The drawing rights are based on a multiple of each country's IMF quota, the math on Italy and Spain combined would allow them to draw $91 Billion dollars combined, which is estimated to be enough to finance the two countries for approximately two months. It's not the grand fix.

The next problem is that this need to pass Congress, this is important because the US contributes 17.7% of the total to the IMF, by for the largest lender, and if the money is being used to bailout Europe, you probably can't expect Europe to be contributing to the fund. Look at this chart of the allocation of money provided to the IMF. I'm not sure who the second biggest contributor is outside of Europe, but Japan, the world's 3rd largest economy contributes 6.57% and China 4%, so obviously passing Congress and being ratified is crucial.

Furthermore, the IMF agreed last year to double the quotas or dues to be paid by each nation to roughly double the size of the fund, but as of yet, only 17 of 187 countries have officially agreed, among those who have not... some of the bigger quota countries such as the US, China and Germany have not ratified the increase.

Lastly, the amounts that countries can borrow, depending on which of the two credit lines is used, can be staggered in payments with the first coming after they are approved and the second up to 2 years later, With the speed of the EU crumbling, this may not be sufficient, but we'll have to wait on further analysis and details. For now it has sent the market higher, but strangely not at all what one might expect. I would expect a 2% move almost immediately just on the sugar rush initially, the S&P is only up about .15%


There's that positive divergence I mentioned...

I have the credit template loaded and will post findings right after this post, but take a look at what the last market update's positive divergence produced. Next will find out if this is sustainable.
That is a perfect intraday (1 minute chart) "Bull Pennant", it looks like the pennant flag that you see at a college football game or baseball, it is a bullish continuation pattern, but a VERY obvious one, which means that the market may find it worthwhile to head fake and manipulate it. Volume on the flagpole portion is perfect, volume on the pennant consolidation is flawed, it should have a smooth steady decrease in volume, instead it has some spikes in red that don't belong in the confirmed or true pattern. IT also ran in to resistance from the 10:30 a.m. rally. I'm going to take a look under the hood and see if there's anything to this or any opportunities.

URRE Update

Here's a trade that some members made some $ on and it looks to be setting up again. One thing is for sure, the mining sector, whether it be metallic or non-metallic has not performed well lately, which explains URRE's recent performance. This is a Cats and Dogs or speculative trade, it can move 200% in a few weeks and it does have a larger price pattern implied long term target of over $3.50, so it has a lot of room, a lot of opportunities, but risk management must take in to account the volatile and speculative nature of these high flyer trades.

 Just like PEX, the 3C daily positive divergence is VERY strong and implies a LOT of accumulation. Unlike PEIX, stochastics is not overbought and moving loser to an oversold level which makes me more comfortable.  I see a clear set up for a trade here, so you may want to set alerts (if you need charting software that will allow you to do so, email me).

 Here on the daily, I am pointing out it is in the Industrial metals and minerals sub-sector, which has faced pressure recently throughout the sub and main sectors. There is a VERY clear line of support (formerly)/resistance (currently) and at a perfect whole number, $1.00 which is almost sure to be where stops and limit buy orders will or have congregated as the human mind just naturally and subconsciously gravitates toward whole numbers (think about why items are priced at $.99 rather then $1.00), it's a well known fact in retail and in the market. In green you see support, in red resistance. The volume/price pattern is similar to a bull flag, which is a continuation pattern, meaning to continue the move up.

 3C is much more productive here then in PEIX, the hourly chart shows the top and accumulation both before the move and currently, note that current accumulation pretty much started when price broke below the $1.00 mark and there's a reason for that, volume picked up as stops were triggered making it easy to accumulate in bulk without reveling themselves as they simply took the other side of the trade.

 The 15 min chart also shows the major points of interest and confirms accumulation below $1.00

 Even the 10 min chart is productive.

 As well as the 5 minute.


While URRE could probably be bought in the area, my ideal trade set up would take my Trend Chanel in to consideration, the red areas are stops, both long and short trade stops and currently to break the downtrend, price needs to cross above the top of the channel in white, which happens to be at the $1.00 mark. Any move above that area and on volume  would be a trade worth a shot in my view and you might just make a double in a week or two. I would also consider this to be a speculative trade and be on top of your risk management. We take what the market offers and if the market offers a speculative high flyer, then so be it, but make sure you keep that risk management your priority. URRE will offer more then 1 chance, but you need to keep your dry powder for the opportunities, not let a trade drag you down for months.

I would absolutely set alerts and keep URRE on the radar.