Friday, December 2, 2011

ES View

As the 3C ES has been a new addition, I've wanted to get some experience with the market under my belt and make sure 3C is performing as it should, the 1 min has been near flawless so I figured why not take a look at a few of the other timeframes that have been performing well.

 First the SPY-I was looking for a deeper close today, but as I posted early this morning, the idea was a gap up and a close at the lows, that's what we have and if you wanted to really pinch a penny, it turns out to be a bearish engulfing candle today off yesterday's Harami reversal.

 ES 15 min doing a lot of leading today as well.

 The ES Hourly

 And for long term back to 2009, the weekly which would be leading to new lows below the 2009 lows, it's not that far off from 3C and Money Stream.

 3C

Money Stream.

These long term charts are hard to manipulate, not even QE got past them.

It's not a good sign when...

15 and 30 min charts start leading negative in a single day.

 DIA 30 did a lot of leading negative for a day and a half, these charts take time to move.

 Look at the IWM 15 min

 And the QQQ 15 min

As well as the SPY 15 min.

This is when intraday charts can bounce around as much as they like, but it's pretty hard to overcome a 15/30 min leading divergence that forms in a single day.

Look at what happens when the 3rd leg starts getting kicked (Financials)

 XLF breaks that intraday support....

 There go the Q's

And the next intraday stop is hit in the SPY.

Financials look smoked

They are sitting at support as of these captures, but I seriously doubt they hold with 3C looking the way it does,
 Intraday 1 min chart/support

 1 min 3C

 2 min 3C

 5 min 3C

 10 min 3C

And worst of all, the leading negative divergence on top of the former divergence, that's all today on a 15 min chart.

I'll be adding to my financial shorts.

Market cracking lower

We'll see if financials can hold support, if not, the S&P should move lower in to the close.

It looks like stops at the intraday support have all been hit, next level will be yesterday's close

Credit/Risk Basket

 Commodities remain dislocated from equity, but made a move this afternoon higher.

 That can probably be explained by oil to a large degree that may be pricing in some geo-political risk as the situation in Iran is very unclear as to why things are exploding with no good answers.

 Still USO remains in a momentum stall here and I'm still holding oil shorts.

 The Euro took a plunge on the republican legislation, it still remains dislocated by at least several hundred Dow points.

 Here's the larger view of the dislocation between the two assets that usually travel in lock step.

 High Yield Credit which remains severely dislocated is moving lower toward the close.

 And rates today took a plunge, they also remain severely dislocated and equities tend to gravitate toward rates.

 Financial momentum vs S&P momentum picked up but is now leaking lower.

As you an see XLF is testing intraday support now so the close should be interesting.

Market Update

It looks like the market wants to hang at this support level a bit longer, we'll see into the close.


Context continus to move lower, I'm going to pull up our indicators and see what credit is doing.

That was obvious support

Stops just got handed it to them, why they keep putting stops at intraday support is beyond me...
Note the pick up in volume as the stops were hit by a few cents.

Intraday Update

We're still sitting at some support, for the Q's it's right at the unchanged mark.

 DIA 1 min keeps moving lower

 2 min is also leading negative, in several ways.

Here's the SPY 1 min with the last bounce and a move toward leading lower.

The Context model is also leaking lower, much lower then ES as credit starts to sell off more aggressively.

Intraday update

It looks like that last intraday bounce is about to fail ....

Market Update

So far the market is rolling in a "U" as I kind of suspected, we may see an intraday bounce as the 1 min has a positive divergence, then again it's a 1 min chart and with momentum it may be rolled over, but I wanted you to know about it..
 SPY 1 min intraday trade

DIA 1 min intraday trade.

Early Update

The early action thus far looks a bit dismal, ES is leading negative as are the averages in almost all cases.

The confirmation candle I mentioned earlier and displayed, looks like it has a good chance of materializing.

 DIA 1 min close up of this morning's action, actually we can see several days of leading lower, I think I count only 1 short term positive divergence in this series.

 The two min chart which still has not confirmed and this morning has a negative divergence near the morning highs.

 The 5 min chart is leading negative.

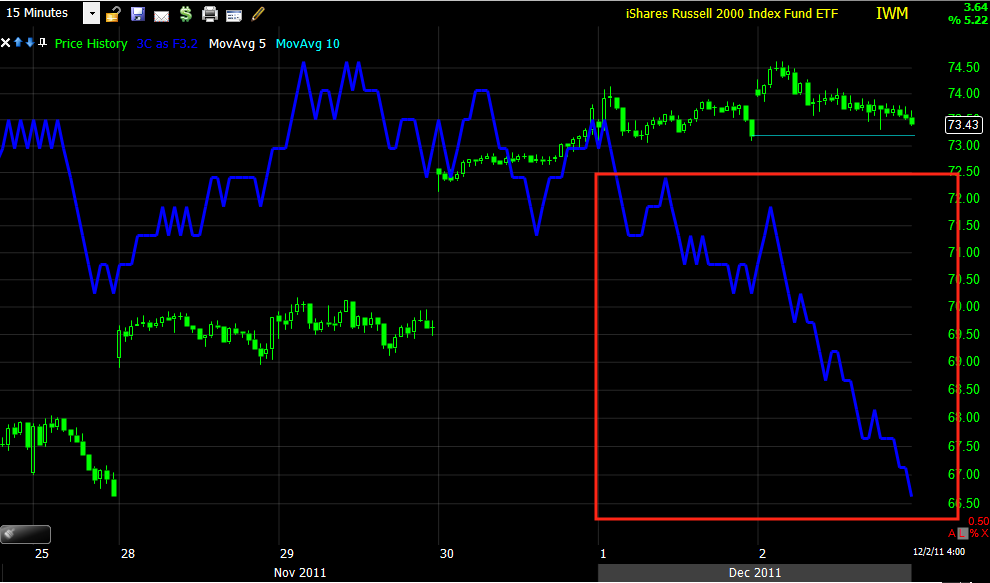
 The 15 min chart is a disaster and one of several charts that have given me the confidence to hold and add to my shorts in the MP.

 Close up of this morning's 1 min QQQ negative at the a.m. highs and looking like the market wants to roll over in a "U" shaped pattern.

 The 2 min is not only not in confirmation and leading negative, but moving lower as well.

 Close up zoom of the 2 min QQQ

 The 5 min is leading lower.

 The 15 min is negatively divergent in the Q's

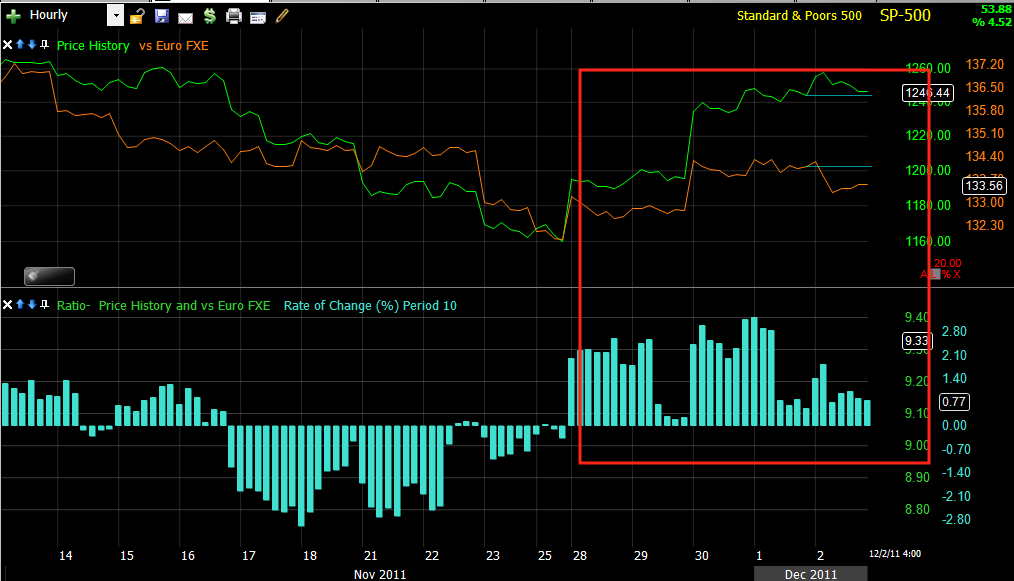
 And the hourly chart gives you the big picture from the July crash lower until now at leading lows well below the Aug/October lows.

 SPY close up 1 min of this morning.

 The 2 min is leading negative very badly and moving lower as well on a relative basis.

 The 5 min SPY is leading negative very badly.

As is the 15 min.

The market is just starting to roll on increased volume. I'd be on the lookout for that Harami confirmation today. If that confirmation candle is put in, you may not get a chance to add in this area.