Monday, September 15, 2014

Daily Wrap


Today while we have evidence of the base building for a short term oversold bounce expected for this week in our The Week Ahead Friday forecast for this week as well as Friday's Important Market Update. Today high beta or momentum stocks took the NASDAQ and R2K down, Energy was the leader.


The major averages today...
 The major averages on the day, there was one attempt to squeeze, but not much came of it at 2:30.

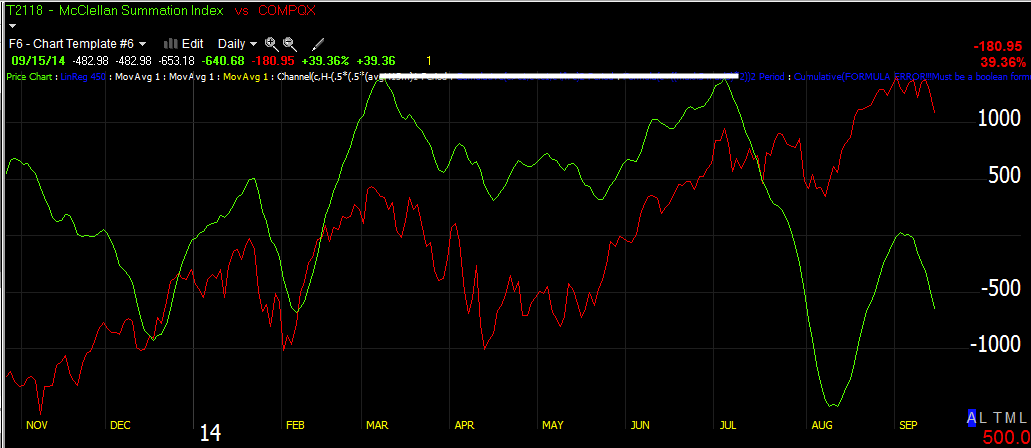
The MSI saw a modest attempt at a short squeeze as momos were hit hard

Right around 2:30 vs the SPX (green).

One of our favorites, NFLX was down nearly 4% (I already filled out the core short here), FSLR got hit, bio-techs were hit with our BIS long (or Biotech short) and PCLN which I think is pretty close to a bounce finally as it put in a hammer candlestick on the close.


NFLX...

NFLX daily which we saw a lot of weakness in last week...

This is a Sept. 4th post, NFLX Looking Very Ugly Here


"I think NFLX is probably pretty close to as good as it gets in this area as a short set up, I've been watching all day and it just keeps looking worse and worse...I'd consider NFLX a short here as a position trade, I'd want a pretty standard stop on it, like I said at the top, one of the sharpest head fake moves it has put in was about 7%, but again there have been multiple pivots with no head fake at all. I can live with a 7 or 8% stop here, it's actually pretty tame for a stock like this."


This is a follow up after the initial Trade Set-Up, NFLX Trade Set-Up Follow Up


"NFLX is one of the trade set-ups we've been waiting for, specifically a head fake move. I t appears there was one attempt, today looks clearly to be the second and today looks a whole lot closer. I feel pretty certain that the NFLX short (position trade) entry is going to be right in this area, the timing is the only issue now....NFLX (as a short) IS ALREADY THERE ON A STRATEGIC BASIS... the odds are VERY skewed in our favor for a very ugly move to the downside and a beautiful short trade...
Remember, I'm going to be looking for the 5 min chart at this point, but I think we are pretty much in the location as we have been for the past several weeks."

FSLR, another short position and Trade-Set-up, 
Down almost 4% today

We still have a lot of stocks on the Set-Up list and if this oversold bounce gets off, we'll have a lot more great entries, but most all of these, even FSLR and NFLX are still in excellent shorting position, although I would NOT chase them.

Earlier AUD/JPY correlations broke down...

 Earlier ES / AUD/JPY correlations fell apart later in the cash session, others like NQ /NASDAQ and Russell 2000 futures looked like this...


R2K vs AUD/JPY.

It seems all JPY based carry correlations are breaking down, although it's just the first day of the CME's rule 575 for HFT abuses, I have to wonder how much of an effect it may already be having. I don't want to blame the small cap and high beta / momentum meltdown on it, but I'd think those would be obvious victims of the loss of manipulative practices such as quote stuffing.


I wrote about TLT looking as if it's going to make an upside reversal soon, we'll update it tomorrow, but we saw a little ground gained in T's and divergences there looking better.

TLT 5 min positive divegrence after a negative divergence leading to a pullback we were looking for...from Sept. 11, Quick TLT Update

As for a Dominant Price/Volume Relationship today, there was none, Close Down/Volume Down was the closest with Close Down and Volume Up the second place, Close Down Volume Down I call "Carry on", it doesn't have any strong implications for next day trade, but Close Down/Volume Up is a 1-day oversold condition and usually closes higher the next day, the problem was it wasn't dominant, it was co-dominant today.


Of the 9 S&P sectors, today was better than Friday with 4 of 9 green with Energy leading and Tech lagging. On a 5-day basis, 8 of 9 S&P sectors are red, another oversold indication.


Of the 239 Morningstar Industry/Sub-Industry groups I track, only 50 closed green today vs 37 of 239 on a 5-day basis, again another deeply oversold breadth reading like we saw Friday, although not as bad.


Finally as I mentioned I'd follow up earlier, with all of the charts of breadth posted this year and especially recently, it may seem strange that the SPX hit a new all time high recently, but you've seen the NASDAQ Composite's Advance/Decline line and how horrible it looks...


The NASDAQ Composite in red and its Advance/Decline line in green, which should be following price, instead it has made a series of lower highs as BREADTH are hard numbers of fact that don't lie.

To give some perspective to the NASDAQ Composite and this horrible A/D line, a full 47% of NASDAQ Composite stocks are down at least 20% or more from highs, the media's definition of a bear market and of those that are down, the average loss is -24%, NEARLY HALF OF THE NASDAQ COMPOSITE IS IN A TECHNICAL BEAR MARKET.


I've shown you the same deterioration in the Russell 2000's Advance /Decline line and for context, 40% of Russell 2000 stocks are down by 20% or more, a technical bear market with the average loss being -22%.


THIS IS WHAT I MEAN BY A HOLLOW MARKET OR A PIER THAT HAS HAD ITS PILINGS EATEN AWAY. Everything may look fine standing on top of the pier, but just below, a catastrophe of major importance is just waiting to happen, is happening.


The McClellan Summation Index is not only back below zero, but at a huge divegrence.

MCO at a horrid divegrence with the NASDAQ Composite and the other averages.

Stocks ABOVE their 200-day moving average took another hit today, not as bad as Friday, but just more deterioration as the market crumbles from under the averages.

% of NYSE Stocks ABOVE Their 200-day Moving Average which declined from the red trendline Friday, but in a huge divegrence otherwise for 2014. This is worse than the 2007 market top.

The % of NYSE Stocks ABOVE Their 40-day Moving Average took another hit today moving down to a slight 34%, only 34% of stocks in the NYSE are above their 40-day!


It was the momentum stocks hit hard today and in general. The % of NYSE Stocks Trading 1 Standard Deviation ABOVE Their 40-day Moving Average are now...

 were at 20% Friday, now at 15% and moving in on the August lows for both breadth and price (SPX in red), this while the SPX is still elevated meaning the potential damage could be catastrophic.

The higher Beta/Momentum stocks, The % of NYSE Stocks Trading 2 Standard Deviation ABOVE Their 40-day Moving Average,,,
A mere 3.76% of the market!!! They are also at the same lows that caused me to issue an emergency post July 31st looking for a corrective oversold bounce, but that was after a stage of decline, we are still in either late stage 3 top or very early stage 4 decline.

While I stand by the "Week Ahead" forecast for an oversold bounce somewhere along the lines of last Wednesday after seeing deep deterioration in Tuesday's breadth, but slightly longer, I do NOT see anything like the August cycle.


This market is ready to crumble which is why I have been saying recently that it's time to really consider taking positions and getting your short position coverage and weigh that with the best entry or top-ticking the market. Look at NFLX today, while we hoped to get a head fake move, I filled out that position for this very reason and this is why I have brought the issue up so many times recently, there's a trade-off between top-ticking / getting the best entry which I'll always look for and a stock that has been a long time favorite short like NFLX which is already in the zone and deciding between a possible entry several percent better or missing the trade, I chose to fill it out at full size while others I'll remain patient with as they move in the right direction like COF today.


While I think it's important with stocks like NFLX that look horrible on our charts to try to get the best position  within reason; when you see the walls of the market coming down all around you there's a cost to not acting or trying to top tick the market.

Just remember, all of these stocks on our watchlist or open positions are in a great area no matter what, even NFLX down 4% is still in a great area. Also remember, there's a bus every 15 minutes, don't chase.

I'll have more Watchlist set-ups and updates tomorrow as we also keep an eye on a potential bounce that I talked about Friday for this week, I'm thinking somewhere in to or around the F_O_M_C. Otherwise, I'm already loaded for bear, if I can add a few choice positions here or there, I will and of course I'll continue to call them out as I see them for you.


Leading Indicators Not Giving Away Much Short Term

Of course longer term we've been watching these deteriorate on a near daily basis with Credit being one of the best leading indicators (High Yield) other than actual market breadth which has been incredible, this is why you have to look everywhere to put the objective pieces of the puzzle together, one week a carry trade might tell you all you need to know and like last week, it suddenly stops working and there's something else giving you clues. As I said, not much from Leading Indicators yet, which I'm taking as a "yet" rather than the probability that there will be no bounce, but that possibility has to be considered as well with the amount of damage in the market.

This is part of the new Indicator I'll be adding to the Leading Indicator layout, it's VIX Inversion on the bottom, the red bars are a bullish short term signal, but it's not as simple as interpreting any rising signal as being bullish, it matters where the market is, what stage and much more. VIX Inversion is pretty close to 1 month highs so there's some concern out there.

There's also a Russell 2000 / S&P-500 ratio (cumulative) indicator in the middle (red), which is read much like RSI divergences. To the far left when VIX Inversion gave a signal (red bars) you can see the r2k/SPX ratio making a positive divegrence rather than confirming a new low. We already knew by this point to expect a bounce, in fact we suspected in July 31st as the SPX closed down 2% on the day and had already moved some positions to take gains on the decline, so we had a pretty good feel on 7/31, we saw accumulation on 8/1 so these signals are just more confirmation.  To the far left, while VIX inversion is near 1 month highs, our R2K/SPX ratio is still confirming a lower low and thus not giving us the positive divegrence in 3C for some of the averages today as was expected Friday afternoon during the market hours and after market in the Daily Wrap post once I looked at the closing internals. This may be because it's a smaller breadth based indication for this week rather than a larger base being put down at the right spot, after some decline (as we could argue the SPX is currently stage 3 or starting stage 4). This is what I mean when I say these are not as easy to read as just seeing a higher VIX Inversion and assuming it's bullish.

Just as HY Credit Flows (in and out) gave us a hint (with inflows in to early August) that there would be a bounce as these small in flows were the equivalent of our piggy back longs (rising the trend or bounce, but in a smaller, more speculative way) and just as recent huge outflows from HY the last 2 weeks are telling us something about how smart money views the market, the SKEW Index has given similar signals, but again they can't just be interpreted like Stochastics overbought/oversold signals which I think are a very poor way to use Stochastics.

For example...
The SKEw Index (the Black Swan Indicator) had seen a VERY rapid rate of change to the upside vs the SPY (red) in June and stayed elevated (meaning there was a strong bid for deep out of the money puts, as if smart money was either expecting a market crash or they were holding enough long positions that they were hedging against a possible market crash as SPY was at a pivot new high).

Note SKEW, just before the end of July, started to move down pre-emptively BEFORE the SPX and reached a level below 130 , while still elevated it was out of the very dangerous zone  as if smart money knew a bounce was likely. At the same time in the white box the SPX was making its stage 1 base from 8/1-8/8 and as it started moving up on 8/11 to stage 2, SKEW also went higher, except this time SKEW is was not as high as the former range, even though SPX prices were higher. 

This can't be interpreted out of context. While the market moved to a higher high and SPX 2000, it appears there was much less long exposure which means SKEW or deep out of the money put hedging wouldn't be as necessary.
For example, there was a large relative negative 3C divegrence in to July and a stronger Leading negative divegrence in to late July where the SPX had made the last pivot high (#1 in the yellow box). 

You'll see the white accumulation period the first week of August in 3C, still not large and the move up to SPX $2000, however look at the leading negative 3C levels at #2 vs #1 even though #2 is a higher high. This would mean there was less smart money exposure to longs and less need to hedge using deep out of the money puts. BREADTH READINGS VERIFY THIS INFORMATION. 

The simple point is these readings must be taken within context of all the information we have, not as stand alone indicators.

Back to Leading Indicators...


 Intraday today, while we know the 3C chart of HYG repaired some of Friday's damage to a nearly week long positive divergence in HYG, which could, if HYG moves higher, be the lever or manipulative ramp that the market needs for the bounce I forecasted for this week as of last Friday. However, comparing actual HYG (blue) price today vs SPX (green), we see that HYG , while moving in a similar direction, was lagging the SPX, leading me to believe that the accumulation/base area started today for the oversold breadth bounce from Friday's "week Ahead" post, is likely not finished, which also means a call/long position may still open up with much lower risk, a better entry and timing. However the major trade is still shorting our Trade-Set-ups in to higher prices and weaker underlying (3C) trade; this is the trade of highest probabilities and the reason I'm not letting go of any of my core short positions as things get more chaotic from here.


 The longer term HYG/SPX chart which you have seen many times shows why  I love HY Credit as a Leading Indicator as not only did HYG bottom on 8/1, while the SPX bottomed 8/8, HYG also transitioned to stage 3 (from the yellow hash mark on the left to the right ) before the SPX (orange hash mark from the left to the right) and  HYG transitioned to stage 4 decline first as well at the first red arrow and a case can be made for the SPX in stage 4 decline at the red arrow on the right.

As for a bounce, HYG seems to be leading there as well, nearly a week ahead of the SPX. However the bigger picture or totality of this chart should show that HYG is done despite any potential bounces, the damage is done and it's next major move is to a new lower low which will change its trend classification.

Intraday though, no leading signals except perhaps that the market pulls back a bit toward today's intraday lows and tries to widen today's basing activity which I'd think it would need to do to break through the SPX downtrend channel since last week.

Afternoon price action in the SPX, NDX, Dow and R2K was given away by the NYSE TICK Index as well as potentially some of the leading indicators.

This is why I encourage you to watch intraday market breadth via the NYSE $TICK Index as the channel I widened out for the afternoon uptrend clearly made a series of lower highs and ultimately broke below the channel, giving advance notice that this was a probability for the market as we saw in to afternoon trade.


 Our professional Sentiment Indicators have been very negative with a couple of 1-day leading divergences last week, but all in all the sentiment indicators (blue) have been moving in a downtrend with the SPX (green) and at every point where there's a divegrence between the two, out Sentiment indicator's divegrence has been right (yellow boxes all show sentiment diverging negatively from price and sending the SPX lower).

Intraday there was no edge here at all, the indicators were in line with the SPX, which in and of itself can be slightly short term bullish for the SPX as they were NOT leading negative today, but in line.


 Here's the bigger picture of the Pro-Sentimanet Indicator in blue vs SPX for the August cycle. Again  the leading indicator bottomed first, took off to the upside first, went lateral/stage 3 first and started leading negative first and continues to lead sharply lower.

DON'T LET SHORT TERM SIGNALS GET YOU LOST IN THE LINES, UNABLE TO VIEW THE BIGGER PICTURE OR HOW THE SHORT TERM IS BEST USED TO ACCOMPLISH STRATEGIC GOALS FOR THE BIG PICTURE.

 Short term VIX futures were leading the SPX and outperforming today, in line with some of the VIX inversion we saw above. Typically VIX and VIX futures (blue) move opposite the SPX (green), instead today they showed a solid bid to the upside. To give you an idea of the outperformance of the VIX futures vs the SPX I flip the SPx's price. When I do this, VIX futures and SPX should move exactly together.

Here I have inverted SPX prices for the day and left VIX short term futures (blue) normal, as I said, normally they should move exactly together in this instance instead we see VIX futures outperforming in the afternoon substantially.


 While Yields have been out of whack recently, we have used yields as a leading indicator as the market tends to be pulled toward them like a magnet short term. "IF" the former correlation has returned, then this chart would suggest the SPX (green) should bounce toward yields (red) in the very short term.

As for High Yield Credit (not the same as HYG and not used to manipulate algos like HYG), it has been retreating and confirming the SPX downtrend. HY Credit is like the NFLX (momentum play) for smart money. When they are in a protective mode they sell HY credit and rotate to investment grade much like stocks would rotate to bonds. This HY credit (orange) vs SPX shows a confirmed downtrend, however once again, for a short term bounce, although I'd like to see leading indicators lead, they may be too locked in to the bigger picture as (I already mentioned) , the market may already be in stage 4 decline.

Commodities seem to have reflected weakness in China and Europe that we are just starting to really see the extent of recently. However there may be a bounce there as well as a base like area looks to be under construction.

Again, I don't expect any bounce to be anything like the August cycle, more like last Tuesday's deeply oversold breadth and Wednesday's following close higher, but a bit larger than that.

More coming....

Market Update

So far everything we saw last week and especially Friday with The Week Ahead post and confirmed with Friday's after hours, Important Market Update , appears to be working out.  By now, the Dominant Price/Volume Relationship Scan should have proven its worth as a forward looking leading indicator as it has been spot on every time we've had a dominant P/V relationship among the component stocks that make up each of the averages.

While the Most Shorted Index continues to languish, the averages themselves have worked all day toward a short term positive divegrence and HYG has repaired itself. If HYG had more beta or a more liquid options chain, I'd probably take a call position (weekly expiration, likely next Friday as I prefer a lot of time) out, but it doesn't have the kind of leverage ability that I prefer.

As for the averages and a call position or day trade, knowing the probabilities for a short term trade and having a high probability low risk entry are two different things,. Being any such trade would be very speculative, I'd want a reduced premium with a sharp intraday move below today's intraday lows with confirmed 3C positive divergences on that move and I'd likely use calls to get the kind of leverage needed to make the trade worthwhile. beyond that, I'm not moving any of my core short positions, they can handle any short term possible draw down from an oversold bounce and they are aligned with highest probabilities, with breadth as bad as it is, the market becomes as unpredictable as that pier with the rotten pilings supporting it.

So far...
 SPY has a 1-day positive put to about 10 min, not particularly sharp, but it has progressed.

 The Q's are at about 5 min, note the pullback around 2 p.m. and the accumulation of it. This is the kind of move I was talking about above, but sharper, the kind that moves sentiment and gets longs scared.

 IWM's divergence has made it to about the 10 min chart today, I marked where the divegrence first started, so we should at least hit $115.50 as that's the minimum 3C forecast where the divergence first started.

 The DIA has a 15 min chart that has already put in some work, although it saw very sharp distribution, we're still only looking for a near term move that changes sentiment and gets bulls buying and the SPX's downtrend I've pointed out would be the most obvious target, although the head fake move we have waited for for sometime could be hit if the F_O_M_C initial knee jerk were to the upside, remember the initial knee jerk is almost always the wrong direction and is faded.

 The Custom SPY/TICK plot shows the improvement in breadth today, especially from Friday.

The NYSE TICK intraday has a wider channel now, although in yellow it is threatening to move lower which I'd like to see both for our bounce  and entries in trade set ups and for any potential short term day trade or short swing long (call options).

Note breadth isn't that much improved with very few spikes > +1000 so I'm not sure how much the EOD breadth charts will have moved after being slaughtered Friday.

I'm going to update Leading Indicators next before the EOD just so we have a more solid feel for what's happening.

Trade-Set-Up: (Long-Term Trend/Position Trade) GM

GM isn't the kind of stock I'd normally consider to be part of my "Short universe" off the top of my head, but looking at the beta, I would be wrong to make such an arbitrary opinion without having first gathered the facts.

We might as well get it out of the way upfront, if you are short GM when it goes ex-dividend, you are responsible for paying the dividend which sounds kind of scary, but in reality the dividend yield is 3.60% (divide that by 4 quarters) and that's what you pay per quarter to hold GM short. If I can't do better than 3..6% on a short position, I don't want to have anything to do with it, but it's just one of those facts that you should be aware of.

As to why GM is getting interesting...

 Just looking at a 2-day chart of GM, you should be able to identify which stage we are in within the multiple trends on this chart. The red arrow was a decline trend, white is a base as the market discounts 6-12 months in advance, with homebuilders around 2000 we saw discounting even further out. In other words, just like with earnings,  everything is perception, it's not what you did or what you are doing, but what you are expected to do and if this is the best you are expected to do, then the perception is negative and discounting kicks in. 

Following the 2011/2012 base or stage 1 accumulation a mark-up/rally stage 2 trend is clear at the green arrow and from there a largely lateral trend is visible at the ornage arrow which is stage 3 top / distribution. If you look at volume levels with associated stages you see capitulation at the end of decline and what looks like exhaustion/churning near the top of the rally. This is one of the few stocks that saw volume increase at stage 2 as it should, but QE has made volume irrelevant the last 5 years, but it will matter again as the F_E_D exits accommodative policy which includes rate hikes.

With rate hikes, an economy that never healed is going to be under significant pressure, but it's not as bad as run-a-awy inflation so the cost of financing a vehicle will surge as well as the general economy deteriorating.
 My custom Trend Channel stop system (5-days) holds the entire stage 2 mark up without a single stop until the red arrow.

Since that stop in the Trend Channel, GM is down -8.3% which isn't the point, the point is sometimes you can get slightly better prices after a Trend Channel stop out, but it's largely luck and most of the time, you are better off taking the gains and looking for the next trade.

 This is a custom indicator you'll see more of, especially in a bear market with counter trend rallies which are some of the strongest. This is what I've been working on recently with a few other confirming indicators. This is signals of VIX inversion between the 1 and 3 month VIX. USually I have the SPX above as a comparison symbol, however I've replaced it with GM, but you can see the same buy signals (red) at VIX inversions work for GM as most stocks follow the market directionally, so quite a few VIX inversion buy signals have coincided with pullback lows including the most recent August cycle from a deeply oversold market (breadth) in early August. Other confirming indicators include an SPX to R2K ratio indicator, like a cumulative line that helps verify a real break lower vs what is likely a bounce area as it did right at the July/August lows before the August cycle/rally. You'll be seeing these more and more as their signals become more relevant, but they should be especially useful in catching strong bear market counter trend bounces/rallies which are some of the strongest rallies you'll see. Take a look at the first counter trend rally after the Dow's 1929 break, nearly a +50% gain on a bounce!


 This particular chart is showing what we only recognize in retrospect, it's just before the Trend Channel stop out, but looks like a large 15 month H&S top and while you could get lucky and catch a decent swing higher, for the most part this chows how lateral the overall trend is as it starts and runs through today with a -3.77% loss, or in other words, almost flat vs stage 2 mark-up which was a gain of approx. +120%. Quite simply this is more evidence of where we are in the cycle, which stage so you know where you are on the map and what comes next (stage 4 decline).


 Here's a rough estimation of the H&S top, it can be drawn a few different ways, but I matched this trendline with breaks and volume spikes on those breaks below the neckline so I think it's a pretty good trendline, although it's a little bit of a matter of semantics, the H&S is clear no matter where you draw the neck line.

I've highlighted the dividend yield here as well.

This is Money Stream which I'm using for confirmation, one of Don Worden's final Money Flow creations and a great broad indicator, although details can sometimes be lacking. What we see is confirmation of all of the trends including the base/accumulation and distribution in to the H&S top with a leading negative divegrence through 2014.

 The 2-day 3C chart shows much the same with accumulation at the 2011/2012 lows, confirmation on the stage 2 rally and a leading negative divegrence in to the 2014 portion of the H&S top formation.

Being we have distribution confirmation and good staging confirmation, at this point the strategic probabilities are solid, now it's more about a good tactical entry with low risk and an excellent entry point with good timing. As you saw with the VIX inversion Indicator above which draws no signal from GM or even the SPY, but it does do a good job of showing VIX inversion and how that correlates with short term pullback lows or buying areas, we are really seeing the majority of stocks (usually about 66%) follow the market's directional lead, although as you have seen with breadth and I'll expend on later today, there are more stocks right now in an actual bear trend than you might think which is causing the market to become very fragile at these highs so the market timing itself will have a strong pull on GM and I wouldn't be surprised if we identify the market pivot to stage 4, which we may have already entered or will this week (that downtrend is pretty good evidence to make the case that stage 4 is already in effect). The point of the VIX inversion signals is that they are the same for GM as the SPX, just showing that GM is likely to move with the broader market as most stocks usually do (although breadth which has been falling apart all of 2014 took an especially hard hit as soon as Q2 Window Dressing ended on July 1st).

  The 2 hour 3C chart confirms what the daily and Money Steam show, distribution since the head of the H&S pattern with a leading negative divegrence. I can post another 4 charts, but they'll all show the same confirmation.

So near term as we follow this week's market expectations and GM which has already started a bounce today, up +1.2% and above the neckline today, the 10 min chart shows distribution sending GM lower and below the neckline and very recently two accumulation areas, although I suspect they are separate from each other and the most recent one to the right is what's most important.

This accumulation is no where near strong enough to overcome the distribution damage on this 10 min chart, much less the 2 hour and daily/multi-day charts, thus using price strength in GM to enter short positions will give us a better entry and lower risk in to a weak upside move that has a high probability of failure.


 The 2 min chart and accumulation from last week leading to this week

And very specifically, the intraday 1 min chart showing late day accumulation Friday in anticipation of today's move higher, often market makers or specialists who filled a larger order stocking up on inventory, in this case at low prices to sell in to higher prices before reversing and starting to short higher prices in advance of a move to the downside,  exactly what we want to do.

I'm setting price alerts for GM from here to the $35.25 level and will be double checking for distribution in to higher prices, looking for that entry area that will likely coincide with the broader market as well so I'd watch both of you are interested in a longer term GM short. the approx. price pattern based, implied downside target is about  $26, but these are often overshot to the downside as fear is a much stronger emotion than greed and it generally happens in about 20% of the time.


Market Update

I'll have a long term GM Trade-Srt-Up coming out in a bit for you, this looks interesting for longer term trend traders.

As for the market, it's putting in the work for a short term divergence (positive) along the lines of last Friday's "Week Ahead" post and the EOD market update post, a short term bounce based on an extremely oversold market and I'm not talking about price or indicators, I'm purely looking at breadth which has been spot on.

In any case, as assumed earlier today, I don't expect much action today, mostly lateral (sideways) chop which is the base that this oversold bounce can move up from. I'm not talking about the kind of oversold bounce that created the August cycle and rally, but this is also bigger than last Tuesday's oversold readings leading to last Wednesday's 1-day oversold bounce. As I said earlier, "maybe" it could be the head fake move I generally look for, but only because HYG is there, the market itself doesn't have enough to get off its back without HYG.

I know some of you would like to put in some day trades or very short term call option positions, I don't think we are at the point in which that will make a whole lot of sense yet and I'll show you why.

 This is the 1 min SPY, not a strong chart at all, the weakest in fact, but all new divergences have to start somewhere and we can see today specifically there's some positive activity with a leading positive divegrence at the lateral range.

 If the divergence is strong enough, it will migrate to longer timeframes, like this 2 min chart, still a very weak signal, but it's building for the kind of support the market would need to pull off the kind of oversold bounce talked about Friday.

 At the 3 min chart the 3C and price downside are confirming each other, but today we see a break with a new higher high in 3C on a 3 min chart so there's migration or  of the divegrence, again nothing like early August with a 7 day base and strong divegrence, but along the lines of what would be expected from Friday's analysis.

 The Q's don't have a huge divergence, but they are working with a positive now out to the 3 min chart and notice price pulling back, they'll try to accumulate at the lowest range and that's why I wouldn't put in any long short term trades yet because there's a good chance they have to run this a bit lower to hit new stops and create more supply to accumulate.

The IWM is also at about 3 mins so there's confirmation in the major averages, there all at about the same place as they work toward a base large enough to support an oversold bounce,  but in my opinion, there's always a reason for doing what they do, it's not just oversold because who cares? An oversold or overbought market can stay that way for a long time, this is strategic and tactical planning. The bounce has to achieve something to be worthwhile, they don't run random bounces or head fake moves, they are all meant to achieve something and usually it's the opposite of what you might expect by looking at price action alone.

 In this case, whether or not the head fake area, "Igloo with a Chimney" can be hit is debatable, although the head fake move before a reversal (downside in this case) is seen almost 80% of the time, it's still a pretty tall order, but with a F_E_D knee jerk reaction, who knows, it's certainly possible.

I do see this channel which technical traders will have already drawn trendlines on, as the minimum upside target. To get bulls to move at this point a technical barrier has to be broken and it's right around $200 or SPX $2000, both psychological magnets. I suspect that's where our bounce is headed to.

However look at where price is in the channel relative to the lower channel...it hasn't quite hit that area so a move a bit lower tagging some more stops or bringing in some more shorts will create the kind of supply they need to accumulate enough to move the market.

I'd also use a break above this channel as a minimum target and timing element for a downside reversal, the upper target would be the head fake move or a new high above the rounding top of the last several weeks. Either one is likely to be a downside pivot as breadth is so destroyed, you can buy all the HYG in the world and it's not coming back. I'll have some stats on that later as pretty close to a majority of stocks are in a bear market already.

Watch the intraday NYSE TICK chart for early signs of a trend reversal intraday for the market, like a break below the channel, which is starting to build so I'd expect the SPY to come down soon from current levels.

As for the Most Shorted Index, it tried to help late Friday, no squeeze and today is underperforming.
 MSI vs SPX, tried late Friday, no squeeze and underperforming today.

HYG however has seen some repair today. After 9 days of trending lower, the last 4 days across (lateral) are not a mistake, not by chance or coincidence. Note the repair in the 3 min 3C chart. Still not a strong divergence on timeframes, but a pretty decent size as far as time so this is the main market support.

I'm not CRAZY about any short term longs/day trade longs, but if the set-up is there, I'll post it. You have to remember you are trading against probabilities in that case and they should be short term and considered VERY speculative. The safest, most effective trade set-up is using any price upside to short in to as we have a lot of trade set up targets/posts already out there. I'm going to add GM shortly.