
After the short term positive divergences started to form on Wednesday (and I think Wednesday was more of a handbrake kind of day with the positive divergences halting the early downside momentum of Wednesday and the last hour of Tuesday) and then more cleanly on Thursday, I wrote that I thought we would see a sharp bounce, but short lived. There simply wasn't a long enough accumulation period to provide for much more. Usually for a swing type move of a week or so, there needs to be at least 3+ days of solid positive divergences and reaching longer timeframes. Last week's positive divergence was sharp, but there's only so much that can be accumulated in a day or a day and a half without moving price against the position.
Friday we saw the bounce start, except it was underwhelming and the NASDAQ and Russell 2000 didn't participate, this is not what I expected to see, I expected a sharp move, but brief. The only thing that was there as expected was the negative divergence in to the Dow and S&P move as well as ES which started again with that persistent negative divergence (nearly a diagonal line straight down in to Monday/Tuesday's move up. I will say it again, this is rare, especially on 3c/ES.
As a matter of fact, in one of the last Market Updates Friday I started the update with the following,
"This is a very tough call to make here, especially when there's negative divergences as suspected and expected in to any kind of strength, but I was clearly looking for a more spectacular bounce."
I also noted the triangles in the IWM and QQQ with the following comment under the chart...

And ended the update with,
"I really expected a stronger much more impressive bounce."
This is one of the reasons I waited on taking a new position in AAPL after having closed a Put position earlier in the week for about a 12.5% 1 day gain. Just before the market update was the AAPL update in which I showed this chart with the following comments...
"I'm pretty conflicted on AAPL, the NASDAQ and IWM haven't bounced, obviously AAPL is hurting the Q's today."

So I decided best to wait as AAPL was showing a positive divergence, it took a huge beating since Wednesday and it packs a lot of influence over the Q's which were in the same triangle formation as the IWM posted above.
As mentioned last Sunday, today the official Chinese Flash PMI is coming out. It's no secret that China is very opaque with everything data related so I suppose it is not surprising that the Chinese Flash PMI contradicted the HSBC Markit Chinese Manufacturing PMI and in a big way.
The HSBC/Markit PMI for China shows a 4th month of consecutive contraction in the Chinese Manufacturing base. Again it should not be surprising that the official Chinese PMI data shows 3 months of consecutive expansion. China's release today says 53.1 (above 50 is expansion/ below 50 is contraction), while HSBC Markit contradicts this with last week's release showing a contraction to 48.3. HSBC's data suggests China's first quarter Manufacturing PMI was the worst since Q1 2009, obviously this conflicts with the official Chinese release.
Here's a historical chart of the HSBC data vs the Chinese PMI data.

Whatever the truth may be, the effect of the Chinese data has sent Futures higher, which is more in line with what my original thoughts were regarding the bounce, sharp, but brief with negative divergences/selling/short selling in to the move. As noted from Friday, the action on Friday WAS NOT what I expected to see, the opening in ES is more in line with what I expected to see and thus far, although it is early, the 3C reading so far is what I expected to see, kind of "The second verse, the same as the first", referring to the same type of action on Monday/Tuesday of last week. The difference though is Monday and Tuesday's negative divergences did some serious damage so this bounce is in to a lot less support.
Interestingly, and this is the one chart I wanted to include in the Market Breadth update but didn't, although I do believe I touched on the increasing ratio seen through this year, sometimes a picture really does say more then words.

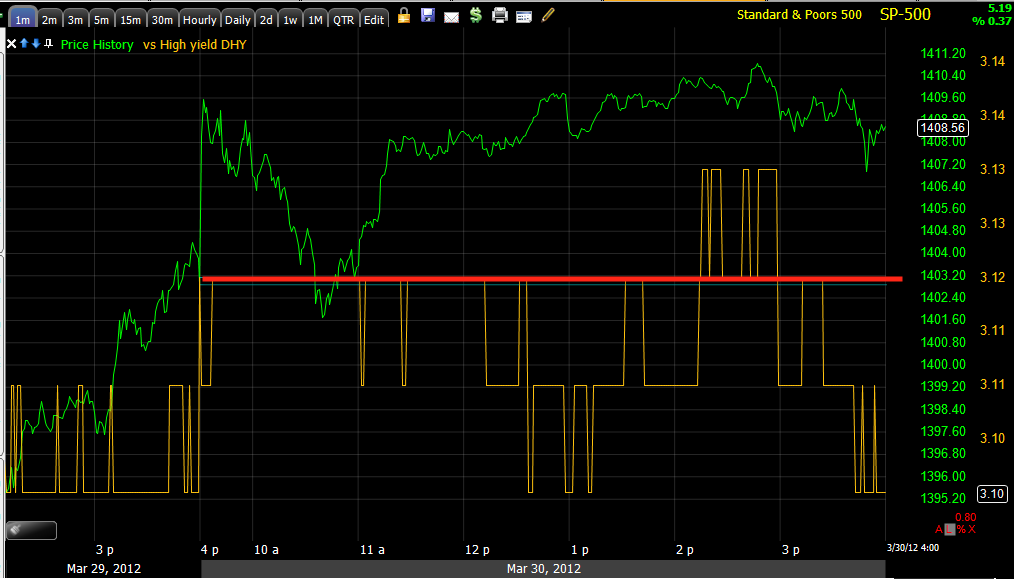
In any case, the 3C charts from late Friday are linked above, here's what Credit did Friday afternoon.

ES, although having popped on the Chinese data is doing exactly what it did almost the entire day Friday (save for a small positive divergence toward the end of the day) and throughout the entire Monday/Tuesday bounce after Bernie's pre-market speech; they are leading negative in to the price strength, suggesting a repeat of Monday/Tuesday and selling aggressively in to any strength and hitting new lows. It is interesting that there was brief accumulation late Friday, it appears someone may have been front running the Chinese PMI data, I'm not sure how friendly China is with Wall Street, but I don't think there's anything that would stop a Chinsese official privy to the number from putting on a trade.

So this is more in line with what I expected and makes sense with the AAPL divergence and the triangles in the Q's and IWM, plus it's what I expected Thursday.
Here's the SPY as of Friday's close and showing the positive divergence we saw last week.

As of right now, there's a little slippage in ES, a little decline, it's off the opening highs as I'd expect from profit taking, but I think it should hold up overnight which with continued negative divergences like the one seen above, should set up some very nice opportunities.
Have a Great Week!


