Friday, April 12, 2013

Accumulation in GLD/SLV

That's the question today as they have fallen hard, the answer is yes, but it is like dead cat accumulation, no serious move is going to come from 1 day of accumulation or a half day.

Going to Wait on XLF Put

As much as I'd like it, if the trade isn't coming to you on your terms, there are many others out there. Who knows, it's still possible

AAPL

I knew I should have bought next week's expiration, I always say (buy twice the time you think you need), but I wanted to see what would happen with today's expiration, expecting the move by now, but it sure looks like it wants to pop in the short term,

 1 min looks like it's busting to go

 3 min

5 min and such a flat range

GS Charts

This is a core position, meaning it is considered a longer time frame trade.

 This is the long term 2-day chart showing distribution in 2007, accumulation at the 2009 lows, distribution in to the 2010 highs and currently with the last run having no significant accumulation period.

 The X-over Screen has given all 3 signals short/sell

 The Trend Channel broke down at the same time as the market, this is what typically happens after, volatile chop before a drop, but there's a definitive change in character and thus the trend is over.

 Using a roughly thrown together Linear Regression channel, there were 2 channel busters, they seem bullish as they breakout of the top of the channel, but often lead to reversals, the first wasn't that big, the second was bigger (with distribution) and now we are kissing the channel good-bye.

 The 4 hour chart with different accumulation/distribution points, this is the largest leading (negative) divergence on the chart

 The 2 hour looks almost exactly the same-good confirmation

 The 60 min with the trend confirmed and then negative

 30 min

 Now from the faster charts, 1 min

 2 min isn't playing along

Nor is the 3 min.

I like GS short here, I'd give it a little room on the stop or to add to, but I like it.

Will Also be looking to open an XLF Put in to upside momentum

Since most options are closed now, the market is free to move. I've been looking for upside momentum to enter an XLF Put, expiration May monthly and in the money a little, not sure exactly.

Also hoping to cash in on AAPL calls from today

GOING TO OPEN 75% CORE POSITION IN GS SHORT

This is an equity short, I'm leaving some room to add or in case I want to use it on the stop so the position size will be 75%.

I'm getting the charts together now, but wanted to get this out ASAP

Leading Indicators

As suspected, VXX was used earlier today.

Here are a few...
 First commodities gave a clear signal earlier in the week that they  went risk off, what made it stronger was the $USD was favorable for commodities gaining ground so that was a clear signal.

Today's collapse is something else.

 We've been looking at High Yield Credit very closely, I figured , lets back up, note the divergence in to the 2007 top, since then HY hasn't surpassed even the area of the 2007 top, it's weaker which is to be expected when the market is built on the sand with playing cards from F_E_D candy.

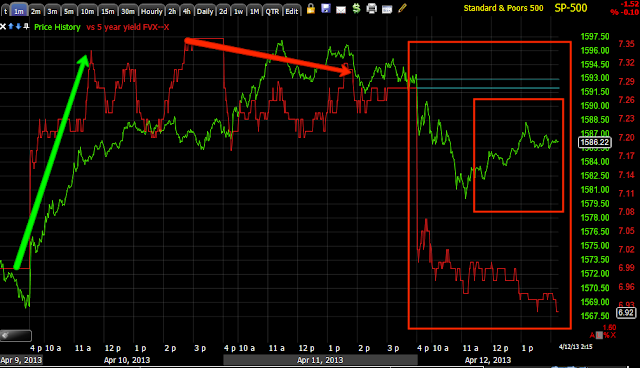
 Yields (along with Treasuries -they move opposite) were favorable in green, went negative against the market in red and are leading negative as there's a strong flight to safety today.

Yields are like a magnet for stocks.

 If that's so, then this spells trouble, the longer term yields which already broke to new lows for the year, the yellow area is where the market broke the trend channel and there was a significant change in character, Yields also went from not making a higher high in months to moving down.

 Recently the $AUD has been tracking the market better.

 Here it is today, leading the market lower.

 The Euro also use to have a very high correlation with the market, it did give warning in red at the top yesterday and was supportive this morning early in white,

 Here's the Euro on a longer term basis totally breaking down with the SPX, it's the same time as the Trend Channel being broken by the major averages, perhaps there's nothing wrong with the Euro as a risk indicator/leading indicator, after all I showed you last night and several times that the $USD has done the opposite of the Euro so it's not broke.

 The $USD moving down is supportive of the SPX as you see, but what happened the last few days? The market should move higher based on algo arbitrage alone.

 Yesterday the USD intraday was in gear with the market gains

 And for the week, the USD pullback has been supportive of the market, but the last few days something hasn't been right. I will look this weekend, but I suspect currencies are about to flip, the $USD back to its uptrend, the Yen moving higher and some others that won't be good for risk assets like the SPX.

 The Yen moving down is supportive of the SPX

 However recently the move has lost momentum, today it's going the wrong direction. Think about the Futures long term charts posted this a.m., it seems they know something is up.


 TLT today should have pulled back to the light blue arrow according to correlation, but it seems the flight to safety is that strong that it didn't.

 Here's VXX with a very sharp move down in the a.m,. sharper than the market would suggest, remember this is one of the levers. Now look at this.

Around 11-11:30 the levers were being pulled, Volatility was being used to help the market of its lows as you can see in VXX as suspected.

Furthermore...

 There's the short term distribution to send VXX down.

 Since then it has been accumulating again as the arb is not supportive right now.


As for Sector rotation, everything that isn't a Safe Haven trade is down today except Discretionary.

Futures Update

Not too much happening, it almost looks like 3C/Price pin action, very small adjustments on the intraday chart.

CONTEXT is at a negative 31 ES point differential, I have never seen it this high.

 ES almost perfectly in line

 NQ with some positive divergences and a leading negative starting.

TF also seeing a leading negative divergence starting

Looks Like We'll Get that Shot @ XLF Puts

I wanted upside momentum, especially when opening a put position, the more the better and I wasn't sure if we'd get it in XLF (I like FAZ long too, but as an equity, not an option trade).

Take a look... 3 simple charts
 2 min intraday chart, now that it is moving and leading, it and the 1 min can tell me when momentum is about to fade, that's when I want to enter the Put, as high as possible and right before momentum fades.

 The 5 min chart at the area suspected as a head fake area and the 5 min chart alone helps confirm that, I'm watching the green arrow area also for momentum intraday.

Longer Term, this is a typical cycle, or the 4 stages, 1) Base/Accumulation, 2) Mark Up/Price breakout and demand, 3) distribution and eventually top and stage 4) Decline, that's the lifecycle of assets, over and over and in many different timeframes.

In white we have large accumulation, they own the shares, they mark up price and demand comes in, retail gets excited especially with "New High" headlines and jumps in, then distribution at the red arrow, since the positions are so large they can't be sold in a day like we can without crashing the market, they sell a little at a time in to rising prices, the leading negative divergence usually suggests the shares are all gone and short selling is in effect, especially when the leading negative is below the accumulation area (white) and one of the last things we see 80% of the time before a reversal, a head fake move. Read my articles, "Understanding the head-fake move" linked at the top right of the member's site to understand why the head fake is so important and profitable before a reversal.

I like what I see, if you are interested in SKF long or FAZ (2x and 3x leveraged bear Financial ETFs), you might look at the signals for the options, the equity should be just as good if not a better entry at that point, but I'm glad we got some yesterday at better prices.

AAPL Option Call

I went ahead just to see, this is half the size of a speculative position. Strike is $425, expiration is today, I was curious.

AAPL intraday bounce

Of all the assets, I'd say AAPL has a better chance of a decent intraday bounce than most others, but I would not hold beyond intraday/today.

I may even try this, but spec , basically money you can afford to lose, if there is such a thing.

 1 min in line, we sold the puts at the perfect place, momentum and the lows. That red trendline will be very tantalizing to run stops on a head fake move (even intraday) before an upside move.

 2 min chart

 3 min

 5 min

That's the reason for an intraday trade, here's the reason I wouldn't go any further...

10 min chart.

AAPL still has a decent 15 min and a nice 30 min, it may become a nice trade to the upside, but I would not take that chance beyond intraday at this point. I think there's too much work that needs to be done first, LIKE GOLD, glad we didn't enter that right?


Important... VXX / UVXY as well

Some of you have noted VXX/UVXY are not moving as much as they should, here's most likely tour reason why, although I'll double check. I'll also post futures next.

 The 3 levers to move the market in the SPY Arbitrage model from Capital Context (and these are used by institutional investors, not retail) shows the 3 assets used to make the model and manipulate the market higher (TLT down, VXX down, HYG up) are in some combination or all are being used, this may be to effect the optimum Op-Ex pin level.

PLEASE DO NOT DISCOUNT THE FUTURES CHARTS IN NUMEROUS TIMEFRAMES I POSTED THIS MORNING (linked ) I have never seen so many timeframes across so many futures so negative. Remember a 1 min timeframe shows smaller bits of accumulation and distribution, but a 15 min shows large chunks, a 60 min even larger, we were negative through the daily chart (that's as far as I can go).

That is why CONTEXT for SPX futures (ES) looks like this..
There is now a negative 28 point differential between the model and ES, that means ES is likely 28 points overpriced vs the correlated assets that move with it.

Intraday Market Update

I know some of you are trying to play the long side of this and there are some charts that suggest you can for a while, but I would be remiss if I didn't show you their full context so this is a bit larger of a post than I wanted. I would be looking to sell strength more than anything.


 SPY 1 m in line

 Larger 1 min chart

 SPY 3 min leading negative, not good chances here, in red tops are a process, not an event like the green "V"

 Longer term 3 min is at new leading negative lows, be VERY careful day trading this

 SPY 5 min is approaching new leading negative lows

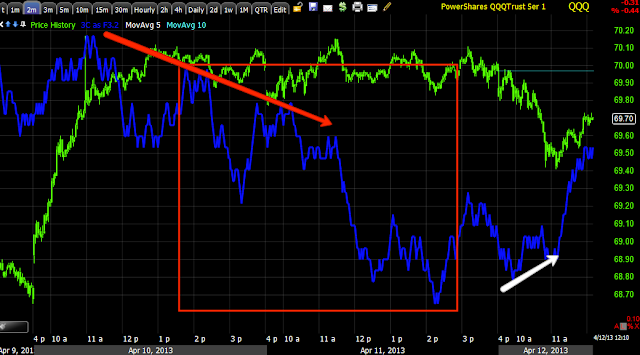
 QQQ 1 min with a positive and in line, but this is moving fast.

 Close up of 1 min QQQ today

 QQQ 2 min looks the best

 Yet remember this cliff, 15 min chart at new leading negative lows while prices are this high, not good.

 Longer term QQQ 15 min chart, does the yellow area around price look like anything to you?

 IWM 1 min positive-remember these are not real time as it takes time to put these together.


 IWM 1 min in larger view

 IWM 2 min

 2 min closer view in line

 IWM 3 min positive closer view

 IWM 5 min at new leading negative lows

This is why I said what I said about the Steam Roller, yes there's always severe volatility at reversals, but big risks as well

IWM 15 min

 I would be using some kind of intraday momentum indicators like these, momentum, RSI, MACD and Stochastics set to long 26/52

1 min view w/ Stochastics set to 100

You should also consider ROC on price, if you can't apply it directly, put an invisible 1-bar moving average on price and attach ROC to that, look for divergences in multiple timeframes.

Remember intraday traders watch the 50-bar 5 min chart as resistance and support, be watchful of that.

When you identify a trend on a timeframe, consider a 22-bar moving average as a stop