Friday, September 6, 2013

EOD Market Post

OK, my wife who has been in Hungary since March as many of you know, is now at the Miami airport and I need to get a move on to get through Miami rush hour traffic to pick her up so this will be my last post for market hours, I will have some posts up this weekend.

As far as the direction of 3C as it almost always picks up where it left off on the next trading day, even over weekends, there's every reason to believe now that we are through options-expiration market pinning, that we can move lower.

The charts suggest we will see downside come Monday and I have little doubt it will be the move to the lower end of the range.

Here are a couple of SPY charts I captured real quick...

 SPY1 min leading negative, price action should pick up Monday morning where it left off at the close Friday and this is a strong negative trend.

The 3 min leading negative. The longer charts are important for longer trends, but as far as what we expect to see starting early in the week (Monday), it's downside so hopefully our VXX calls do well.

I'll be back later, enjoy your weekend.

FSLR Update as a Market Example

Looking at FSLR, it makes perfect sense as long as the market is doing what is expected, a pullback to the bottom of the range followed by a strong upside move, that will be followed by a primary bear market move even larger.

For now though, FSLR looks to be a good barometer of market action in coming days.

 FSLR 10 min accumulation trend

15 min strong accumulation trend and head fake move that is in scale for an upside reversal within the next couple of days.

30 min chart shows the accumulation trend VERY CLEARLY, this is a strong long candidate.

60 min chart with a very strong positive divegrence and accumulation in all of the long timeframes.


 However in the intraday charts (where we'd expect that short term pullback), we have a negative and leading negative divegrence at 2 min

the 5 min chart is the transition period, charts before that are negative, after that positive, this means the expected pullback shouldn't be more than that as the 5 min is NOT negative and the expected move to the upside should be very powerful.

FSLR is a great proxy for the market, not just by 3C, but leading indicators, currencies, futures, etc.

IWM $100 Call P/L

I closed the October IWM calls even though they have plenty of time on them, I just see no reason to hang around for a 1 or 2 day pullback, maybe another day in reversal process (somewhere around 1-3 days) of drawdown, when I can simply re-enter the position at a better price point on a market pullback that looks assured at this point.

This was meant for the market bounce so it's not a large gain, but not a loss either. The VXX


The P/L on this position is about +6.5%

Closing IWM October $100 Call

I think I can get this back at better prices.

Market Update: Leading Indicators

There still aren't any really great trade set ups, simply because the next expected move isn't that large and still within the chop, that's why most ideas this week have used leverage.

Leading Indicators are in line with short term expectations, even though I wouldn't expect much movement today because of the pin, the late Friday movement usually doesn't have much to do with the trend, however the 3C signals are important.

As I was saying, Leading Indicators (always compared to the SPX in green unless otherwise noted).

First and most important, Credit.

 Overall HYG Credit has remained largely within a wide, choppy range with the SPX, more specifically though...

 Intraday HYG is not moving with the SPX which suggests again a move down toward the lower end of the SPX's range.

JNK Credit is acting a lot like HYG, intraday it too is leading the SPX lower.

High Yield Credit is the more skittish because of the lower liquidity, I mentioned last night it has been pulling back/consolidating, nothing that puts the larger bounce in danger, but certainly signaling that a move to the downside after nearly 3-days in this range, is highly likely.

 Here's a closer look intraday of HY credit vs the SPX, clearly credit is NOT following equities here and credit typically leads, both longer term and often short term, especially at pivot points.

VXX, short term VIX futures has an inverse relationship with the SPX, so as the SPX moved to a higher high today, VXX "should" have moved to a lower low, we often see this and when that doesn't happen, it represents demand for protection in VIX futures, this could be because of an expected pullback or because of events in Syria with the weekend coming, I suspect a little of both.

Yields tend to act like a magnet for equities as you can see here, however on a short term basis (signal over the next couple of days), Yields are suggesting a move lower in the SPX as well.

Here is a closer look.

Finally our sentiment indicators, HIO has been in good shape with the longer term signal pointing to a decent upside move OUTSIDE THE RANGE, but intraday, the last 3 days it has been pointing toward that same pullback that so many other assets and indicators have been pointing to.

FCT, the other sentiment indicator has been less enthusiastic, but at least recently flat in a choppy range, however like HIO above, it too has seen about the last 3 days moving to the downside.

This is not a downside move that is so large that is suggests the pullback and move to the upside are skipped, it would have to be much more extreme to signal that, but it does signal a move to the downside for the SPX, a move I believe will take out the 8/28 lows before moving higher.

Trade Follow Up / Set-Up: MCP

I still like/love MCP. However, last night I did mention MCP "could" pull a head fake move on a market pullback and you could use such a move to either start a new MCP long position or add to it.

I was just flipping through watchlist charts and said to myself, "Look at that triangle in MCP!", it just goes to show how cluttered my brain is because as I turned on the chart's drawing tools I noticed I had already drawn the trendlines around the triangle and the triangle I remembered (well it is Friday, it has been a long week for me) was why I mentioned MCP as being a possible head fake (shakeout) candidate on a market pullback.

So if you are interested in entering MCP as a new long or even as an add-to position, here's what I'd be looking for and if you are long and wondering if this means I'd trader around a  potential pullback in MCP, the answer would be the same as TECL (long), "No".

 First I saw this 15 min leading positive divergence, I didn't draw it on the chart because I want you to be able to spot these for yourself because no matter what indicator you are using (ROC, MACD, Stochastics, RSI, etc.) the best use of these indicators is more often than not, not what they were designed for, but divergence analysis.

Above you see price pulling back since the 8/22 highs, which way is the 15 min 3C indicator (blue) going? OK, price down, 3C should be moving down in a normal situation, but 3C moving up means there's stronger and stronger accumulation of lower prices, someone is accumulating, someone big and they know something we don't, I'd rather follow them.

In yellow I have a "rough" price range for a pullback. With a triangle in place a pullback, to be effective and hit stops would have to at least move below the apex of the triangle around $6.25, ultimately though the market almost always moves much more extreme than needed and it's likely that the lows att the wide end of the triangle would be taken out to hit those wider stops, that's under $6 and $6 is a whole number where the human mind gravitates to. The point bewing, when a trader enters a position and thinks about a stop, they look at support (the triangle's apes) and figure a wide stop would be $6, they don't think $5.93, they think $6.

This is the reason every retail store uses $5.99, they don't want you thinking $6 because it "seems " to be more expensive than just that 1 penny. Our minds gravitate to whole numbers and as such, traders' stops do the same.

 The 30 min chart is stunningly beautiful so yes, I'd love to add to MCP long, I didn't draw on the chart, but on the timescale I marked where the negative and positive divergences would be.

Finally a 60 min leading positive chart, do you know how many charts have 60 min positive divergences right now? About half of a percent.

So, set some price alerts if you are interested, if you can pick up MCP below support on a stop run (volume will swell on the stops being hit) and as long as 3C is accumulating those stops, it may seem hard to buy in to a move down like that, but you are actually getting a much better price and much lower risk and considering we see a head fake move like a stop run 80% of the time before a reversal, you also have high probability timing.

Market Update / VXX UVXY Long

The last Market Update made clear the market was still in the op-ex pin range, but showing distribution for an intraday move lower, this means VXX and UVXY should move proportionately (not BETA) higher, thus I like either as a long equity, not so much an option position here.

The IWM, which has been the strongest, is leading again.

WIM 2 min intraday with a horrendous leading negative, that's a clear break to the downside.

If you do look at VXX and UVXY long, those ARE positions I'd try to trade around, even intraday.

TECL Update (3x long Technology)

I looked at TECL (as it is an equity long position at about 2/3rds a full size position) yesterday and determined that draw-down was likely, but it would not be worth it to me to try to trade around it, I'd rather just be patient for what I view as a short period and let TECL for 1, act as a hedge against the majority of core short positions in case there are any surprises and 2 leave it in place in case there are any upside surprises (pretty much the same reason from 2 different perspectives, both sub-intermediate trends as the primary is fully bearish for the market).


Yesterday in talking about TECL I told a member that, "Yes, we have been doing a lot of trading around positions, but I prefer to trade trends and for the most part, unless the trend changes character, you just stick it out and that means not trading around every pullback or correction you see coming, that's how you miss some big moves. So while we are forced to do it in many instances now as the market is extremely choppy and volatile (the same reason most people don't want to trade tops and bottoms) it is in my opinion a necessary tactic for the current market, but I wouldn't want to habituate members in to thinking this is the best approach in all markets. When we get to a trending market, make life easy on yourself and stick w with the trend, if you want to juice returns around some consolidation trades that's fine, but you don't want to miss the AAPL -45% move because you were trying to trade around a 1% correction.

Again, looking at TECL, I do expect draw down, but again I DO NOT see this being worth the time, transaction costs or effort to trade around a correction, I'd rather just show patience and let it be, that's my take, but I have a high tolerance for risk as long as I feel there are strong, objective reasons to be in the position.

 TECL 2 min intraday with a negative divergence so yes I think a pullback (draw-down ) is likely very short term.

 However at the 3 min chart there is no negative divergence, in fact the opposite, meaning that the negative on the 2 min above isn't even strong enough to move to the 3 min chart, thus it's not much of a concern in smart money's view, it's not much of a concern in my view.

TECL 5 min is leading positive, this is a more important chart/signal and I'd rather trade with the highest probabilities, speaking of which...

This is the 15 min chart, a clean and clear 15 min leading positive divergence and it is confirmed by the 15 min XLK (Tech Sector) below.

15 min XLK.

You don't have to be a busy body all of the time, in fact for a lot of traders that's one of their weakest points, they're always looking for some action, looking to "MAKE SOMETHING HAPPEN".

Our best trades can't be forced, they come on their own, we don't "MAKE" things happen, we identify things that are in the making or are happening.


Market Update

It looks like we are near the top end of the max-pain op-ex pin. In the chart's below you'll probably notice there was no positive divergence at today's intraday lows. 

Also the NASDAQ 100 / QQQ is one of the worst looking 3C chart, THIS MEANS I MAY HAVE TO TAKE ANOTHER LOOK AT MY TECL (3X TECH LONG) POSITION AS WELL AS XLK (TECH SECTOR) IN GENERAL.

VXX should see upside soon.


Intrtaday NASDAQ 100 (NQ) futures
 1 min NQ is leading negative, as mentioned before, there has been no accumulation at intraday lows, this shows a weaker overall chart for the market.

 NQ 5 min's trend is crystal clear when you strip away intraday noise.

IWM distribution on the gap open, NO accumulation at intraday lows and a leading negative on the last run to "Kiss the triangle goodbye", although we still have an op-ex pin that should keep price in this range until after 2 p.m. or so.

 QQQ 1 min intraday looks like the 1 min ?NQ chart, no accumulation (even on a 1 min chart) at the lows and a leading negative on the most recent leg up (intraday).

 QQQ 2 min showing migration of the negative divergence, this makes me want to rethink whether I want to hold TECL long right now or trade around it like cutting around a bruise in an apple.

 SPY 1 min going negative

 As you'd expect just for confirmation of the charts above, VXX is leading positive, it saw NO distribution at intraday highs, confirming all of the market charts above.

We can still have more distribution before any downturn and we are still range bounde because of the max-pain op-ex pin.

The NYSE TICK data has clearly gone negative.

My custom TICK vs SPX indicator is showing the same, fewer stocks are participating on the last intraday leg up.


Market Update: Head Fake- From Failed Moves Come Fast Moves: Triangles...

Remember yesterday's triangles and the opinion they were a head fake set up, that a breakout above the triangles is exactly what retail would expect, but the 3C charts suggested it wouldn't hold. This is why I encourage you to read the 2 "Understanding the Head-Fake Move" articles I wrote and linked on the members' site.

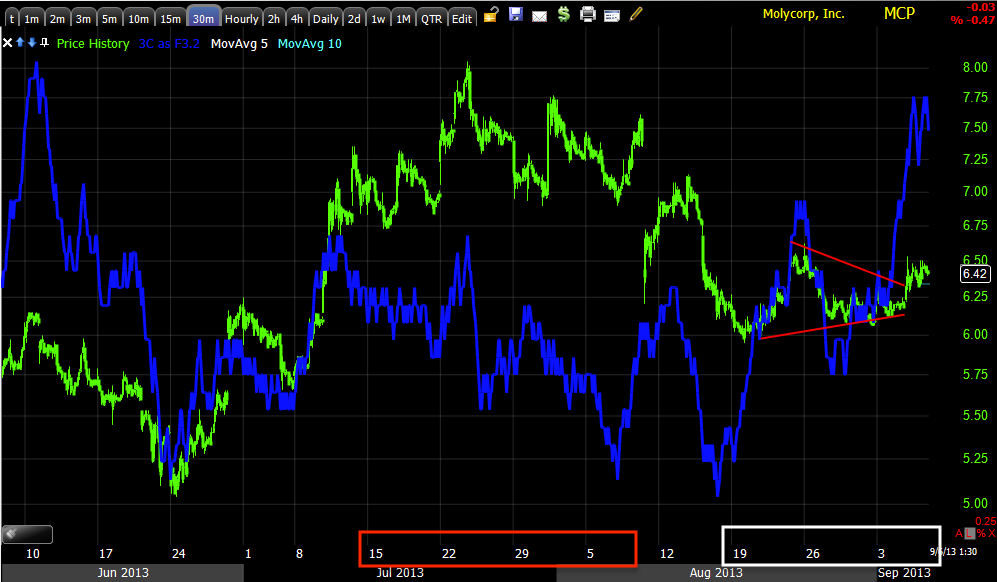
The triangles from yesterday as I noted in the Daily Wrap last night didn't see impressive breakouts, but the open this morning took care of that, check out what happened after and the volume with it, for any Technical traders going long the breakout, part of that volume is their stops as they were caught in an intraday bear trap. I suspect shorts piled in as well on the break lower, although this is not what Technical
Analysis would expect from the price formations, it's what we'd expect with negative divergences in place.

 Yesterday's SPY triangle looked a lot bigger, it's the volatility today that changes the scale and makes the triangle appear smaller, there's a lot of volume and a lot of people were sucked in to this move 1 way or the other as you'll see.

In yellow we have the head fake or "False Breakout" which failed and immediately sent prices lower, thus the saying, "From failed moves come fast moves", which is part of our Head-Fake concept.

The IWM with the most bullish "Ascending Triangle after a preceding uptrend suggests a strong upside breakout, that breakout failed in yellow (the head fake move) and a quick move to the downside on considerable volume and volatility.

The move back toward the apex of the triangle right now is called "Kissing the triangle goodbye", it can be "Kissing the channel or resistance, etc.

However I think this has more to do with an options Expiration "Pin" (weekly Friday's now pin the market as well, so every Friday). You probably recall how many times I've said it and even yesterday, "Thursday's close is typically right in the area of Friday's pin", there's generally not much straying from that area until the majority of contracts are cleaned up after 2 p.m. on Friday.

The averages aren't giving a lot away intraday so far, an inline status is what I'd expect to see for a market pin, the longer term divergences are more important now as that's where the highest probabilities are to be found.

IWM
 IWM 1 min intraday went negative in the afternoon as I mentioned yesterday after largely being in line all day. Clearly the open saw distribution, right now we are in line.

IWM 3 min shows a clearer and higher probability short term trend, leading negative

IWM 5 min shows accumulation at the lower end of the range and steering distribution at the higher end of the range, that's a fairly negative leading divergence in effect right now, it's appropriate in size for a move to the lower end of the range, in the mean time this market is a meat grinder for most traders trying to take any directional trade and hold for more than a few hours at best.

 QQQ 1 min finally went from in lone to negative yesterday afternoon, the gap up this morning was distributed and the current move is under some distribution,

 SPY 1 min went negative in it's flat range yesterday , a very tight one too, it's close to in line today, but still has an overall negative tone.

The 5 min SPY cleans up the trend, I think it's pretty clear.

As for TICK data, a lot of people were caught in this morning's move as the TICK is extreme on both sides.
 We have >-1250 on the downside and around +1250 on the upside, that's not mediocre, it's actually quite high even for this volatility.

The custom TICK vs. SPY indicator is in line with price action thus far...

The 10 min chart used to show the TICK trend shows it pretty clearly, more and more stocks failing to participate in upside moves.

What I did find interesting was HYG/Credit, their price action yesterday as noted in the, "Daily Wrap" clearly pointed to negative opening action,

"HYG never got any legs under it today, although it was still largely in the range, but it did weaken in to the late afternoon which I suspect was part of the equity weakness and the break on that 3C in line lock on 1 min charts most of the day. Junk Credit had an even more acute sell-off so it seems clear to me that credit expects the market to head lower in the coming days as do we, in fact it seems to be leading it."

I've not been worried about lower HYG prices the last few days because there's been accumulation, it's the gap up that's interesting, remember HYG is an Arbitrage Asset used to manipulate the market intraday, HYG up helps move the market up. With the failed breakout the market's tendency would be for a strong move to the downside, I'm wondering if HYG is being used to counter that just to keep the market within the region/area of the "Max Pain" options expiration pin?

We'll see as data develops in to the afternoon as the options expiration pin becomes less and less important as more contracts are closed out.

*Right now, the Q's intraday chart looks the worst for a downside 3C leading negative divergence.