Thursday, June 13, 2013

Daily Wrap

I'm really having a hard time finding much that hasn't already been discussed for the last week and a half, that wasn't covered in last night's market wrap which had some good stuff in it and especially that wasn't already posted today, especially the 3C Index Futures charts.

To me Japan will be interesting to see how it trades tonight, the BOJ minutes were released just before the Nikkei opened and the initial reaction wasn't great.

Nikkei 225 1 min 3C futures and a negative divergence on the minutes with the average losing ground on the open, but it's still early and this average can put in 9% intraday swings like it was drinking lemonade.

Most of the other stuff is just showing you the results of things already posted, a lot from yesterday and last night's daily wrap.

 First this is a VERY typical look of a short squeeze, volume tends to be low unless a cluster of stops is hit, but more importantly there tends to be a nearly diagonal intraday trend with very few pullbacks and none of any significance.

At the EOD we see price peel away from the day's trend to the upside a bit, that's about the same time WSJ, F_E_D unofficial mouthpiece Hilsenrath came out with some reassuring words that the F_E_D isn't going to raise rates any time soon even if they alter the $85 billion a month QE asset purchases, seems like a strange day to need to put Hilsenrath out there unless...

 There was one bump of volume, it was right about $164, I didn't see anything obvious, but I didn't look all that hard either, I assume it's just stops congregated at a whole number, perhaps Hilsenrath as well.

 Another Sell signal in the VIX today or rather the last two days so if the VIX moves down, then the market moves....?

Up

However note that except for 1-day, there has been no significant activity over the close of a very important day, that was the day the market put in a Key Reversal, one technical price pattern that still holds value.

Other than that, volatility is insane as I put it, last night? Today was the best day for the market this entire year except for the first day of the year, that's not based on anything but volatility and a short squeeze. In fact if it were just up to retail, the better retail sales and Initial Claims would have normally sent the market lower as good news gives the F_E_D an early out, so you can see this was something well planned in advance. When's the last time I opened 6 or 7 options positions in 1 day? (Yesterday) so it was pretty clear as it has been since this scenario was described a week and a half ago.

However, I really need to stay on guard, because this scenario has played out almost exactly as described, you or rather I can fall in to an assumption that everything else will continue to fall in to place, but the market sometimes changes its mind or sometimes you are just wrong about your theories. It's just a reminder to stay vigilante and not get lazy.

 HIO intraday was risk on as we saw last night FCT was telegraphing today's move, it seems HIO or risk sentiment was on, but not willing to buy up there and I wouldn't either, perhaps this is telegraphing a pullback very near term, like tomorrow.

 HYG, High Yield Credit is the one asset that makes me a lot more comfortable, first it has led the market as credit is supposed to do, but more importantly right now, it's hanging in there, the 3C charts look good for HYG so far, I'd still say next week they really turn up the heat.

 It's a bit strange, but the much less liquid High Yield credit which I featured last night as telegraphing market strength today, pulled back hard at 3 p.m.,  Since it is much less liquid and since volume was quite large on the pullback, I'm guessing this was someone who had a position there and perhaps was trying to get out at better prices, but still low liquidity and either panicked or might have been picked up by a predatory HFT noting an Iceberg order in an illiquid market.

I'm really not sure about this one, but I'll be watching it closely.

TLT saw some end of day gains, that was specifically on the Hilsenrath piece in the WSJ, bonds across the board pretty much gained on the reassurances. I still think something big is going on in TLT and I'd like to find a way to play it leveraged for a trend trade.

Typically TLT would move opposite the SPX, it also had ZERO arbitrage effect on the SPX.


As mentioned for nearly a week, but a lot recently, especially last night, the former risk currencies like $AUD above and EUR below, seem to have specifically got all dolled up just for this event and when I say "This event", I don't mean just today, you saw those longer term Index Futures charts.

 Euro vs SPX.

Last night I pointed out very clearly how yields were an equity magnet, you can see where both closed yesterday, today, REVERSION TO THRE MEAN, that's why we call these "Leading Indicators".

I think in a lot of ways, tonight's post is best compared to last night's post, there are a lot of concepts that were pointed out that made good today.

 Commodities was one of them, I mentioned how they looked ready to support a market risk on move, and the next day we have it and commods moving directionally with the SPX. Again this chart alone isn't very enlightening, but combined with last night's which you can find RIGHT HERE.

 I mentioned I'd show some more breadth charts so you know just how bad the big picture really is, I'll finish with that. Above we have the Percentage of all NYSE stocks trading above their 40-day moving average.  Note when the trend first started earlier this year we were at 85%, that number should hold or rise in a healthy market, we were at 32% of all stocks (NYSE) above their simple 40-day average!  The SPX is in red.

This is the same, except the PErcentage of NYSE Stocks above their 200-day moving average. from 81% to 53%? That's pretty close to the figure you'd expect to see in a bear market.

If anything pops up tonight, I'll let you know, but I'm kind of feeling like tomorrow (whatever it is on an op-ex pin) doesn't matter much, I think next week is what will matter when psychological pressure can be kept on the shorts. We will look at the market tomorrow for any opportunities of course and to take the market's temperature. Other than that, I'm kind of interested in the Nikkei tonight.

I know some of you did very well today, that means you took some VERY hard trades to take yesterday, congratulations, your best decisions are the ones where emotions take a back seat to charts and probabilities.


Futures Update

As Index Futures re-opened for trade, they opened to a 1 min negative divergence in place on all 3 majors, of course this doesn't say much as it's a very long night and a lot can happen, there's no damage at all to the 5 min charts.

 ES 1 min as trade re-opened

NQ 1 min 3C negative as trade reopened.

And TF...

This shouldn't be much of a surprise at least on a short term basis given the component futures of the USD/JPY which is the driver of risk these days, note the pair pulled back a little around the same time as the Index futures even though there's a new leading high. I believe we'll see the pair drop somewhat overnight, here's why..

The Yen futures alone have a 1 min positive divergence, if they follow it up as they should that will push the USD/JPY and futures down.

The $USD 1 min was negative earlier and price has just followed through on the earlier negative divergence so both individual currency futures point to the pair coming down overnight and risk with it. I will be interested to see how the Nikkei trades after that spanking last night, really the last several weeks.

During market hours there were signals too...
 The QQQ 1 min negative near the EOD and remember the post about taking some profits in the VXX put position?

Even though the larger picture in VXX is a leading negative divergence which is the strongest, the intraday is showing a positive divergence and as VIX futures trade opposite the market, it only makes sense.

AMZN $265 Put P/L & Rank

AMZN was one of 7 new positions opened yesterday, all with double digit gains today except for AAPL which is at a + 4% gain. I mentioned maybe taking some profits from VXX Puts opened yesterday and I did go ahead and close the AMZN Call opened yesterday at 3:48 so there was about 1 day of market exposure. I believe yesterday was the day to set up most of these trades, but we found several today that looked good as well, in fact today's addition of the XLE call position is the top performer and for those who prefer to stick to equities, ERX (3x Energy Bull) was also in the same post (+5.37% today).  Here's the reason I decided to close the AMZN position.


 AMZN 1 min 3c chart, the green arrow is when the position was opened yesterday, toward the end of the day, like many stocks, the 1 min chart was going negative.

So was the 2 and 3 min as seen above.

I mentioned earlier that I suspect we get a pullback tomorrow in to a Friday Op-Ex pin (yes even the weeklies). I feel like the other positions were worth keeping open and letting them continue working next week.

AMZN's 5 min chart is still leading positive so there's more gas in the tank, my intention was to take the 1-day gain and re-open the position at a more favorable price.

Most of the other positions I felt fine with holding until next week when I think there's time for a more sustained psychological push to maintain pressure on the shorts and letting retail do the heavy lifting which is the entire reason for this set up since the SPX triangle.

The P/L...


At the $15.95 fillAMZN came in at +25.6% for a day.

As far as the rank, this again isn't bragging, this is a tracking portfolio, not a model portfolio. If it were a model portfolio the performance would be far better because it wouldn't be diluted by the number of longer and shorter term positions I'm tracking, but the point is sentiment.

The last sentiment update from the stream was earlier and the "Bulls" didn't want to buy, citing weak volume.  I know it doesn't make sense and it's not a blanket statement, but often short squeezes are on light volume until they hit a cluster of stops that are usually at some significant price pattern, support/resistance, whole numbers, moving averages, etc.

I think since the advent of HFTs, algos can keep a low volume, steady bid in the market ramping it higher pretty easily.

As for bear markets, the hallmark of a bear market is low volume, sure you have initial breaks and capitulation events, but on average volume is pretty low and you typically have nearly as many up days as you do down days, the difference is in that during a bear market, the bulk of the gains are made in a few single days with large moves.

On to the ranking, which again just goes to show where the majority of traders  were looking.


The weekly rank is actually 5 of 742, the red is the SPX's weekly percentage move.


The monthly was 18 of 1036

Most of these gains were simply from waiting until the right moment and hitting it, that was yesterday.

I'm not too concerned with tomorrow, I'm more looking toward next week, you saw those longer charts  of the Index Futures, those are some insane signals. Perhaps tomorrow we'll be able to enter some positions on a pullback; it's hard to say what the move will be, an op-ex pin? Keeping the pressure on the shorts? Throwing the bears a bone in which they think there's no follow through on a day like today, giving them confidence to "sell the rip" or short it as it were?

I'm going to take a close look at the internals and some assets and I'll be back with observations.


IMPORTANT #2 The Charts

OK, this is the post I've been trying to get out for about an hour, there's nothing that was especially important in terms of trade positions or management, for the most part if you didn't have your trades set up yesterday (and we set up a  lot yesterday) or at the latest, this morning (except in a few circumstances), it was too late, time to just be patient and wait for the next high probability position, we don't chase and for a very good reason that a lot of shorts from yesterday learned or are in the midst of learning right now.

These are the charts that were meant to follow the first post, named "Important" because I wanted to make sure it stuck out. There are a few sections below in red, meant to standout. Please do not take this as a criticism if you feel like, "He's talking about me", I'm not talking about anyone in specific, I'm talking about a much bigger concept than that, I'm talking about the fact that Wall St. doesn't do anything without a reason (as I gave you an example of earlier).

The reason for moves like today are more emotional than anything, meaning the ultimate move as we have expected and now have data to support, is a much bigger move than today, however the two forces that move the market are quite simply Fear and Greed; if you want to trade you are better off majoring in psychology than economics.

The areas in red below point out that you (all of you) are not part of the flock of sheep, you've made the choice to turn off CNBC, to look at the market with new eyes and see the way the market really operates. You know these moves are strong and at this point have to stronger than ever because they need to change wildly bearish sentiment to wildly bullish sentiment if the set up is going to work, for that to happen, the moves have to be believable and even you, even myself,  sometimes get caught up in second guessing even though we knew this ahead of time and knew to expect it, that's just human behavior and that's why these concepts are so powerful, Wall St. is engaged in psychological warfare. In closing this topic, please don't take anything below in red personal, it's not about anyone I can even think of off the top of my head, it's just an example of how powerful these moves are and how Wall St. always has a reason to do something.

Moving on, I know you have heard it often lately, "I've never seen something like this before", but we are in an extreme market that is a house of cards, built 20 stories high, built on beach sand with shifting winds and an incoming tide (That would be the market's movement based on F_E_D liquidity that is about to be withdrawn). 

The point is, we've never had a market like this in the history of the world, not only so interconnected, not only so many global recessions, but something like 500+ International Central Bank easing actions since 2009, it is truly unprecedented and you can see how it is playing out in Japan already, that's a preview.

OK, this is what I have so far. Please don't forget that in my theory of what would happen in the market posted a week and a half ago last Monday and Tuesday, the triangle in the averages was a head fake pattern set up to draw in shorts, shorts were to be burned causing a squeeze to the upside, the reaspn for the last week and a half of trade was to set up a strong upside move, when I say strong, I mean strong. I often warn ahead of time something like, "This move is going to be so strong you yourself with all of the knowledge you have that others don't, will feel fear"

Even after giving members wanrings of what to expect, even after telling them that this move will be so emotionally strong and challenging, you'll be moved, I STILL GET PANICKED EMAILS FROM MEMBERS WHO THINK THE MOVE WE EXPECTED AND WERE WARNED ABOUT IS A REAL THING AND THEY WANT TO UNDO EVERYTHING WE HAVE DONE TO TAKE ADVANTAGE OF IT.

I'M TELLING YOU NOW, THIS UPSIDE MOVE SHOULD BE ONE OF THE STRONGEST YOU HAVE SEEN, YOU WILL DOUBT ALL SHORT POSITIONS AND LIKELY BE AFRAID TO SHORT ANYTHING, ALTHOUGH THAT IS THE PURPOSE OF THE MOVE.

Just like the move of the last week and a half was to set up a bear trap to push prices higher and we haven't even gotten started yet as far as I can tell, the next move will do the same thing, except it will be drawing in bulls to establish a huge bull trap for a wicked break to the downside.

That is what I have thought since that Monday/Tuesday last week, I have not wavered since then and I am now getting the evidence that supports the theory.

*IF ANY OF THE EVIDENCE CHANGES (and smart money is not always so smart and reserves the right to change their mind) I WILL WARN YOU OF ANY CHANGES.

Now the charts...

Lets start with the Equity Index charts (ES is the S&P E-mini futures,  NQ is the NASDAQ 100/QQQ E-mini Futures, TF is the Russell 2000 E-mini futures.

 ES 1 min intraday, it looks like some profit taking was going on from traders like us who set up our long positions yesterday, in fact I'll show you our rank today and it will give you an idea, along with a sentiment update (Hopefully Sam will send another as far as AFTER the CLOSE) of just how many traders were still very bearish, still very much on the other side of things.

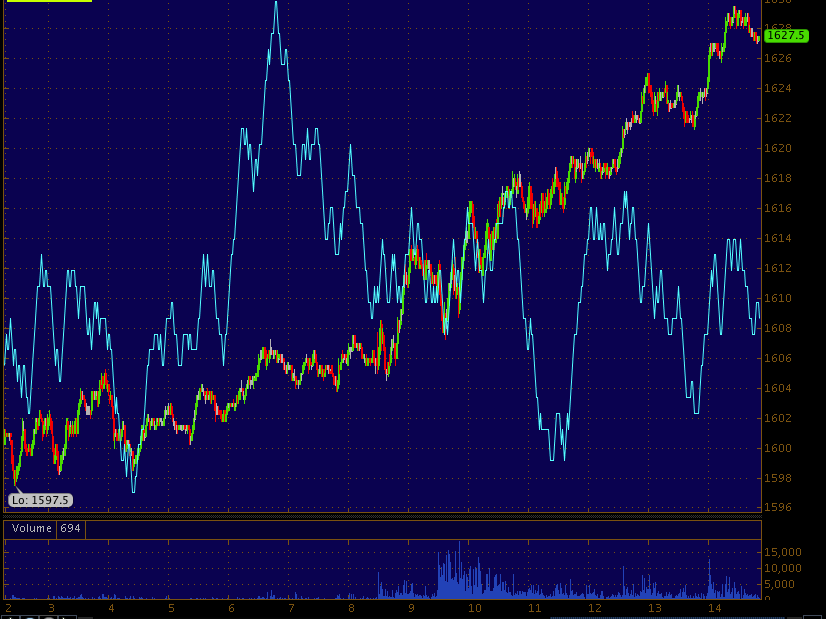
 This is ES on a 15 min chart, this is a serious signal. Note the sort of "U", sort of "V" shaped reversal that we talked about occurring over night yesterday, there it is, but more important, look AT THE SIZE OF THAT 3C LEADING POSITIVE DIVERGENCE COMING FROM THAT AREA AS THERE WAS (AGAIN AS MENTIONED LAST NIGHT)  A HEAD FAKE MOVE BELOW $1600, that's exactly where that accumulation came from and why I said there would be one.

This is the NQ 15 min chart, I haven't ever seen a 15 min futures chart with a leading divergence that strong, that fast and its confirmed in all of the Indexes. In yellow, the typical head fake move before a reversal, the same as Es under $1600 last night.


This is the TF 15 min chart, again, leading positive (the strongest type of divergence) to a new high on the chart and in one of the biggest, strongest, fastest deloping divergence I've ever seen on futures charts, maybe on all charts.

This is 30 min ES, it's strong, not as strong as some of the others.

Note the previous low/positive divergence, it's possible this is one large divergence in which case, the move would be exceptionally strong.

 This is the 30 min NQ chart, that's an insane leading positive divergence to occur so quickly on such a long timeframe, that's serious underlying money flow.

 Look at the 30 min TF divergence, it's leading to a new high!

This is an amazing TF 60 min chart from today, I'm speechless after seeing these.

As for currency and if you haven't read the two articles I wrote in April "Currency Crisis" which are both linked at the top right of the member's page, then you are missing out on a lot of understanding of what is happening, why and what it will lead to.

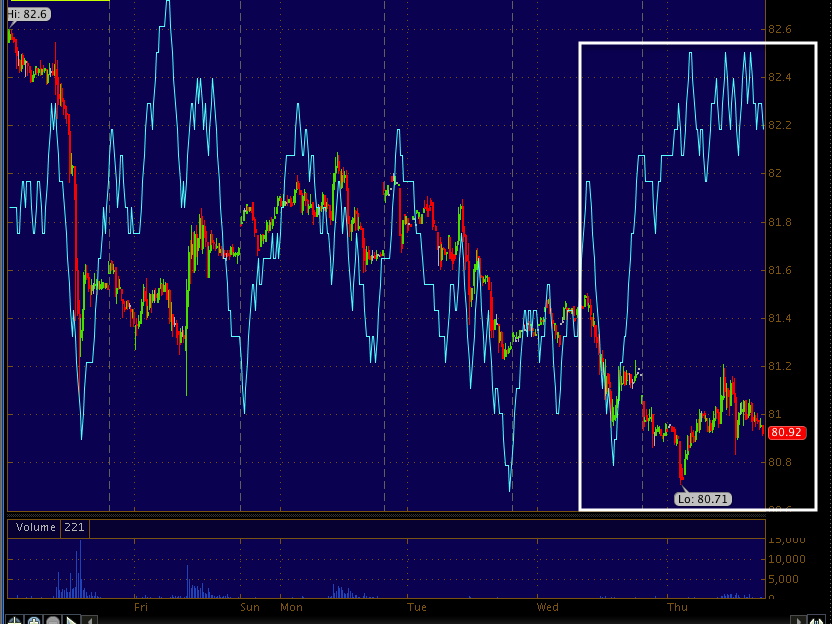
 This is yesterday's positive divergence in the former carry pair, AUD/JPY, I've talked about how this pair has come to help the market move to the upside all week. This is a chart from yesterday, in fact in this post, yesterday's "Daily Wrap, The Head Fake Is In" you'll see the charts of AUD/JPY as well as EUR/JPY and the references to how we noticed this earlier in the week, there are at least 4 other posts dealing with the AUD/JPY coming to help. Yesterday the accumulation was in...

Today...
 The move was in- 1 min AUD/JPY.

We also had the EUR/JPY
the accumulation of the pair is clear, the move was supportive of the market, but there's distribution in the pair as the afternoon went on, this is why I mentioned maybe taking profits in VXX and AMZN as a pullback may be on the way due to op-ex Friday pin.

The USD/JPY which is the main driver of the market right now...
It didn't matter how bad the Nikkei was torn apart last night, down -6.4% making the Goldman Sachs "Long the Nikkei"  with a target of $14,500 and a stop of $12,700 posted over the weekend, exactly the garbage I said it would be, how about this post, "Goldman Strikes Again" but rest assured, they aren't dumb, they didn't lose money, they were on the other side of that trade making money. The point is, even with the USD/JPY getting Monkey Hammered overnight, it was there when the SPX needed it today.

The same negative intraday was there so I decided to look at the individual Currency futures and found more surprises.

 The $USDX 1 min going negative, no wonder the pair went negative intraday.

The 15 min $USD though is leading positive, this speaks to a longer trend to the upside with USD/JPY help.

Now the Yen...
 The 1 min Yen, when it rises the USD/JPY and market tend to fall so the positive divergence contributed to the 1 min USD/JPY a little.

 This is the 5 min Yen., it has the start of a leading negative divergence, which is good for the USD/JPY and the market. So you can get a feel for what the market will do very near term and next week just by these charts.

Now look at  the Yen 15 min, combine that with the USD 15 min and you have a screaming market next week, maybe sooner.

The 60 min Yen is even worse, but more importantly, a longer term trend, speaking to the size of the move up in the market.


This is the 4 hour Yen, the VERY big picture, note how it is the opposite of the 60 min, if you read the two linked posts, Currency Crisis, you know what this means, this is the trend that the market upside and bull trap are setting up.

More shortly.