Wednesday, January 11, 2012

BGZ

BGZ is a 3x leveraged inverse (short) ETF for the large caps, you may recall the Dow didn't perform all that well today. A member emailed me about the large volume in the closing minutes of trade, so I took a little closer look.

 That is pretty large volume and it wasn't like BGZ was coming off a top area. Remember that institutional traders usually trade at the close.

During the same time period, this is what 3C for BGZ looked like.

Market Observations

A few observations, the first, the market remains obsessed with filling gaps. I can't say for sure, but last year the S&P moved over 1234 points from May 1 to December 1 and closed the year nearly flat, actually down -1.12%, but the take away is add the rest of December and and January through April and the number is probably closer to 1800 points of movement and a flat close. You could say the market is exceptionally volatile.

Throughout 2011 we saw massive outflows from equity funds, $140 billion to be exact. The volatility that really increased starting May and running through the rest of 2011 may have some correlation with the fact that starting April of 2011 and running through the end of the year, there were 35/36 consecutive weeks in which money was pulled from the market, yet the market still managed to end the year with only a slight loss. The obvious answer to this (as we would expect redemptions to cause forced selling, in effect increasing supply and lowering demand which should have sent the market lower) is volatility is being used to prop up the market. Of course the more volatility in the market, the less investors want to be in the market. That would also seem to be the obvious answer as to why so many gaps are filled, the daily volatility that goes from lows of the day to highs of the day, but doesn't move the market much, certainly would be expected to fill a lot more gaps then usual; that's a hunch, not science.

Psychologically it seems the market is much more bullish then it actually is. Take today for instance.. Here are the major averages...


 The Dow 30, a complete gap fill, but ending the day down -.12%

 The NASDAQ 100 filled the gap early, but only gained .20%

 The NYSE composite of over 2000 stocks filled the gap and ended the day down .10%

 The Russell 2000 was the best performer gaining an unimpressive .30%

And the S&P-500 filled the gap and then some, but ended the day up .01%, that's about as close as you get to unchanged at 1/100th of 1%

Averaging the major averages, today yielded a gain of .058% . You might think to yourself, "It's still a green day", however, if you consider that yesterday the S&P was up .89%, the NASDAQ up .71%, the Dow up .56% and the Russell 2k up 1.49%; then even the measly returns of yesterday couldn't generate any follow through buying interest at the time of year when money is supposed to be flowing back in to the market. In that light, you have to ask yourself a question that is a little more farsighted then 1 day or even 2, "Is every green day a bullish day?"

If the Russell can put together a 1.49% gain yesterday (which is fairly solid for recent action), but it can't follow up the day with demand and produce a follow through day of at least 1% on some decent volume,  is that bullish or bearish?

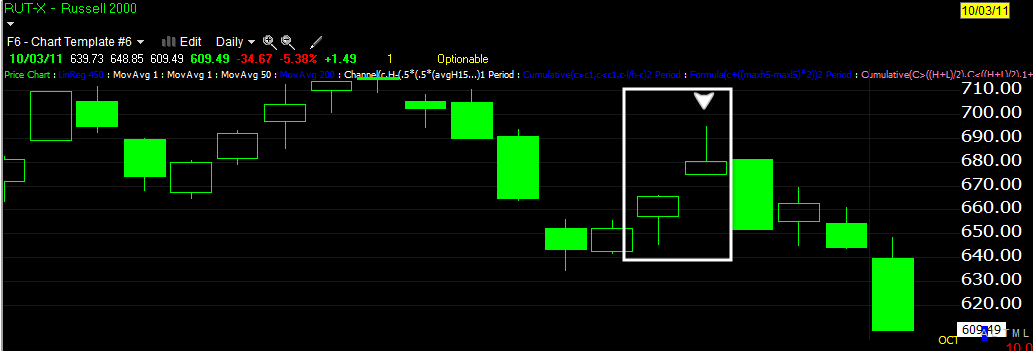
I spent at least one class per semester (when I was teaching technical analysis) teaching students what a solid breakout or a solid move looks like. One day a trend does not make, so we look to the next day for what is called a follow through day. A follow through day ideally produces a bigger gain, it does so on increased volume and it closes at the top of the range; if any of those components are missing, a follow up day becomes suspicious.  Say a follow through day (after a 1.49% gain) moves as high as 3%, but then gives back half or so and ends the day at a gain of 1.75%. Literally speaking, you have the higher high and bigger gain, but you end up with a price candle that looks like this...

The long wick on the second candle is a rejection of higher prices, it's institutional money that trades near the close doing more selling then buying and this happens to be a stronger example then yesterday and today as the first price bar gained 2% and the second gained 2.19%, but was it a strong follow through day? The chart answers the question (and I didn't cherry pick or search for more then 10 seconds for this example).

Or how about a follow through day or even a series of them, but volume is declining? Even if the day closed near its highs, the lack of volume tells you that traders are not so enthusiastic about chasing prices higher.

Here we have a nice trend emerging, volume is increasing, many of the days are closing at the upper end of their range, but volume starts dropping off. Bullish? Using this exact same chart, lets take a look at the gains made in the series in the white box:

Day 1 +3.66%
Day 2 +4.41%
Day 3 +5.01%
Day 4  +5.29 % (so far so good, lots of good follow through days on increasing volume)
Day 5 +10.26%
Day 6 +3.61% on lower volume. You can't argue 3.61% is not a nice gain, but it should be sounding some alarm bells.
Day 7 +2.34% The day closed up, it closed near its high, but price gains are falling, volume is falling, the message of both are, "Traders are not so enthusiastic about chasing this higher". Looking at the single day you might be inclined to be happy with it, it has added to the gain, apparently closed strong, but 1 day doesn't make a trend and put in its proper context, your trade management should be tightening stops, you have been warned by the market.

Over the next 6 weeks you have a return of .51% -DEAD MONEY.

The point is, not every day that closes up is bullish.

Here's 1 more example (this may seem to contradict some of the above, but there are some concepts you are familiar with and honestly the importance of volume and changes in character, even slight, are becoming a lost art) :

We're not even using 3, just Wilder's RSI (Another simple indicator that's powerful, but becoming lost in a sea of exotic, latest craze indicators). Th first day to the left was a 14% gain on huge volume and a new breakout. You know about false breakouts so I won't cover that, but the volume, while increasing is good, is out of character for the stock, it also closed off its highs and RSI failed to make a new high, this is a great 1 day gain, but should raise some alarms. The second example is another breakout day, 7% gain, a new high as well, still, the volume is out of character, RSI doesn't make a new high, it doesn't even make a similar high like we see in July. There are a lot of indicators as well as market information for the day that could tell us a lot. The fact is though, these seemingly bullish days both could have cost you money.


One last example, the Russell 2000 performed the best today. A look at the 4 pre volume relationships reveals a piece of the puzzle, here's how they stacked up:

Stocks in the R2k

Close Down and Volume Down: 467
Close Down and Volume up: 256
Close Up and Volume Up: 451
Close Up and Volume Down: 644

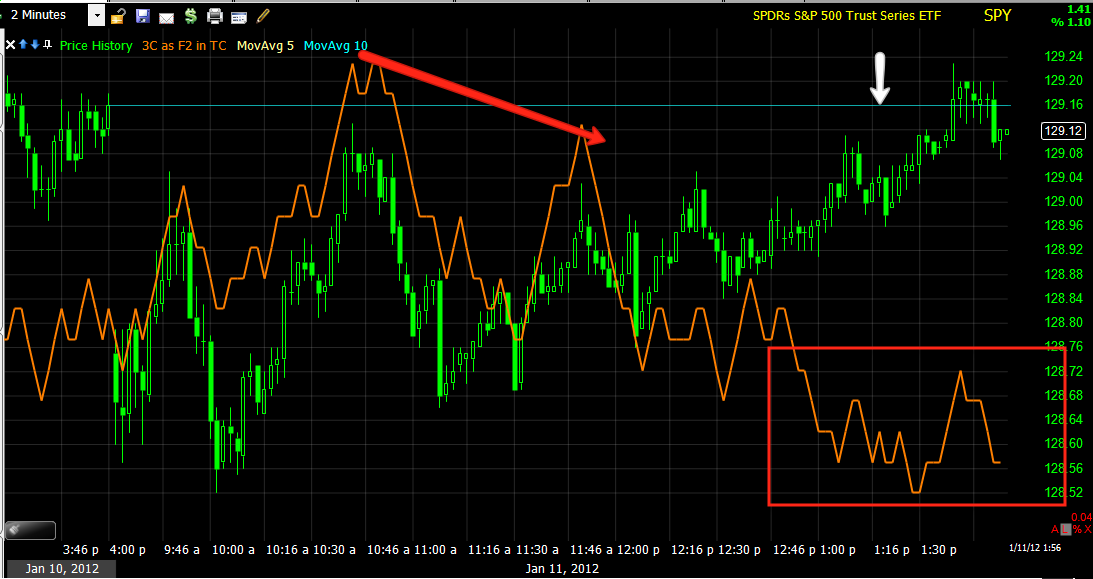
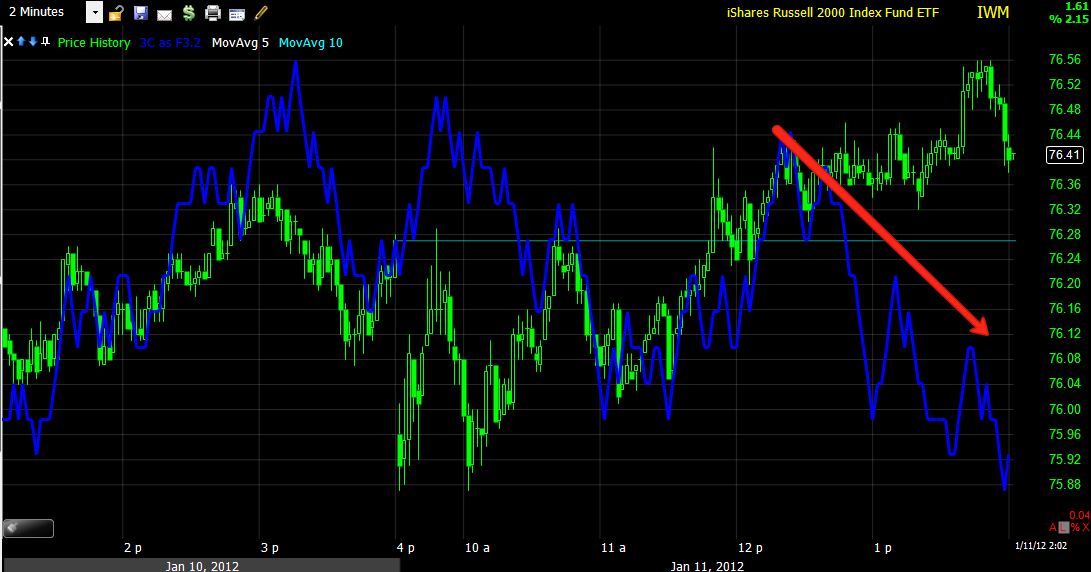
The semi-dominant relationship is close up and volume down, it is also considered the most bearish relationship among the 4. Close Up and Volume Up is considered the most bullish relationship. Close Down and Volume Down r Close Down and Volume Up are subject to interpretation depending on where the market is. For instance, in an oversold pullback within a larger uptrend, Close Down and Volume Up can be considered bullish as it suggests a bottom has been put in. Here's an example...
Both red arrows would almost certainly have seen a dominant P/V relationship of Close Down and Volume Up, the first was a short term bottom, the second was the day before the powerful October rally kicked off. Look at some charts, you'll see more often then not that the last day in a move down before a reversal is a down day on increased volume.

Again, my point is simply, just because it is green, doesn't mean it's always bullish. The opposite is also true, just because it's a red day doesn't mean it is bearish. For example, pullbacks are necessary, stocks can't rise forever without becoming overbought and risking a huge down day. To take the example to the extreme, a capitulation day that may gap down 10% on huge volume and close at its lows is not always bearish, toward the end of a bear market, you need these capitulation days to start a new uptrend. I suppose more then anything, I'm saying you have to keep the big picture in mind, price alone is often deceiving. I would never make an assumption about any asset based on price alone, price is just 1 piece of the puzzle unless you are a day trader.

Catalysts? CONTEXT

Since CONTEXT is dropping again today away from ES I figured I'd take a closer look, being the market just saw a little pop. The F_E_D's Beige Book was released at 2 p.m., no reaction from the market, and with Europe closed, that was all that was on the schedule for the rest of today, my assumption was the pop was a Euro arbitrage based move; that appears to be the case.


 Commodities which have a strong Euro correlation moved a little, nothing like yesterday though and are still lagging the S&P.

 Rates certainly had nothing to do with it as they have sold off to the lows of the day.

 Actually Rates have sold off to new lows for the new year today.

 Here's the SPX/EURO correlation, that seems to be the catalyst.

We'll look closer at the EUR/USD in a moment.

 Longer term, but not much longer, the Euro is still significantly lower then the implied correlation

Credit wasn't behind the move or even with it

Here's another look at the Euro/SPX correlation for today.
I put the arrow below but it is pointing down as the Euro makes a lower high and the SPX made a higher high, since it is correlation with the Euro, the Euro is what should be watched in to the close, not that t's a huge move or deal at this point.

Here's the EUR/USD which saw a minor move up at the exact same time as the market.

On a slightly longer term to see the recent trend..
Looks pretty normal to me. I think more then anything, just the fact the Euro moved above $1.27 gave the move a bit more weight.

URRE Update

The last time we looked at URRE (last week?) I said to watch the trend not so much the day to day and look for a rounding type bottom in prices. URRE continues to shape up and reminds me of several different situations from the past.

 First the descending (bullish) wedge which is quite big. The rule of thumb is "Wedges retrace their base", that would give URRE a price pattern implied target of $3.50 or so. I've seen these really long wedges play out with positive divergences and keep moving lower, surprisingly they moved to their implied target, it happened in the $USD and American airlines. The break below the wedge trendline on heavy volume confirms the trendline as being real. The breakout from the apex of the wedge is what traders expect so we expect that to initially fail as it did.  For the last year or two, this has been the pattern, the wedge, the breakout that sucks the longs in and fails and then lateral base building. The yellow area is where the base seems to be coming together, although I suspect there's been accumulation since long before that.

 This is the rounding I said to watch for, it would be nice to see volume start to pick up as well, but in general it's a quiet time for URRE and they won't do much to attract attention until URRE is ready for stage 2 mark up.

 Recent 15 min accumulation

Two types of accumulation, the first on a capitulation move which works and doesn't arouse suspicions because someone needs to take the other side of the sell orders. The second is the more common lateral/quiet accumulation.

In any case, URRE is worth keeping an eye on, it is definitely shaping up.

Today's UST Auction

These Treasury auctions just keep getting stranger by the day. Today $21 billion (another $21 billion above and beyond the debt ceiling) in 10 year bonds were offered and scooped up. Each auction seems to be setting some kind of new record and today's was no exception, the 10 years were placed at a record low yield of 1.90%. The bid to cover was a healthy 3.29 which is in the top 5 highest BTC in the history of the 10 year. Obviously something is going on here. This doesn't seem to be the same safe haven buying we've sen in the shorter duration notes, but it is some kind of flight to safety as the US seems to be viewed as a safe place to park a lot of cash for a return that is really, well... meager. And what about the fact that these are being sold above the debt ceiling? No one seems to mind.

In a reversal from yesterday's auction, direct bidders came in much stronger at 17.4% which is about 2x more then the last 10 year auction. The PD's took about 44% and the indirects are still weak, which is not surprising as they have their own debt issuance to worry about, whether it be China or Europe, they came in at a low 38%.

So that's about $50 billion raised in the last 2 days which is above the debt ceiling, thus yesterday when I ran the "Breaking News" caption from CNBC about the F_E_D remitting nearly $77 billion in F_E_D 2011 earnings (remember this is a quasi governmental-private corporation that is FOR PROFIT) back to the Treasury, this is why. When they run out of flow from the F_E_D, they'll do the same as last time we breached the ceiling and start burning government pension cash.

In any case, its time to take a closer look at Treasuries

XLF Finally Breaking?

Earlier I showed you the momentum indicator for financials and it was quite a bit stronger then the S&P. We are at the point right now in which the intraday charts have been suggesting all day.

 The intraday trendline broken on a quite large candle.

 This is what 3C has been suggesting all day.

The bigger play here is this wedge, it's big enough and lasted long enough that it should be a very obvious feature which is exactly why it would have seen a breakout/ head fake. yesterday provided the momentum to break above the long term pattern. Although a move below the apex would be pretty good confirmation of the suspected head fake break out failing, a move below $13.40 would be more convincing as it would rule out a simple gap fill pullback.

USO Update...

We have several members that trade the EIA report just about every week, USO seems to almost always provide some gains on Wednesday as the report is leaked probably more often then anything I've seen. In any case, I've received several emails that several of you took USO on the break below that 5 min 10-bar moving average. USO only missed the gap by $.05 so it was pretty darn close.

Here's what it's looking like now. It would be nice if you were able to use the same moving average as a stop, if we don't get Euro/Dollar volatility you may be able to.

 There's the moving average I suggested for an intraday trade, like I said, missed the gap by $.05

 Here's the early positive divergence at the 10:30 release and it has done what was expected, remember this was positive when we started.

 It's continued to bleed through the longer timeframes as I was expecting/hoping.

And the 5 min just looks like it's confirming the start of the decline from yesterday.

Quick Market Update

There are a lot of other charts I want to include, but since there's a move unfolding a bit quickly, I wanted to get at least this out.

 Every average has an intraday pattern similar to this as seen in the SPY, it's very wedgie and obviously a bearish wedge, the breakout as is standard operating procedure has occurred, this is where we watch for the downside move. It's pretty close to a confirmed head fake, t may be at that by the time I get this out.

 Yu can see 3C has been negative in the pattern as well, it is a bearish pattern, it's just the bullish head fake breakout that almost always happens and thus far has.

 DIA has been negative in to the same pattern.

 This is more or less confirmation with the negative divergence marked as well.

 The IWM has shown a pretty sharp lading negative. The actual breakout, if viewed with a 10 min chart, looks very similar to a candlestick "Tower reversal"

 Just for perspective,  the 15 min IWM chart.

 The Q's look a bit different, but the break and negative divergence are happening at the same time as the other averages.

 And a little longer timeframe intraday on the Q's

Interestingly, the 5 min covering yesterday and today is negative at both

More to come

USO still proceeding as expected

The only thing USO has not done yet is to fill the gap and maybe run above it a bit, otherwise it is proceeding as I outlined shortly after the EIA report came out this morning.

 As mentioned, the closer we move to the gap, the sooner distribution should start, the 1 min chart is already at a new leading low on the day, so I would say we've passed that hurdle.

 It has bled through to the 2 min chart, also starting to lead negative.

The 5 min chart, which didn't see accumulation (there wasn't enough as it looks to be an intraday move only) has also seen the negative underlying trade bleed through and it is back to the day's lows.

The only thing I would be waiting on here is the gap fill.

USO Update...

USO s proceeding as I expected it would.
 The 1 min chart which was in confirmation at the last post has switched to a leading negative stance as USO approaches the gap.

 It has started to bleed through to the 2 min chart which is putting in the start of a negative divergence.

And the 5 min chart, never moved to confirmation and is even starting to see bleed through.

Watch the 5 min 10-bar moving average.

This is one possible entry on a break below.

Financials Update

 XLF is showing some early signs of what appears to be some big trouble.

BAC is showing similar signs.

I'm going to wait and see if XLF bleeds through as it should.

EIA Petroleum Report

Released on 1/11/2012 10:30:00 AM For wk1/6, 2012
PriorActual
Crude oil inventories (weekly change)2.2 M barrels5.0 M barrels
Gasoline (weekly change)2.5 M barrels3.6 M barrels
Distillates (weekly change)3.2 M barrels4.0 M barrels
Once again we see a build in all 3 and increasing, this may be due to the Iranian situation as the EIA has already agreed to release strategic reserves if it becomes necessary. 

There was a pretty sharp spike down on volume at the 10:30 release, however we had already identified what appeared to be intraday accumulation in USO and more specifically energy. We can never know for sure, but I would suspect that the EIA report (which in my experience tends to be one of the most leaked reports out there) was leaked and a short term trade was conceived in accumulating near the lows of the morning and then on the release to run an intraday bounce. It doesn't really matter what the report said in this case of an intraday trade, the point is the supply of shares would have been there on the cheap and being able to accumulate in bulk on the spike down at the report release would not be seen as tipping their hand as someone has to take the other side of the trade.

 The 1 min 3C chart confirms what I suspected as you an see 3C making a higher low at the 10:30 release of the report, so those shares dumped by longs or shorted (both are selling) were accumulated for an intraday run up, I would guess the gap down today will be the upside target.

The 5 min chart shows NO accumulation so it wasn't that heavy, it suggests the intraday move we are seeing and we still have the negative 10 min and 15 min capping the move. This may present a short trade opportunity as soon as they have distributed their long position (they would likely go short after that). So we'll watch for a trade opportunity in USO. As for longer term traders short energy/crude, this should not be anything that will effect the negative atmosphere shown earlier in the larger trend.