Wednesday, December 12, 2012

The AMZN Charts Promised

I already had a short position in AMZN started, was at a small position loss of 1.8%, but that's only about -0.30% of portfolio on a position that accounts for about 7-8% of portfolio value with margin, without margin closer to 15% so a loss of 3/10ths of 1 percent is well within my risk management guidelines of no 1 position losing more than 2% of portfolio value at the most and often less than that (1%). If you control risk, you just need to play the probabilities and you will get there. If you let risk get out of hand or you take sub par trades (low probabilities), given enough time it will catch up to you.

So while this position accounts for nearly 15% of portfolio before margin, the risk accounts for less than half of 1%, how do we accomplish this? First we have a risk management plan, you can read more about the basics I use right here and it is linked at the top right of the site for you to review anytime.

Second we don't chase trades, the more you chase a trade the more risk you are adding, the less profit potential and the lower the probabilities. We look for trades and then let them come to us on our terms, we get them for better prices, less risk and higher probabilities and if they don't come to us on our terms, there are 10+ thousand other choices. Make it easy on yourself, be picky, be patient.

Here's what I like about AMZN and why I decided to add to the short today even though I think there's a chance of a little better entry...

 AMZN Daily chart with a Linear Regression Channel. The first channel buster in late April/early May did not lead to a change in trend which they often do. The second channel buster did what a downside break often does, it moved back to kiss the channel good bye, this is why we don't chase because if you shorted AMZN on the break of the channel, there's a very good chance you'll be shaken out on a move back up to kiss the channel goodbye, you see the trade set up, wait for an opportune time and enter on your terms. By the time you entered a short on the break of the channel, you'd have at least 8% draw down on the kiss of the channel, many people set stops at 8% - an old IBD suggestion that many traders follow although it's completely arbitrary; an 8% correction in AMZN is more serious than an 8% correction in say MCP, in MCP the Beta is nearly 4 times more than AMZN so a normal, ordinary run of the mill correction in MCP would be a substantial move in AMZN.

This is one of the reasons I created the Trend Channel as it is specific to each stock it is applied to and will tell you when the correction is out of character and likely to lead to a change in trend.

Also note the declining volume in AMZN, although most of the market is the same way, a healthy up trend should see expanding volume, not contracting. Look at the SPX bull market rally's volume from 20003 to about 2006 just before the volatility got out of control which is a warning of an impending top although at the time it looks very bullish. Volume expanded and that timeframe was the easy money, the trend, after that it was a lot of volatility and exit at the wrong time and you could end up wasting a year of opportunity cost for an extra 7% which could have been made in certain stocks in a day.

Then look at the volume for the SPX from 2009 to present, although price is significantly higher, it is not higher in a healthy way, it is higher because of QE programs and manipulation of sorts by the Central Bank.


 I'm using my Trend Channel here, the first custom indicator I received an award for and I'm being VERY generous by using a 5-day chart, but even on such a wide chart the channel can tell when the stock's character is changing and it gave a Buy to Cover signal at the white arrow, then after a long trend it gave a sell signal at either of the red arrows to the right. Hanging around after the TC gives a signal often is just sitting through extraordinary volatility for a measly additional gain if you can even get that. Once probabilities are no longer on your side, having an open position like AMZN after the stop out is really just pure market risk with low probabilities of any significant gains; your money is exposed to market, sector and stock risk with no good reason. If my money is in the market, it's there because there's a good reason, even in a defensive or low Beta stock, the market can easily dip 20% in a matter of a week.

 Using a very generous 9-day chart with a 50-bar moving average (450 day), it holds most of AMZN's tend from 2009, but few people have the stomach to sit through the daily volatility that long. Note also I've added Relative Strength to the lower window, not Wilder's RSI which compares price in one asset to itself, but RS where price is compared to another asset and in this case I compare AMZN to it's own Sub-Industry group of 17 stocks including names like EBAY, OSTK, STMP, DANG, LNTA, BIDZ, etc and AMZN performs poorly with weakening RS vs its own peers.  Note volume as well.

 On the same 9-day chart in yellow to the left, the tall upper wicks on the candles indicate higher prices are tested and fail, there's resistance there and AMZN turns down for the rest of the year. At the orange arrow AMZN sees a pullback that remains within the tall candle body, then a series of higher highs/higher lows continues the trend and another noise candle or pullback at the next orange arrow creating a hammer (support) and at the next green arrow another series of higher highs and lows continuing the uptrend, at the red arrow we see a noise candle that fails to make a higher high and low and then a series of candles making lower highs and lows (a down trend). The current two candle pattern is just shy of two different downside reversal candle set ups. Look at the candles on other charts like 5 day or monthly and you'll find different, but useful information, the 9-day choice here was completely arbitrary.

 The daily 3C chart shows heavy distribution in to higher prices as is usually the case, however the leading negative divergence is well below 3C's position back at the 2009 lows, with price this elevated and 3C so low with so little underlying flow support, AMZN is literally like walking out on a thin ledge and hearing cracking sounds. You'll also notice like any other major divergence (positive or negative) it started with a relative divergence and led to a leading negative, a leading divergence is more powerful than a relative divergence.


 The 2 hour chart is a VERY significant timeframe and trend for 3C, you can see some accumulation at white arrows, distribution at red and confirmation of the trend at green. The recent price highs saw a leading negative divergence (red box( and if you compare price at the lower yellow line and price at the upper yellow line, 3C should make similar higher highs, instead it makes a lower move to a lading negative divergence. Bottom line, there's distribution in AMZN on significant timeframes.

 30 min chart locally from the 11/16 rally shows initial confirmation, then a leading negative divergence in to higher prices until there's not enough support to push AMZN higher and it moves to a lateral range/trend as distribution continues.

 Finally I'll just use the 15 min chart with no drawing on it, the negative divergence between price and 3C should be clear, if 3C was confirming the strength of the trend it would either be making the same higher highs as price or even leading price to the upside, it is below the 3C readings when the rally first started on 11/16, yet price is significantly higher. This in essence tells us there's less underlying money flow support up here than there was at the lows of the 16th, a dangerous area for AMZN bulls.

I could add more charts, but I think I've established the negative character of distribution in AMZN though multiple timeframes.


 Now working from the fast intraday charts that don't carry the same weight or implication as the longer charts above, but are good for intraday movement and tactical positioning once you have a strategic plan. What we see here is in the short term every time AMZN rallies there's a negative divergence, this suggests either institutional money or more likely market makers (I know AMZN uses market makers rather than specialists because of the 4 letter ticker that is unique to NASDAQ stocks) are preparing their inventory for a move in AMZN, lightening up on their long holdings so they can (if they have to) purchase shares at market if there are no other buyers and since up to 30% of a stock's volume can be a market maker trading their own account, this could also be them selling short or selling naked short which they can do because of their market maker status.

Most of the time with large orders, smart money will use the stock's market maker or specialist for NYSE stocks to fill their order because these middle men specialize in the stock and know it and its players better than anyone, this they can usually get the best fill on the order, but they also know what is coming if they filled a large order so they will prepare their own accounts and often the 1 min chart shows that, even in intraday moves that it calls.


 So I like AMZN short for a variety of reasons, I don't have the time to watch AMZN all day for the very best entry as it's more important that I am paying attention to what is most beneficial to all members so I decided to fill out the short position now even though this range is pretty obvious to Technical traders and they likely piled their BTC orders just above the range and limit buy orders just above the range with sell orders just below the range and sell short orders just below the range.

For HFT's, algos. market makers, even hedge funds, hitting those stops and orders creates a lot of volume which they can use to ill their own orders at better prices with more supply or demand available to them. They can also make money on the increased volume w/ regard to the bid/as spread and finally they make money on order flow through volume rebates. There are a lot of reasons to run a stop hunting expedition or a head fake move, which include adding to reversal momentum as well as the other things mentioned above.

If there's a move above the range, feel free to email me and we'll make sure there's distribution in to such a move, it gives you an even better entry for a short with less risk.


FXP Long Idea

This one looks close to making a move, FXP moves inversely to the market directionally so a decline in the market should send FXP (2x Short China FTSE 25) higher.

Here are a few charts I like, although generally speaking, market updates are useful for FXP even if they don't mention it because as I said, FXP moves directionally with the market most of the time, but in the opposite direction so market down, FXP up.

 Daily chart has a typical Technical Trader trap, in this case a descending triangle that easily sets up a bear trap, when the bear trap reverses, the momentum from what would be shorts covering (in this case they are simply in the inverse ETF, FXI) gives the stock momentum. A failed price pattern like this will also atract longs who reverse their trade as TA teaches.

The core of the trap is this, the descending triangle is a bearish consolidation/continuation pattern, it's continuing the preceding trend which was down. When price breaks below the patter's support, longs exit (shorts could enter or just use FXI), but it's easy to see the set up was successful just by looking at volume on the break below the pattern's support. This is what Technical Analysis teaches traders, this is textbook so they don't argue with it, they go for it (longs may have sold-shorts could have entered).

In my experience a head fake move is relative to the size of the trend so just looking at the triangle I know a head fake move is going to be more than a day, but I believe the yellow area is a had fake move and nearly done, if not done.

When a Technical pattern like this fails (as price moves above resistance of the pattern) Technical traders are taught to close their short and go long as the failed pattern is reason for them to reverse their trade which adds upside momentum to FXP as it crosses resistance around the $20.36 area. The brea below support (now resistance) caused a large flood of orders, all supply which makes it very east for smart money to accumulate FXP in bulk as no one questions smart money buying at this opportunity (lower prices and all the supply they could ask for), in fact just the opposite, trader's believe it is smart money who is selling, but they don't sell in to weakness and they don't sell in size that creates more weakness unless they are REALLY desperate. Because Technical retail traders have it all wrong, they NEVER suspect that all that volume/supply is actually being accumulated, they assume it is being sold by smart money and this is why they don't question smart money accumulating here.


 My custom DeMark inspired indicator with sell and buy signals, currently on a buy signal.

 On a 60 min chart, my Trend Channel identifies the trend and shows where the change in character occurs that will likely lead to an upside move, right above the channel at $19.18, when this is crossed, there will be a change of character of at least 2 standard deviations, changes in character precede changes in trend.

 30 min 3C with confirmation in green, negative divergence in red that sets up the break below support and a leading positive divergence on a 30-min chart over the last 2 days alone.

 15 min with a relative positive followed by a leading positive as is almost always the case, the relative positive is the start of accumulation, the leading positive is accumulation really picking up and much stronger. Just as smart money sells in to strength, they buy in to weakness. We want to do the exact same thing, but because our positions are small we can enter all of it at once, their positions are large and must be broken up in to smaller orders so no one knows what they are doing including other smart money firms and predatory HFTs that will look for these large orders broken up, they call them "Icebergs" because only a small tip of the order is seen, but if they can find enough orders they know there's something bigger below the surface, just like an iceberg and just as NYSE specialists or NASDAQ market makers do, although illegally, when they know there's a large order that will send a stock higher or lower, they front run it with their own orders to piggy back the large order; for specialists and market makers who also trade their own accounts in addition to filling these orders, this is illegal, but happens all the time. For HFTs this is not illegal because they don't have to follow the laws a market maker/specialist has to, so they front run the order and make the accumulator pay more for the shares, in effect they become the ones selling the shares to the large institution, this is why the institutions have to be so quiet about what they are doing.

 10 min is leading

 5 min is leading with the head fake area at the yellow trendline.

3 min leading.

Since the longer term charts are already positive, it just needs the short term charts to fall in line, these are the positions that will be like a capacitor, charging the move to get it going or jumpstarting it.

FXP should be a good long position that will give you short exposure to China if you need to diversify your portfolio a bit.

Futures

I'll be putting together more exhaustive analysis, especially for today, you could literally watch the market react to key words as soon as Bernie spoke them, price would fall, volume pick up or vice-versa, very interesting day.

Here are the Futures for the S&P and NASDAQ, I only use these because you know what I'm looking for (the longer timeframes to shown signs of deterioration with the shorter ones and it's a bit faster to post these two rather than all 4 averages.

I have some small intraday positive divergences going in to after-hours, but they aren't of any concern at this point.

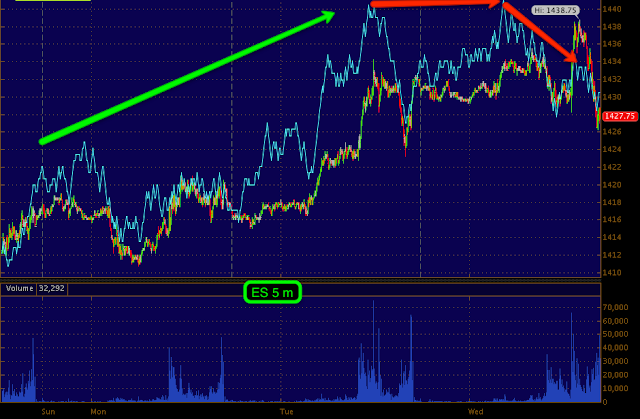
 ES (S&P futures) 1 min showing the negative divergence pre-market that sent ES down early in the day, but we weren't going to see too much movement before the policy announcement. Remember I said there were no smoking guns and then suddenly there were some divergences BEFORE the policy statement that told us the market would initially move up, but they weren't so large as to represent anything more than an intraday move.  I don't think that is coincidental considering how many news organizations already have the policy announcement sometimes hours before it is released on an embargoed status so they can talk about what just happened and sound knowledgeable without having to spend time going back reading the entire policy directive. It wouldn't be hard for someone to leak an embargoes policy statement and they could be well rewarded for doing it, I can't tell you why else we went from NO signals to a VERY clear signal that fast.

In any case, in to the move up we have a negative divergence, then I posted again about the same volatility ETFs, VXX, UVXY and XIV flipping their signals and the market went down, coincidence again?


 ES 15 min is negative which is what I want to see, deterioration among these charts.

 ES 30 min shows the exact area we saw the change in the market on Tuesday the 5th and Wednesday the 6th with positive divergences and then a negative divergence since then in to the move which we suspected would lead to some sort of breakout, remember how many times I said, "Wall Street Never does something like this without a reason", breaking the IWM's range and all of the 50-day moving averages seems to be what it was all about. In any case the negative divergence here is encouraging for our trend table.

 I don't know why, but ES 5 min, you'd see the longer negative trend I think if I had more history on these charts, any way in green ES is in line with 3C or price confirmation, then in red at the two areas we break resistance we have a negative divergence.

NASDAQ
 1 min negative pre-market sending the NQ lower early on, a positive divergence around 10 a.m. and the market up in to the policy statement as our other indicators hinted at, this is why it's so important to know the correlations and look at as many indications and assets as possible, you never know where you'll find that piece of information everyone els missed!

 15 min is inline until we get our price moves higher, above the 50 m.a.and then negative in to the highs today.

 30 min shows the initial trend with a negative divergence far left and that was where we were heading until that positive showed up a week ago at the white arrows, then an in line status in green until we made the price move higher, negative in to the highs today.

Again, I don't know why, but the 5 min out of place, but it shows what we need, a negative divergence in to the highs.

I'll be putting the pieces together, obviously there are some things I really like to add those short ideas here.

TICK Data

A Quick look at leading indicators shows the SPX actually more negative than most leading indicators, I don't really like that a lot, but there are a few scenarios in which it could work for our trend expectations which include the market reversing from the recent move up to a sharp move down. Furthermore it may be the SPX is moving faster than the leading indicators, I won't be able to say until the close.

Here's a look at TICK data, it shows the sentiment and emotion in the market when there's uncertainty and emotional extremes.

There are all today & 1 minute, the TICK is all NYSE stocks that are advancing minus those that are declining and that gives you your value, in an advance in the market the TICK should rise and decline with the market declining.
 First the full day with the SPY in white (the white trendline = 0, yellow=+1000 and red= minus 1000).

We'll take a closer look at today below.

 The read arrow is the open, on the open the TICK was VERY mellow, it looks like trepidation  as the TICK bounces between a VERY mellow +250 to -250 which is almost unheard of for any amount of time, VERY neutral before the F_O_M_C. As the F_O_M_C occurred to the right at 12:15 we see some volatility as price rises or starts to and we see almost -1000 on the downside and over +1000 on the upside.

The second half of the day... Again, 12:15 volatility in the TICK data picks up and we see +1000 readings as the SPY moves up, these are not very strong extremes for a move up, then around 1 p.m. when the SPY is still near the intraday highs the TICK diverges and is running between + and - 250 again, it's not seeing enough stocks participate to hold the level as traders are nervous before Bernie speaks. As the press conference takes place we see some initial moves to downside extremes at -1100 and -1250, we even see -1350 and nearly every time Bernie talks about policy action "Within the context of price stability" meaning if inflation picks up, policy can change and that is what the market didn't like at the press conference September 13th as well as today, that policy can change according to fluid data rather than have set dates that are firm.


Volatility ETFs-VXX, UVXY and XIV

UVXY and VXX are volatility indicators, they represent short term VIX futures so they move opposite the market, earlier I mentioned a flip where UVXY and VXX were both seeing positive divergences suggesting they would move higher and XIV which moves with the market was seeing a negative divergence so all 3 confirmed each other= Rising volatility/Fear and lower prices in the market, we've seen both happen since the flip.

Those divergences are still in place right now, UVXY and VXX positive, XIV negative across the intraday timeframes from 1, 2, 3 and 5 min with leading divergences and 10 min charts with charts that are starting to lead. A lot of the longer term charts have been in an overall positive position.

We'll see how the close goes, but I thought I'd let you know these positive divergences continue.

Remember also before the F_O_M_C the signals were the opposite suggesting the market initially move up so these indicators and their signals have worked 3 times today thus far.

AMZN Short Idea

For some this could be an add to, for others it could be a new position if you like the idea, once again I will post charts for AMZN as soon as possible, it may be after hours, but I do like AMZN here for a lot of reasons. I'll be bringing AMZN up to a full position in the equities model portfolio.

I think it's a good entry, the risk is fairly low and the probabilities look pretty good.

I would consider maybe a partial position or phasing in to it because there is an area I think AMZN could hit or make a head fake move  above and would be an even better entry, that is at the $256+ area because there is a fairly obvious range or resistance level there, but I don't have time to watch this stock that closely with everything else  I have to do for a model portfolio position.

BEAV Short Idea

I'll post the charts for BEAV later, but I do like this as a short trade in this area.

Spring Cleaning- Closing TNA Long

Taking the profit here and doing some spring cleaning considering the posture.

Adding 1/3 to FAZ long

This would bring the position to 2/3rds of a full normal position.

Adding 1/3 to SPXU Long

This makes the position 2/3rd of a normal size position.


SPY Negative on the Keyword

Assets Purchases within the "Context of price stability" which means inflation.

Market reaction...
Negative divergence and a Tick down right as the words were said with volume up.

KeyWords...

 Asset purchases..."Within the context of price stability"

Volatility ETFs-VXX, UVXY and XIV.

Earlier just before the F_O_M_C I told you there were negatives in the intraday VXX and UVXY, which is market positive and would indicate and initial favorable response, XIV was positive so it confirmed.

Now they are flipping, they were reliable last time intraday, will they be again?

XIV is seeing a negative, it is the strongest signal.

VXX and UVXY are seeing more positive signals so this suggests the market comes down at least intraday in the near term, much like the market averages.

Market Update

OK, the SPY, DIA and to a lesser extent, the IWM (except in some longer term timeframes like 15 min moving intraday) are all deteriorating worse than the last charts posted.

Es hasn't changed much, NQ looks ok still. The one average that still looks decent or at least is not deteriorating intraday like the other 3 is the QQQ and that's the one average I said yesterday, last night and today that it has a resistance area that is too obvious and this is the one average that really should break that resistance area.

Market Charts...

For a F_O_M_C day, the market is pretty subdued, here are the charts I told you about. I have a feeling we won't see too much price or 3C movement until the press conference.


 DIA 1 min overall leading/relative negative divergence.

 1 min close up, not so bad intraday

 2 min DIA relative negative divergence.

 Overall gravity of the 15 min chart since the start of the move on the 16th with accumulation, now a deep leading negative divergence.

 IWM 1 min shows the early, pre-F_O_M_C strength I mentioned earlier, otherwise in line

 2 min relative negative divergence.

 IWM 3 min with the pre-F_O_M_C positive mentioned and a relative negative divergence.

 IWM 10 min from the 16th's accumulation to present leading negative divergence.

 QQQ 1 min local trend, leading negative w/ an intraday negative divergence today at the two highs.

 2 min local trend, leading negative w/ an intraday negative divergence today at the two highs.

 QQQ 15 min since the start of the move on the 16th with a 15 min leading negative divergence, that red trendline is the area I talked about yesterday that should really see a breakout above to complete a head fake move as many traders will wait for price confirmation-the breakout,

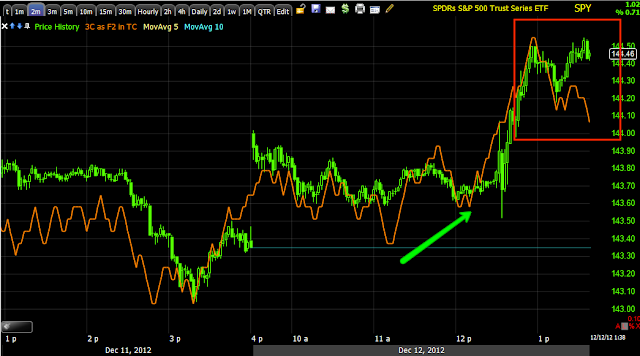
 SPY 1 min relative negative and intraday

SPY 2 min intraday negative.

Lets see what the press conference brings.

Quick Market Update

I'll post charts so you can see what' happening, the SPY though is seeing some initial negative divergences in the 1-2 min range, 3 is in line.

The DIA is pretty much in line intraday, but longer term it still has trouble and the pull of gravity.

The QQQ is putting in the start of a negative divergence across 1-3 min intraday timeframes, and of course the longer is there.

The IWM is mostly in line, it is lagging a little on a few charts.

The ES chart is in a non-confirmation position/negative and NQ has a negative divergence starting.

I'll get charts out so you get a feel.

CNBC is Making My Stomach Hurt


Unfortunately I had/have to listen to CNBC today to see what the F_O_M_C statement would be and now what the Bernie press conference will bring about at 2 p.m., again I need to pay attention to that, especially with CNBC sewing the seeds of amazement and wonder (literal wonder, as in they aren't clear on the economic data yardstick that is replacing calendar guidance) so CNBC viewers will be locked in to hear Bernie's answer to CNBC's question which is what I already told you Bernie answered on September 13th and the market didn't like it, even though we rallied on the QE3 announcement on the 13th, the press conference and that specific question marked the top of the market for the day at that exact minute in which Bernie answered the question in an Alan Green-speak kind of way.

CNBC is amazed that the F_E_D tied monetary policy, specifically the F_E_D funds rate to economic developments, they already knew this, everyone knew this, in fact a majority of economist were asked yesterday, "If the F_E_D ties the Funds rate to a specific unemployment target rate, what would it be?" Something like 48 of 49 all answered 6.5%! This is exactly what the policy statement said, but CNBC is unclear as to how that may tie in to or effect the rate of asset purchases. This was the question asked on September 13th that the market didn't like...Bernie said if inflation starts getting too hot (which it will with $85 bn  in new money being created every month) they will "Adjust" the purchase program to maintain inflation stability within the context of their mandate"!

If anything, the question is, "What is the inflation rate that triggers a change in the asset purchases and what would the literal change in asset purchases be", but that question can't be answered!

THE F_E_D'S INFLATION TARGET EXCLUDES GAS AND FOOD and that's where the inflation is and where it hits the consumer the most. How can the F_E_D say ,

"At 2.9% inflation over a 3 month period so we are sure it's not transient we will scale back MBS asset purchases to $25 bn a month instead of $40 bn and we will scale back Treasury purchases of $45 bn a month to $35 bn (because someone has to buy our debt) and we will do this until inflation hits 2.3%"?

How can the F_E_D say that, THEY CAN"T, Why does CNBC NOT GET THIS?????

So we have what was widely expected and if you payed any attention to what Bernie already said, there really aren't any surprises.

-Operation Twist will end, so the sterilized program (no new money enters the market) will be replaced with $45bn a month in Treasury purchases that will not be sterilized (more money enters the economy, dilutes the dollar)

-They will keep buying MBS at the same pace

-The total will be $85 billion as expected

-They moved forward with an economic yardstick for policy adjustments rather than a calendar date as they have made clear the last 3 meetings they would do.

-No changes to rates.

NO SURPRISES, except CNBC's willingness to appear absolutely ignorant to keep viewers on their channel for another couple of hours.


Futures Update

ES futures haven't done anything that is interesting enough that  would even bother to post it, the same applies for NQ futures despite any movement off the lows of the day.

The EUR/USD has a 1 min and 5 min negative divergence, they are along the lines of continuing the divergences that were in place earlier today, they don't seem to have changed much as a result of the policy statement. While the pair has moved up a bit here, the negative divergence that is developing continues to, I'll keep an eye on it and see if anything changes.

Euro futures on their own in the 1 min timeframe have improved a little, they are basically in line with the move up in the Euro, the $USDX futures saw a steep drop/print at 12:30 exactly of $79.40 from the $80 range, I know it doesn't sound like much, but it's a fast steep drop, it only lasted about a minute, there's some 1 min positive reaction there and this may change as the charts have more time to catch up, but the US Dollar Index futures have very nice positive divergences that are leading in the 5 min and 15 min timeframes, whether they stay in place or not will be very interesting. QE is inflationary and should be throwing negative signals on the $US dollar, so if this positive hold up it will be significant as this is also market negative.

Since starting to write this, the ES and NQ futures are not standing out as positive, but they are more in line with the move in price, more so in NASDAQ futures than S&P futures.

Market Update

So far among the averages, the IWM 1 min (intraday) continues to strengthen, beyond the 1 min timeframe there isn't much so we maybe see an intraday move that perhaps can be faded. The QQQ saw some VERY modest intraday 1 min chart improvement, the SPY is seeing 1 min chart improvement as well as a few other timeframes and the DIA is seeing a little intraday 1-2 min improvement, but the one that stands out the most is the IWM (Russell 2000).

The One Thing That Stood out

Everything was pretty much as expected, the one thing they did add was the target rate of 6.5% unemployment as a metric for policy adjustments so they have started to move away from date based guidance to economic based targets. This is something the market doesn't like much, but the fact they gave guidance of 6.5% unemployment takes some of the uncertainty and sting out of this movement away from date based policy and toward economic based policy such as asset purchases and F_E_D Funds target rates.


Move in Volatility

The intraday volatility charts like VXX and UVXY are seeing very short term 1 min or so 3C negative moves, they are quite fast, XIV which is the opposite is seeing a positive move.

Also the IWM 1 min has seen some very recent 1 min positive movement, perhaps the initial reaction in the first few minutes is bullish. This isn't long enough or big enough to draw any conclusions beyond that.

If that happens, AAPL longs may consider using this.

One Other Thing

I did mention this and show you the charts in last night's F_E_D post, remember I have been expecting the move up above the IWM's range and then a move down to continue the trend that was under way.

It should be remembered that the significant charts in the 10-15-30 min timeframes have leading negative divergences that are pretty deep, this is worth remembering as the F_O_M_C could be that catalyst to get that move underway or resume it, even if it is on a knee-jerk reaction, if it moves low enough, that's all we need.

What I see so far

I don't see a smoking gun. For the most part the averages have been moving up in to weakness which was the move that started yesterday which was expected (think IWM range that needed to be broken), so the deterioration in the averages seems normal as far as my market trend expectations.

Short term smoking guns in today's 3C trade...As far as the averages go, there's the kind of deterioration we saw yesterday, nothing is standing out as unusual today specifically unless you want to count yesterday and today, but those signals and deterioration is pretty much as expected. I don't see evidence there of a leak.

Credit- High Yield Corporate is pretty much in line with the SPX today, nothing unusual standing out there, I will say the longer term trend in HYG and 3C underlying trade has been negative, it looks like there's been quite a bit of distribution and HYG should see a downside move sooner than later, intraday there's a slight positive, but nothing too interesting.

High Yield Credit has diverged with the SPX in price, but that's something that has been in place, no smoking gun there.

Treasuries- TLT has seen a few timeframes go pretty leading positive intraday today, this could be related to F_E_D buying in that area, it's also a bit sporadic and not consistent through timeframes, but where it is strong today, it is strong. This can also be considered a flight to safety trade so that could also be part of this, money perhaps moving from risk to a safe haven.

Gold- I mentioned yesterday that GLD looks pretty good in here, this is an asset that has historically benefitted from QE as the F_E_D dilutes the value of the dollar, people move to gold to preserve wealth.

Volatility-I don't see anything that is suggesting direction in volatility like VXX / UVXY. There was some deterioration in XIV not too long ago, which would be market negative, but that has mellowed out since.


 So far I don't see a smoking gun, I'll be watching knee jerk reactions and seeing if there's anything there that we can use to our advantage or that gives us an edge with regard to analysis. please remember that the statement is only 1 part of the day's volatility, Bernie's comments later around 2:15 typically are also important, the day of QE3 announced, Bernie's press conference saw a question that topped the market that moment which gave us an idea of what it was really worried about.

I'll keep watching, if anything pops up, I'll post immediately.


F_O_M_C Context-What to expect

The market has priced in certain expectations from the F_O_M_C statement today, any significant deviation or any thing left out could cause the market to become very volatile in either direction.

The MEP (Maturities Extension Program) which is selling short dated debt and buying long dated debt or Treasuries, is expected to be changed in to outright buying of the long end or QE for Treasuries at the long end of the curve as they run out of short debt to sell and as I mentioned last night, international (Chinese/Japanese) buyers of our debt at auctions like yesterday are disappearing, that leaves the F_E_D to take up the slack.

In addition to the already announced $40bn a month in MBS purchases, the market expects about an additional $45bn a month of Treasury purchases and for this to continue through 2012 for $85 bn a month of expansion.

If anything is significantly different like they are willing to buy more in treasuries, the market hasn't priced that in and it would likely be bullish. If they come in at $25 bn as some in the F_E_D have suggested, the market likely would be disappointed. If the F_E_D doesn't announce some Treasury buying program today, the market would be very upset and likely crash, however I think this is pretty unlikely to happen.

The other issue is the F_E_D's yardstick for measuring monetary policy which includes employment and inflation, this is something the market is not too happy with as it is an unknown replacing a known (an actual date), so if it seems the F_E_D has made significant progress in defining this new formula, the market may not like that, if they haven't the market may like that more or if there's some compromise that includes dates rather than just economic data as it comes.

Just a few key things to listen for vs market consensus.

AAPL Update

This is a very tricky one right now, actually everything is tricky because even as you may have seen at the bottom of the previous post (showing a SPY negative divergence in to QE3), there was still volatility, there was still a knee-jerk reaction to the upside and even though it was ultimately the wrong reaction as these almost always are, for a trade like many have going in AAPL (bounce), this behavior could be very material.  Therefore AAPL is tricky, but we can only use the evidence we have now, we can't make predictions and it's difficult even to assign probabilities with something like a possible QE4 being announced (even if you are right like we were last time, there's still enough volatility and knee-jerk price movements to change the nature of short term trades).

For now we aren't going to worry about the F_E_D and just look at AAPL, remember there are a couple of trends that we have been paying attention to in AAPL so I'll try to distinguish them from each other on the following charts.

 AAPL 1 min has a negative divergence on the open and an overall leading negative position.

 2 min is the same.

 5 min is actually the same

 As is the 10 min, they all look a little different, but all the signals are exactly the same through these timeframes.

I have been watching what I think is an AAPL base or support area that has been put together since about late September and I think there's a very high probability that there's a strong AAPL long, however this move being a part of that larger base, my opinion has been AAPL will have to make a new regional low before we get to that longer term long position.

For the bounce trade a lot of members took the trade with Calls on Monday and closed it yesterday with a great result, I'm not sure how many remain in that trade. The short term charts don't look that impressive and I'd say we are setting up for that move down soon. Of course F_O_M_C volatility could send AAPL higher , but I can't predict that unless I see some evidence of that which I don't see yet.

 15 min chart is showing a longer term positive being put together in the area, but if price came down as the charts above suggest it will soon and 3C remained positive we would actually have a bigger positive divergence, a stronger positive divergence and it would fit nicely in to the longer term trend I mentioned above that we have been following since September, it's just below...

AAPL 30 min with a relative positive divergence in to the lows, a leading positive divergence and even on this last move down it has stayed in leading positive position. A move in AAPL to new lows would not damage this chart and would likely put AAPL that much closer to the larger upside move represented here at this (I'll call it a "base") base or area of support/accumulation that stretches from at least from October to the present.

The QQQ has a very similar chart on the same timeframe as do several other important charts, but realize this is a longer term trend, it has taken a longer amount of time to put together and when finished (which may end with a downside head fake move-our new low?) should support a decent uptrend of some consequence.

As for AAPL's primary trend, I think there's too much damage and ultimately despite any strong counter-trend rallies that may appear, AAPL's destiny is more solidified than ever on the bearish side. Once again though, that is a trend even further out and a bridge that we will address when we reach it.

I am going to go RADIO SILENT unless something pressing or very important pops up (including emails) so I can pay close attention to the market and look for any signs of a leak as the F_O_M_C statement is only about an hour away and I think that's where all of my concentration needs to be at this moment to best serve all of the wolf pack.