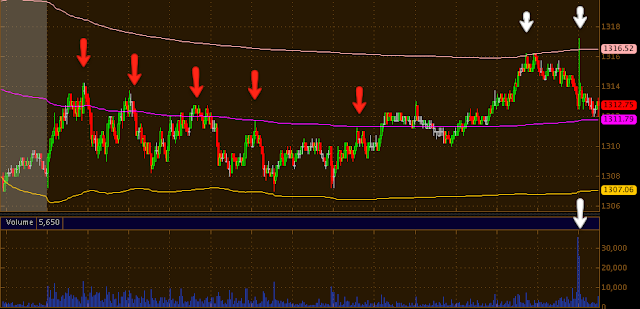
Here's the trade in ES on Friday with VWAP overlaid.
As you can see, it appears there was selling near VWAP all day Friday, the selling would knock price down and the market maker/specialist would work the bid/ask spread to get near the VWAP to move the next chunk of the order. Buying near VWAP would send pries higher with market makers/specialists working the bid/ask to lower pries back near the VWAP. All day we saw the market ignore the FX legacy arbitrage correlation that it has been following for weeks (the Euro was much stronger then the market relatively on Friday, yet the market for the first time in weeks didn't follow the Euro). The only break above VWAP late in the afternoon seems to have come on news of an Obama initiative announced later in the day on Friday to extend and expand a foreclosure relief plan. However even as ES price hit the upper VWAP we saw a strong distribution candle on heavy volume at the second white arrow.
As mentioned Friday, GDP did not only miss the 3.0 consensus, but higher consensus such as Briefing.com's 3.2 consensus and apparently their were whisper numbers even higher. However, the miss wasn't what was the bad news, the devil was in the details.
The advance estimate showed real GDP increased at an annual rate of 2.8% in the fourth quarter. That was below the Briefing.com consensus estimate of 3.2%, but the real focal point for the market is that the bulk of the increase stemmed from the change in private inventories, which increased $56.0 bln and contributed 1.94 percentage points to the fourth quarter change in real GDP.
Real final sales, which exclude the change in inventories, rose just 0.8% after a 3.2% increase in the third quarter.
The concern for the market is that the change in inventories will act as a drag on Q1 GDP growth since there is unlikely to be a build from current levels.
Upside momentum waned this week as the DOW posted its first weekly loss after 3 weeks on weekly gains. Furthermore the DOW has now seen 17 consecutive days of positive or negative moves of less then 1% which is the longest stretch sine December 2010.
Earnings have also become an area of concern. Earnings Analysts who once expected profit growth of 14.6 percent for this earning's season had cut their estimates all the way down to 6.8 percent by the time Alcoa kicked off earnings. Two days after GS made a long R2k call (usually a contrarian call), another unit in GS led by Dave Kostin reports that after trimming all of the fat from corporations, Q4 earnings have shown that margins are declining. The economy has peaked and is rolling over.
With 39% of the S&P having reported, positive earnings surprises are near record lows. With 195 companies having released, they represent 53% of the equity market cap of the S&P-500.
The percentage of firms beating consensus EPS expectations by more than one standard deviation (the definition of a positive surprise) is well below the historical average. The number of firms missing by more than one standard deviation is above the historical average. The ten year historical average of beat and misses equals 41% and 13%, respectively. So far this quarter just 24% of firms beat expectations and 17% have missed, and this on earning's consensus that were already significantly lowered before the season began (remember analysts lowered expected growth from 14.6 to 6.8% before AA announced).
As for the weekly performance of the 3 largest benchmark averages, The S&P-500 gained little over a point on the entire week (not a percent, a point) coming in at 1.34 on the week, the Dow lost 56 points on the week and the NASDAQ 100 gained 1% on week.
As we have been tracking, financials seem to be where the real trouble is as we have recently seen them go out of sector rotation. CITI (C) has proceeded with deep cuts to banker pay by 30% for overall compensation and some bonuses by as much as 70%. This follows earlier announcements by Bank of America and Morgan Stanley which said they would limit cash bonuses to $150K for senior positions.
This is bad news for the New York and NYC economy in particular as each banker job indirectly supports up to 3 downstream jobs. In other words between layoffs and compensation cuts, the immediate impact will likely be to leave New York City with hundreds of thousands of layoffs. Initial Claims should be watched for confirmation, but it is widely expected that they will go negative.
From a NYC comptroller report:
"The securities industry is critically important to the economies and budgets of New York State and New York City. It now seems likely that profits will decline sharply from last year’s level, job losses will grow, and cash bonuses will be smaller. Such developments would have a ripple effect through the rest of the local economy and hinder the recovery. In addition, tax collections are likely to fall short of expectations for this year and next year, complicating already tough fiscal situations for New York State and New York City"
OSC estimates that each job created (or lost) in the securities industry leads to the creation (or loss) of almost two additional jobs in other industries in the City. (The large income losses during the crisis have slightly reduced the value of the multiplier compared with earlier estimates.) OSC also estimates that each new Wall Street job creates one additional job elsewhere in New York State, mostly in the City’s suburbs. Based on these multipliers and the current level of Wall Street employment, 1 in 8 jobs in the City and 1 in 13 jobs in the State are linked (directly or indirectly) to the securities industry.
This chart shows the correlation between NYC financial jobs and the downstream Private sector jobs.
In addition, multiple Investor Sentiment Surveys are reaching extreme levels of bullishness, this has long been considered a contrarian indicator and even more so in the case of a sharp bear market rally, which is what I believe we have been in the middle of. The entire point of a bear market rally is to bring dumb money back in to the market to off load and set up large short positions, you can see them occur after nearly every major bull market top with the 1929 crash showing a significant bear market rally. It is my opinion based on studying bear market rallies and the bear markets proceeding them that there is a correlation between the extent of the bear market rally and the extent of the bear market (the "Bigger they are, the harder they fall' effect).
Here's the AAII Sentiment Index.
The long term average makes sense as most investor are inherently inclined toward optimism. Note how far the bearish sentiment has fallen from the long term average as well as a significant change from last week. THIS IS THE POINT OF A BEAR MARKET RALLY.
Here's the first bear market rally after the 1929 crash.
Here's the similarities between the 2008 top and bear market rally and the current market position. I won't get in to all of the similarities between the two periods, but I have covered them before and they are numerous.
S&P-500 2 day chart.
In addition, many of the averages have recently seen a Stochastics negative crossover from their embedded positions.
Dow-30NASDAQ 100
S&P-500
Another sign of waning momentum can be found on the weekly SPX chart.
A weekly Doji shows the loss of momentum this week.
The price Rate of Change charts also show similar findings.
Dow-30 Price Rate of ChangeNASDAQ 100 Price Rate of Change
Russell 2000 Price Rate of Change
S&P-500 Price Rate of Change
Several Breadth Indicators also show deteriorating breadth, (these could take up a whole post alone).
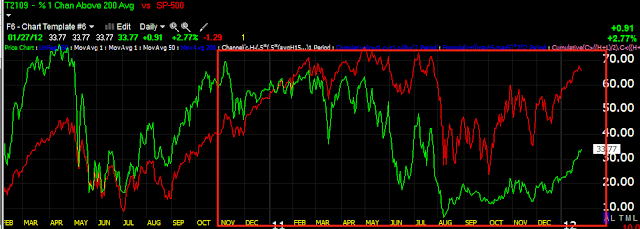
% of stocks 1 channel above their 200-day moving average. Clearly this metric (green vs the SPX red) deteriorated during the 2011 top, it hasn't recovered during this move.The same indicator, except it uses 2 channels above the 200 day moving average shows the picture in even more extreme terms as the market has rallied on thin breadth.
The long Term McClellan Oscillator has called several bottoms as well as tops via divergences.
Here's a closer look at the more recent activity in the MCO vs the SPX, it remains at a significant negative divergence.
The NASDAQ Composite's (all of the stocks trading on the NASDAQ network) Advance/Decline line easily pointed out the failure in A/D breadth at the late July decline with a divergence, now it is much worse then the decline of late July which was quite sharp.
Friday's Price / Volume Relationships also show some interesting behavior (recall that over the last week we have seen 2 consecutive days with dominant P/V relationships that were the most negative of the 4 possibilities, it just so happens this has also been the weakest week in a month).
DOW-30 component stocks, Interestingly we see the dominant relationship which also happens to be the hallmark of a bear market, Close Down and Volume Down, however, it should also be pointed out that 28 of the 30 Dow stocks declined on Friday with only 2 advancers, both in the most bearish P/V relationship of Close Up/Volume Down, not 1 stock closed with a bullish P/V relationship.
NASDAQ 100's strongest P/V relationship was also the most bearish.
The same is true of the Russell 2000, but in much more dominant fashion, meaning this P/V reading is even more bearish then the NASDAQ 100s.
S&P-500 also showed the most bearish P/V relationship.
As mentioned earlier, the point of a bear market rally is to sucker in dumb money, with bullish sentiment so high and the market losing momentum, smart money may want to act before bullish sentiment falls on a weakening of market momentum. While bear market rallies tend to be very sharp and convincing, downturns from them are even more dramatic as fear is a stronger emotion then greed, that is obvious in any market cycle, for example the 2003-2007 bull market gave back everything and then some in 6 months with the majority given back in approximately 3 months.
Thus far ES has opened lower tonight and back to its VWAP while the Euro has opened the new week's session down.
Have a Great Week!
Have a Great Week!


