Tuesday, May 31, 2011

LOL-That's all I can say.

As I mentioned in my last post, the idea is to get retail confident in the market, get them suckered in and leave them holding the bag. To that end, the CME just lowered, LOWERD margin requirements on the E-minis!

Here's the story

That'll certainly help them get over the $135 hump. If there's one thing you take away from this, it should be that all of this is planned out in advance, Wall Street is working several steps ahead of the crowd, we saw that Monday on the positive divergence when the market was breaking down, they were buying and what has the market done since then? Up, up, up....

S&P The Plan is Coming Together

On Thursday, May 19th, I talked about the probability of a good shakeout/head fake before the market moves lower.


Talking about the attempted breakout that day, that 3C revealed that particular move as "not going to make it", I said, " The 10 min chart is falling apart so if /when we do get an upside shakeout, I am just as certain now as I was then that this will be a head fake. So it seems likely if, and I would be surprised to see a reversal without it, they push through the upside head fake, it'll have to wait until after options expiration tomorrow."


 I've had that opinion since this triangle formed in the SPY.


 When prices broke down last Monday and fell out of the triangle, most traders would have went short then and there, I have maintained since then that the most likely outcome will be for the SPY to push through $135 creating demand in the market before the next and most serious leg down.


 On Monday the 23, the day the market fell out of the triangle, 3C 15 min had a positive divergence suggesting that the probability for the upside shakeout/head fake was still there. In the meantime we've been able to occupy ourselves with a few long plays to make some money in an otherwise very uncertain market.


On May 19th I also said, "This is all short term maneuvering for us and hopefully getting a little better positioning and timing on short positions and inverse ETFs., but still the bigger picture for now is the sad state the market is in and the very likely and ugly decline which should make us some quick short side money." The Daily MoneyStream chart above shows how bad a shape the market is truly in. As does the 2-day 3C chart below.


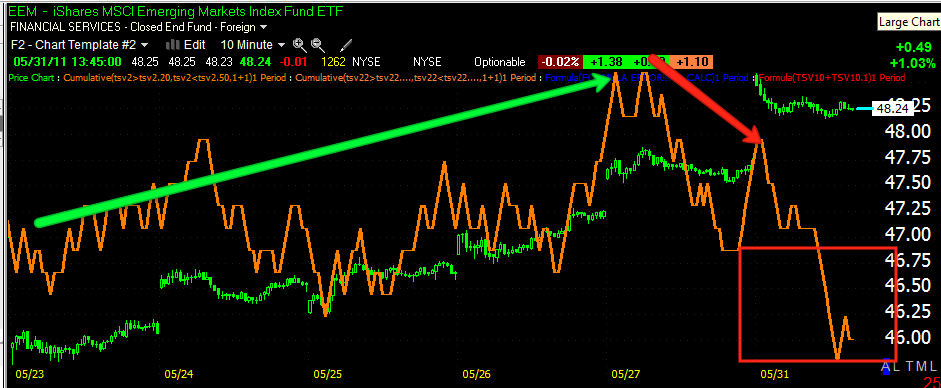
The concept here can be somewhat summed up in a chart of ADM.

There are several variations of the theme of false breakouts or head fake moves, above is the most simple. A large triangle is usually a top or bottom, depending on the trend in price preceding it, they are too big to be consolidations. In the case of ADM, it was a simple breakout which failed (head fake or false breakout), but what it did was create demand on the part of bulls. Most retail traders have an inherent bullish bias, some won't short stocks at all because of the misrepresented and overblown fears Wall Street has created, the reason.... most 401k funds are long only funds and to keep the massive 401k money flowing into those funds that are not allowed to go short, Wall Street created a stereotype of short selling and short sellers that is unfounded and based on irrational fears.

How often do you hear Cramer say, "This stock is a short!"?

Back to ADM, the demand that the breakout created allows Wall Street to short into that demand, when things fall apart, the long retail traders are left holding the bag and it creates a downside snowball effect as they book their losses.

The SPY shakeout is of a different variety, I call it the "Crazy Ivan". For new members, I get the name from the movie, The Hunt For Red October. It's a Russian submarine tactic in which they make a 180 degree turn to clear their baffles, their baffles are where enemy submarines shadow them as they can't be heard in the russian submarine's prop wash. The market pulls a similar maneuver to shake out positions long and short.

This is a bit more complicated, but the triangle is shaken out in both directions, a "Crazy Ivan".

Tomorrow we should see a move north of $135 in the SPY (it's already there in after hours trade), but will that be all it takes, a 1 day move? It's difficult to say. You have to understand the reason for the move to gauge how long it will persist. What needs to happen is Wall Street needs to make the market seem sufficiently bullish enough to attract retail traders back into it. Maybe $135+ does it, maybe a new high above $136 will be what it takes. Often the market will act more extreme then we imagine and we may very well see that. We may see a move that has us questioning whether a new bull move is taking place. Just remind yourselves of what the daily charts look like and how bad a shape this market and worldwide economy are in. There were signs of distribution taking place today, but remember that distribution takes place IN TO HIGHER PRICES, not on declines. Distribution which includes short selling, needs demand to take the other side of Wall Street's massive trade.

So far the idea has held up, even in the face of a market breakdown which by most measures would induce panic and follow through selling, especially in the delaveraging environment we find ourselves in.

So now is the time to start cleaning up speculative long positions, taking profits on strength, getting your short list together and above all, using the 1 edge you have over Wall Street, patience and waiting for the trade to come to you.

I can't say at this point what this is going to look like, but with the dollar starting to accumulate, I feel fairly certain that whatever bullish activity we see tomorrow or in the days ahead is a set up for a very bearish fall that will be coming next and that's the trade we are looking for-high probability, low risk. As I showed you earlier today, gold also is setting up for a move down, whether it will be to $145, $140 or a shakeout below $140, again it's hard to say at this point, but accumulation in the dollar is a hint that equities, precious metals, oil and equities are about to take a hit.

The market will tell us when to make out move. Until then, we'll be taking advantage of short term trades and putting together our list of the highest probability candidates.

If you have questions about any of this, email me. The concept is crucial to understand because it takes place every day in every time frame. Understanding how Wall Street operates will give you an edge that most retail traders still have not recognized.

SQNM Starting to come to life

It's looking more like $135!

UUP Update

For newer members, I use UUP as a proxy for the dollar as I don't have real time access to the Dollar Index intraday so UUP works out pretty well as a proxy.

 UUP showing accumulation around early may, note the negative divergence went on for a bit here and ended with another false breakout at the blue arrow, thus these false breakouts tend to be pretty good timing indicators as we can see accumulation or distribution underway, but can only really guess at how many shares were accumulated and at what rate they are being distributed. The length of the divergence and the timeframe it appears on can give us a rough guide, or when multiple timeframes align that's another signal, but the false breakout tends to be one of the more accurate. Right now the dollar appears to be under accumulation on a 30 min chart again. Right now it's rather small which would indicate a shorter duration move up, if it continues to accumulate, we can expect a longer duration move up.

 The 15 min 3C chart shows the end of the last accumulation cycle from early May, culminating with a false breakout in the blue box. Again, the 15 min chart now is showing accumulation, I call these "cycles"; the entire market moves in them, whether it's a monthly chart or a 1 min chart, the market is more or less fractal.

The 10 min chart shows more defined accumulation, this is how it works, it starts on the shorter duration charts and spills over to the longer duration charts. The bigger the divergence and the longer the chart timeframe, the more important the move.


UUP or the Dollar has an inverse relationship with most commodities, precious metals and equities.

Market Update

You've seen the longer term charts, you know what the disposition of the market looks like, here's a bone some of you short term traders may want to take a whack at.

 Just like our earlier positive divergence in one of the 4 averages tipping the market's hand, we now have 2 decent negative 1 min divergences and 1 that's taking some shape. The QQQ 1 min is negative and likely to see some intraday selling from here

The SPY looks the worst with a leading negative 1 min chart.

And the IWM is just starting to come along.

The Tick chart has fallen out of its uptrend and is starting to move lower as well.
Good hunting.

AAPL Trade

AAPL is looking like a pretty large top formation.

 MoneyStream on AAPL's daily chart in a leading negative divergence

 3C on AAPL's daily chart, another leading negative divergence.

 On a 15 min chart we see an accumulation zone, note again that support is broken by a small margin, but there was a volume spike there and a positive 3C divergence. Is the pattern starting to become familiar?

The 15 min chart right now has decent confirmation, for now...

 The 5 min chart is showing signs of distribution into higher prices, this is how it happens, they accumulate at a favorable price point and distribute a bit at  time into demand/rising prices.

Today's 1 min chart looks like some profit taking will hit AAPL into the close.

Don't be confused by the positive 15 min chart and the negative daily chart, the longer chart always trumps the shorter chart, but there are always bounces and counter trend moves, especially n the choppy volatility of a top.

I'd be watching AAPL for distribution, especially if the SPY can move north of $135.
At that point, AAPL may set up as a high probability/low risk trade.

CAT Short Trade

CAT and JOYG were in the Industry group "Farm Construction & Machinery" that  recently listed as one of the groups that has underperformed using some unorthodox metrics. In addition to that, CAT's chart is showing some serious problems as well.

 On the daily chart, this trendline actually extends back a bit, but the volatility in March-May has been a warning sign as this is typical top volatility. One thing you should always check when suspecting a top is how volume has behaved.

 To make volume analysis a little easier (you could use a moving average on volume as well) I created a simple custom cumulative volume indicator. A healthy stock should see volume rise on rallies and fall on declines, if you follow the white indicator with price, you'll see in the red boxes price rallied and volume declined, this is unhealthy. In the yellow boxes are the declines in price and you'll see volume shoot up, again, not  healthy volume. Don't overlook the importance of volume analysis, even in this low volume market environment.

 The longer 2-day 3C has shown pretty good confirmation, but we now have a negative divergence at the test of the highs. Also out Stoch/RSI combo indicator has gone negative, this is the first real RSI negative divergence during this trend. Typically we see tis at major tops.

 The 1 hour chart is a little confusing, but as usual, red arrows indicate distribution (negative divergences), white arrows indicate accumulation (positive divergences). One of the features of CAT that is so typical in the market now is that of the false breakout, you can see resistance at the red trendline and a false breakout at the blue arrow, 3C confirmed distribution into that breakout and CAT fell 17.5%  from there-the snowball effect.

 The 15 min chart shows a numeber of negative divergences and one positive divergence last week, in this case too CAT broke below a support level that was obvious at the blue arrows, thus again creating the false move/head fake that helped it move higher on a positive divergence or accumulation at the false breaks, and why accumulate there?

 Because there's supply. Look at the volume spikes as that support level was broken, it makes it a lot easier for Wall Street to accumulate when stops are being crushed. Again today another resistance level was taken out on the open and has since failed. This is just the way the game is played now.

And today's false breakout on a 1 min 3C chart? Distribution into the false breakout.

Cat may or may not have some upside from here, but it's looking like a good spot to start a short position on CAT.

Emerging Markets and China 25

These two tend to float with the market to a large degree, so I don't want this post to be about exact timing, but about the opportunity that seems to be emerging in shorting both E.M. and the China 25.

 EEM-Emerging Markets- As I said, specific timing here is a bit unsure, it depends largely on whether the SPY can break $135 in the next day or two. There's a decent resistance zone right under $49, that would also make for a nice head fake, whether we get there or not, like I said, they float with the overall market. I do like the idea of starting a position here. It should also be noted that there was a breakout today around the $47.85 level which has seen resistance 3 times and as recently as Friday, it's also loosely associated with an overall larger topping pattern as support, which has been broken.

 After a week of confirmation moving higher, this 15 min 3C chart went totally south today.

 Confirmation is also evident on the 10 min chart, with a leading negative divergence forming today-this is the worst kind of divergence.

 EDZ is the natural play to short Emerging Markets using an ETF. You can see the 15 min chart showed confirmation of the downtrend last week as we'd expect based on the charts above, and today a positive 15 min divergence. A 15 min divergence in one day is a strong signal.

 EDZ on a 10 min chart is in a leading positive divergence, the strongest bullish divergence.

 The 5 min chart went positive right at the open and is also in a leading positive position.


FXI-China 25
 This is an ideal breakout, as far as head fakes go, it not only took out the recent 2+ week range, but also the resistance (former support) of a topping pattern. A failure of this breakout should lead to a quick move down in this ETF.

 The 15 min chart has been in confirmation the last week or so and today went negatively divergent.

 While the 10 min divergence is there, it's not quite as strong as EM above, but you can see the last cycle down starting with a negative divergence, confirmation of the downtrend and today that has been interrupted.

This is the 15 min chart of XPP, which has more leverage as a short on the China 25, there's not much volume there so I don't favor it, but I am showing you because it displays the same 15 min negative divergence.

All in all, I think EDZ and FXP are very close to buys in this area. Of course risk management should be your first priority. I'm available by email as always if you would like assistance in identifying a stop that works for your risk tolerance.

VRML Update

If you have been in the VRML trade, today's you day! Up over 12% intraday and around that mark now.

 Daily chart and consolidation. It'll be important to watch volume today to decide whether or not to hold this for a follow through move tomorrow. In general stocks like this I tend to take profits at a double digit 1 day or two day move, they are market gifts and often don't last long.

 There has been a very big positive divergence in VRML that has lasted about 6 days so it looks as if there should be more upside in this one.

Thus far the 5 min chart is in complete confirmation of the trend.

If you are not using 3C, you can email me for updates, but I would suggest considering taking some profit off the table if volume doesn't pick up. You may also want to introduce a trailing stop. At this point a 10 bar m.a. on a 60 in chart would probably suffice, if it shows the kind of strength the 60 min 3C chart suggests is there, then we'll want to widen that stop in a little while to absorb any intraday consolidations.

Market Update

Friday I expected weakness today, here's what we look like thus far.... and I'll try to make this fit into the bigger picture.

 DIA 1 min showing some intraday improvement, we saw this twice last week in which 1 average showed a divergence and led the market while the others were late.

 The 5 min DIA chart is looking very bad, very negative here.

 And now the 15 min chart has gone negative in the DIA, specifically off the open or around the time the disappointing Case Shiller and more specifically the Chicago PMI which was horrendous.

 QQQ 5 min slight positive intraday divergence-the overall tone though is very bad with a huge negative divergence on the open.

 The 15 min chart is now in a leading negative divergence.

 The SPY 5 min has at least leveled off a bit and is slightly positive -most likely intraday, but again the opening divergence was very negative.

 And again, the 15 min chart quickly went to a very negative divergence, this is pretty big to be seen on a 15 min chart so quickly.

 IWM 5 min negative divergence on the open

Another leading negative 15 min divergence.

Remember, we are seeing the underlying action so even if the market manages to rally to close above the open, the negative divergences here are very strong.

The ideal set up for Wall Street on a downside reversal and this is what I've expected since before the plunge Monday of last week and why I've thought the market would not drop further in follow through selling last week, would be the following scenario...

Let me skip all the reasons, they are pretty clear between Europe and the economic data we've seen plus the end of QE2 and then some. Let just jump to the technical set up. The best case scenario for Wall Street is to force a false breakout above this triangle, today case close, I don't think close enough though. What we have today is a "kiss the channel/pattern good bye" which use to work very well as a short entry point. Increasingly over the last few years, reversals have been preceded by false breakouts, in this case we are looking for the macro downside reversal so the head fake would be an upside breakout from $135 up, the higher the better for Wall Street. Technicians on the retail side will buy a convincing breakout that seems to put this triangle into a null/void position, they think they are buying a new breakout and the start of a new move. This gives Wall Street the demand they need to sell short into, by now I'm pretty sure most of their actual position selling is done. When the SPY falls back below $135, all the longs are at a loss of a failed breakout, the lower the market goes, the bigger their loss, which creates the snowball effect and the market falls very fast, very hard. This is short of the opposite of a short squeeze ad you might call it a version of a bulltrap. While the distribution looks to be very heavy, remember that they (WS) distributes into higher prices, not on the fall. So a false b/o above $135 is the optimal situation for Wall Street and is still very much in reach,

USO

The 1 min positive divergence in USO has gotten stronger and this should be the upside move. The 5 min hasn't changed at all, although I wouldn't expect a change so early

USO Update

 USO's breakout today, Volume is still highly suspect which makes the breakout suspect as a possible head fake.

 The 1 min chart looks like USO will see a little intraday upside relief, but this divergence is very early in the making and not large by any means.

 The 5 min chart looks like today's breakout is a head fake, 3C failed to move to a higher high, thus we have a negative divergence right off the open.

 Worse yet, the 10 min chart of USO has moved to a leading negative divergence.

And the 15 min chart, although perhaps a little early to look at, is still not confirming the breakout.

At this point, for short term traders, I would consider using any intraday strength to try out a short on USO via DTO with a stop probably near the intraday lows.