Friday, July 17, 2015

VXX / UVXY @ New Leading Highs

I already posted actual VIX futures and strong positive divergence there so someone is buying a lot of downside protection. I felt comfortable with additional or full size UVXY long this morning, but since then it has only added more to it's leading upside divergence (accumulation).

Compared to the last bounce off the 150-day this area's divergence is much larger.

The Week Ahead

I'm fine carrying some downside positions in to next week, including Trade Ideas from this week including FAZ (3x short Financials), SRTY (3x short Russell 2000), UVXY (32x long Short Term VIX futures), SQQQ (3x Short QQQ), QQQ 8/21 $112 Puts, BIS (2x short NASDAQ Bio-Techs).

The EUR/USD which as a carry cross has sponsored this week's bounce along with HYG, some VIX smack-downs, is clearly looking to make a downside reversal.

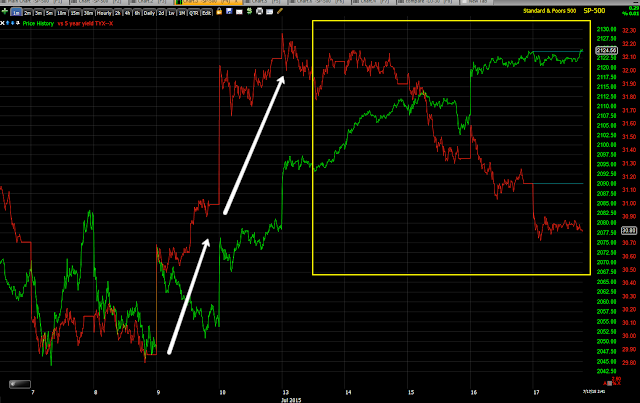
 USD/JPY (candlesticks) vs S&P E-mini futures (purple).

While the USD/JPY looks to be in line as the momentum of the bounce in everything other than the NDX has turned lateral to down, the $USDX and Yen futures are pointing to a clear change next week. I've gone through 9 different timeframes for each futures so it's impossible for me to get them all out, but these are some examples of strong timeframes and divergences that should lead trade next week to the downside.

The 15 min $USDX which was positive at the start of the bounce and leading negative now. This also has implications for both USO/Oil and GLD, both of which look pretty positive, USO a bit more than GLD right now, but I think that's just because GLD needs a little wider reversal process off today's gap.

Thus I have no problem carrying the USO long (call position) with 8/21 expiration in to next week the same with GLD, I just want to give the charts the time they need to put in a decent reversal with confirming signals before adding to them which is the same thing posted as the positions were put out this week as partial/spec positions.


This is the 10 min Yen Futures with a leading positive divgerence, thus with $USD negative and Yen positive, the USD/JPY should reverse back to the downside. I suspect this week has been used to close out the USD/J{Y carry trade and that's why those divergences are showing up so strongly as pros are able to close the carry trade at a much better price point than a loss which I suspect , after we break the SPX 200-day there will be no coming back for sentiment.

As for Index futures, it looks to me they need about a half a day to finish up, although that's a pretty specific prediction, but the charts are clearly negative.

I like to see the 5 min charts clearly negative before entering a position in the direction of the divergence. The Q's have been the strongest so their 5 min chart is probably the most important to me.
NQ 5 min timing chart is technically negative. By the time futures open and the cash market opens Monday, this could be a much wider divergence, but it's at a negative now.

As for the larger trend in to next week...

 Es from a positive divergence at the start of the bounce to a leading negative divergence, a typical cycle (bounce cycle).

 Russell 2000 futures also positive near the start of the bounce and deeply leading negative currently.

 I have mentioned several times that the Dow Futures seem to look the worst which is strange because at past market tops they have he;lld out the longest and been the best relative performer in a bear market.

This is the 15 min YM chart.

 This is the 60 min YM chart which shows no accumulation at the start of the bounce meaning it wasn't strong enough to print on the chart, but as I said before the bounce began, it would be a risk off bounce used to sell in to, the leading negative divergence/distribution is very clear.

 As for the confirming VIX futures, not VIX or even VXX, but VIX futures, they have an exceptionally clear and strong leading positive divergence (15 min)

And /VX 30 min.

Thus there's excellent confirmation between FX, Equities, Treasuries and VIX futures. I suspect we have some time early in the week to add additional positions, but I'm also  very comfortable going in to the weekend already holding significant positions. If we can add additional positions Monday, I'd do so, I don't think anything is going to change these charts which are far beyond intraday.

Otherwise, I spec with head fakes in, we are at the pivot to a downside move that eventually slices through the SPX 200 dma 

Let me get this out before the market closes


LEADING INDICATORS ALL UGLY

This has been a building trend as that's what leading indicators should do in a bounce that has a reversal process. The trend that we've been documenting the last 2 days is worse than ever at this point.

 Our SPX:RUT Ratio which is the companion indicator to the VIX Inversion which gave a buy signal last week for this bounce and has since fallen off sharply as seen last night. The SPX:RUT Ratio is now in its 3rd day of divergence at a new leading low on the 3rd day which is right about where the reversal process/head fake all began.


 HY Corp Credit which has typically been the first lever to be pulled is significantly divergent from the SPX, remember it's not the 3C HYG divergence, that's early warning that only we see, it's HYG's price.

 HYG leading the SPX earlier and now leading to the downside. As seen yesterday, the longer primary trend chart is close to a new primary trend low and much more dislocated than these closer/shorter term charts represent.

 Pro Sentiment which went positive for the first time since May at the lows, has refused to follow the market in to any risk on territory.

The same thing is happening with our confirmation Pro Sentiment Indicator, which is the exact same thing that happened at the last bounce off the 150-day SPX ma that failed.

 Again 30 year yields are leading the market lower at a new low after having supported it very early in the bounce.

And HY Credit once again is divergent at the top just as it was with the SPX bounce off the 150-day that failed.

Intraday, HY Credit looks worse today than it did yesterday, selling off in to today's price action.


I'd say we have pretty slid signals here for a downside pivot of this week's bounce.

Op-Ex Pin Should Be Ending

The 2 p.m. hour has past and that typically means the op-ex pin is ending as most contracts are settled, I don't know if you get the annoying constant calls from your broker regarding what you want to do with any option positions that are expiring on op-ex as I do, but if you do, you'll probably understand why the pin tends to end around 2 p.m.

This typically leads to the market doing just about whatever it wants, but the last 2 hours tend to give us some of the best 3C data of the week, sometimes in line with price action from 2 p.m. to 4 p.m., sometimes contradicting it.

The TICK chart alone shows that this concept is pretty accurate, take a look at the sudden change in the NYSE intraday TICK come 2 pm.

Suddenly it starts moving higher right at 2 pm after being in an ambiguous range all day.

If the initial indications of TICK hold up, I'll be looking to add to the IWM short/SRTY and/r IWM puts if they offer a decent discount.

Otherwise, I'll be starting to go through all of the Futures and Leading Indicators and may be adding additional positions so long as there's good confirmation for them, but speaking on a more broad basis, I suspect we are at or entering the final phase of this week's bounce which was forecast last week, to last through this week, inclusive of head fakes, reversal process, etc.

I'll have updates for you and/or additional positions as we go as well as the Week Ahead post.

USO Update

I still want to do my daily run through the futures which tells me a lot about trends that are developing such as the $USD/JPY trend that's losing strength, the same carry pair that has been near tick for tick during this entire bounce through this week.


As I pointed out in the last post, a declining USD/JPY may have implications for the board market and it lacking the support that has been behind it all week, but specifically the $?USD declining has implications on $USD denominated assets such as oil.

There's no perfect correlation between the two in legacy arbitrage terms because we have too much noise like the Iran nuclear deal which means embargoes will "EVENTUALLY" be lifted, but the market always seems to have an immediate knee jerk to something that's not really relevant from months or even a year.

The bottom line is that you can see, although not with perfection, the legacy arbitrage correlation between the $USD and the $USD denominated asset, oil.

 This is the 2 hour chart comparing the $USDX (US Dollar Index) in candlesticks to Brent Crude oil futures in purple.

It's not a perfect mirror opposite inverse correlation, but you can grasp the general concept.

 Here's a closer view of the same two assets on a 5 min chart

I still will be running through futures just as I do every day, but the last 3 days we have been seeing increasing probabilities of the market sponsoring carry pair USD/JPY starting to show stronger and stronger signs that it's going to make a move lower which means the $USD will move lower. While that specifically has a direct effect on the market, it's the $USD moving lower that has a more direct impact on oil futures/oil.

 This is the $USDX 5 min chart's negative 3C divergence.

 The $USD's 15 min chart with a positive divergence coming in to this week's bounce and a failing negative  divergence currently which is part of the USD/JPY signal more broadly speaking, but since we are looking specifically at oil, a decline in the $USD has a high probability of sending oil higher.

 $USDX 30 min negative

Oil futures...

 /Cl (Brent Curde futures) 1 min intraday showing the same intraday positive activity as USO.

 CL/ 7 min with a positive divergence in to today's lows.

 And the broader CL 30 min chart with a leading positive divergence in the area, which makes me look at this as a larger base rather than a short er gap fill bounce.

 The CL 60 min chart just reinforces that perspective.

USO charts...
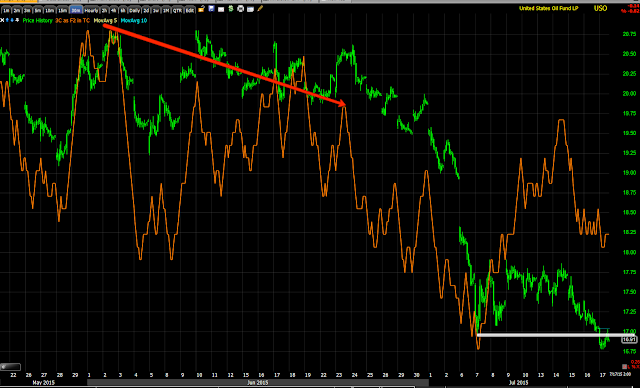
 USO's 1 min intraday chart has turned positive and since pulled back on a small negative divergence.

 USO's 2 min chart'd trend view, again it makes me look at this as more of a larger base area than just a bounce. The break below support would be right in line with a head fake move just as we have talked about this week for the broad market, just in reverse with a stop run rather than a false breakout, which is what it looks like we are dealing with to the far right.

 USO 5 min with a leading positive divergence today.

 And the larger view, like the 30 and 60 min Crude futures, the USO 30 min chart is leading positive at what would be a head fake move on a second low of a double base or a "W" base.

and the same thing on the 60 min chart.

To me it looks like longer term, although not primary trend. charts are developing and the USO position, Trade Idea: USO SPECULATIVE (Long) Bounce which is August monthly expiration, may in fact be worth adding to.

We have probabilities setting up nicely here, now I'd like to wait for extremely strong charts that are unambiguous, beyond simple probabilities , the kind of charts that jump off the screen. If I see those kind of signals, I'll be adding to USO. I put the probabilities of that fairly high, but I don't want to get caught up in this need for immediacy, I want to have the strongest possible position I can expect before adding to the position , even though I think it's a high probability add to, I want to be able to look at the charts and know that this is the strongest probability I can reasonable expect-  the kind I don't ignore.

We may see that before the end of the day, we may see that next week. There a chance that the charts are exactly correct and we miss the add-to position, but I'd much rather miss the trade than gamble on probabilities. Over hundreds of trades and years of experience, I think in the end, you'll be much happier to have relied on the strongest probabilities rather than to speculate on strong looking charts.

USO Quick Update

The speculative USO position entered earlier this week, Trade Idea: USO SPECULATIVE (Long) Bounce, somewhat like GLD (reasoning for spec. position size and what would be necessary to add to at a larger/full position size), appears to be improving.

Remember the $?USD legacy arbitrage in which $USD denominated assets tend to move opposite the $?USD and then recall yesterday, the day before and today's charts and updates that the $USd.JPY carry funded bounce seems to be ending with divergences in the $USDX and the Yen futures.

In this case the $USD/JPY is not as important as the $USD, however if the USD/JPY is to lose ground, it only stands to natural reason that the $USD loses ground and the legacy arbitrage assets like oil, benefit from the weaker $USD.

There are also some improving USO charts intraday as well. This is more of a heads up so you can take a look for yourself, but I'll be updating USO shortly as long as nothing more important pops up first.

GLD Update

Tuesday's GLD Call position , TRADE IDEA: GOLD (SPECULATIVE LONG) CALLS which I preferred at speculative size for the very reason cited in the post,


" leaving some room to reflect the speculative nature of the position and some room in case there's a larger reversal process."

As such, I'd consider the position an add to if there's a larger reversal process as a larger base can support a larger move.

This morning someone sold $1.4 bn in gold futures, that kind of a sale of course is going to drop gold prices, but the odd thing is this: put yourself in that position, even as smaller traders, would you dump a large position in to an illiquid market in extended hours/pre-market? I'm pretty sure you can guess what the result would be for your position's fill.

However I recall reading a story just this morning in which China, an investor who could afford to knock the price of gold lower, has been accumulating gold and just admitted it openly after not having updated their holdings since April of 2009 when they were at 33.89 mn oz. or approx. 1054 metric tons.

In a newly released update for the first time since 2009, China's holdings have vastly increased, here's the official release chart.
As you can see China has not been updating their gold holdings with every month this year reflecting 3389 (x10000) troy oz. until June in which the approximate 1054 metric tons of gold jumped by 57% to 53.31 million troy oz. or about 1658 metric tons of gold at the PBoC.

It's rather interesting that we get a $1.4 bn sale of gold futures this morning knocking gold down.

I've thought for a while that bigger picture, we are close to a bottom and upside reversal in gold, I've actually posted on it quite a bit the last 2 weeks or so. Apparently the Chinese accumulation of gold may be part of what we are seeing on some longer term charts in a not so direct way, but more of you see a shadow and you know there's an object there.

As for the potential adding to GLD calls on a wider base or reversal process as posted with this week's GLD post above...
This potential much larger base area had a small head fake move which is why the position was a partial position for a smaller anticipated bounce. Let me show a closer view of the chart...

This week's stop run with increased volume and a bullish reversal candle and today's deeper hit a bit lower, which I'd assume reflects stops/short sellers on large volume. I'd be interested to see what the daily chart's candle looks like at the close, but that's still thinking kind of small, what a 5-day candle looks like may be more appropriate, right now a 5-day candle looks like a significant stop run which would be in line or much more in line with a significant head fake move for a much larger base.

As I said earlier in the week, I wouldn't have a problem adding to GLD if it were forming a larger base, that's the reason it was considered to be a partial position in the first place as you can see above from the actual post.

However it's VERY unlikely we get a reversal on a dime without some lateral movement or reversal process and if someone is indeed interested in knocking Gold down to accumulate at lower prices, they aren't likely to finish that in a single day, but it does open up the supply needed at cheaper prices as volume above for today's daily candle shows. Despite any charts above and beyond the chart above, I think we can all agree that something seems a little fishy with a $1.4 bn sale in pre-market of gold futures as the Chinese 57% increase in gold is released. I believe it was Barcalys who was so interested recently in China's holdings as they saw a larger inventory as being supportive of gold, yet a $1.4 bn sale pops along.

In any case, this is certainly something I don't want to play "Hardy Boys" with and rather just let the charts tells us what's what which after today's intraday reset is not going to be within a few hours, but so far...

 The intraday 1 min chart confirmed the initial downside and then went relative positive sending price sideways rather than down.

The 2 min chart also confirmed the initial downside in to large volume and started leading to the upside. Remember this is still a 2 min chart.

As for the 3 min trend you can see to the left why I stayed away from gold for such a span, there was little more than downside confirmation, not divergences/opportunities until recently when I started covering gold again a lot more often. The thing I'd point out about the 3 min chart is by this time in the day, if it were going to see damage, it would have done it by now, rather it's join the same leading positive divergence as it was when I posted, TRADE IDEA: GOLD (SPECULATIVE LONG) CALLS.

I'm not going to make a rash decision on GLD right now. I would like to see something like a bullish Hammer on the closing candle today and maybe we get that, maybe we don't, it's not crucial to the bigger picture, but would potentially be helpful to the near term and deciding whether or not we have enough of a reversal process to make adding here worthwhile , in fact to make adding at all worthwhile. So far so good, but again, it's a big mover, a big number and it's not going to resolve in a few hours.

I'll continue to update as new data becomes available or the position becomes actionable. Right now I'd expect it to move more laterally and get itself in order after this morning's move.


NFLX Follow Up

This is an follow up to yesterday's NFLX Update, the bottom line if you compare yesterday's charts in the exact same timeframes to today or simply just look at today, NFLX is seeing further deterioration.

 I figured no need to annote the charts. 1 min

 3 min

5 min

MARKET UPDATE

It looks like we are at or pretty darn close to our pivot considering today is a monthly options expiration day/pin. As far as this last bounce off the 200-day moving average, I will admit I was a little surprised considering how strong of a counter trend move it has been (which is what I've been talking about for 6+ months-counter trend moves being some of the strongest you'll ever see because they need to be in order to be convincing) to see the breadth charts last night. I thought they'd probably still be well within deterioration, but probably hit their highest high of the year which is still not to say much for them, but when seeing these...(with last night's commentary below)

"The Percentage of ALL NYSE Stocks Trading ABOVE Their 40-Day Moving Average. In a normal, fairly healthy market this average runs around 80% , it hasn't moved above 60% this year and has been as low as 20% with a current reading of just over 40%, so despite a head fake move, a short squeeze, a week long bounce that has been the best bounce of the year, the Percentage of ALL NYSE Stocks Trading ABOVE Their 40-Day Moving Average has refused to make a higher high (green).


The Percentage of ALL NYSE Stocks Trading ABOVE Their 200-Day Moving Average vs the SPX (red) which usually runs around +70% in a normal market. Not only is the indicator making a series of lower highs and lows, but is at the lowest high pivot of the year."

I'll admit I was surprised, but in a good way, in a way that tells me that we have been on the right track . For those of you who have seen these charts over a 2-3 year period, you know just how bad they are overall, at less than half their normal readings, but more specifically through the year of 2015, the series of lower highs and lower lows even with this last counter trend bounce, was good to see.

As for intraday, there's a feeling of an op-ex pin on a monthly expiration, but as I also posted earlier today, there's also a pretty ugly feeling on a day that is otherwise pretty boring until the afternoon (after 2 pm usually).

 The dispersion between the averages today is somewhat interesting, take the DIA above vs the QQQ . The DIA as I have been saying the last few days has had some of the worst looking charts and I suppose it's delivering on that today.

As far as the bounce cycle goes, from stage 1 base to stage 2 bounce/mark up, stage 3 top with a head fake move, I have to say the 3C chart is textbook for a cycle, especially as we get in to what looks to have been the head fake area, with strong confirmation in the leading negative divergence.

 The SPY intraday looks to be mostly in line, I suspect this is the op-ex pin.

It too has an interesting chart with the first accumulation area and the first head fake below the 200-day which was NOT accumulated, which is why we waited rather than enter new positions. Yet again the stages here look pretty clear, the divergence looks right for them, but when you consider the Breadth charts I started with and why they look so bad, all you have to do is simply look at this very same 5 min chart in context since the May SPX head fake failure.

This is the exact same 5 min chart in context of the trend. I marked the bounce off the 150-day which failed and sliced through the average and now the bounce off the 200-day which should have a more serious psychological effect when it cuts below the 200-day.

 As for the Q's they still have not made any move toward confirmation of that gap.

The IWM however may be one of my favorite charts, whether the best performer or not I'm not sure, but one of the nicest , textbook plays of our concepts.

Intraday it looks to have found some light support, after all an op ex pin can't have the underlying asset sliding too far from the max-pain level.

Looking at the IWM's cycle, it's not the strongest head fake move, it was the day we were looking for it and the 3C confirmation through the bounce cycle again is looking excellent.
If the IWM would bounce a bit intraday, I'd like to add to the SRTY long  and/or perhaps a put.

 As far as it's chart in context...

 The intraday NYSE TICK fell off today since yesterday (white vertical hash mark).

And the overall Custom TICK Indicator shows breadth falling apart, I'm not sure if it's easier to see with nothing drawn on the chart or with some reference points so I put in as little as possible.

This is the overall TICK custom breadth chart since the bounce.

So far I'm pretty happy with the way the charts have been moving. Counter trend moves and head fake moves are almost always going to be very impressive, they have a job to do, but that's also what makes them so lucrative to trade.

Right now it feels like the max-pain op-ex lull so we'll keep watching for additional opportunities.