Thursday, March 13, 2014

EOD Divergences

It seems that the VXX move and signal I'm looking for is still on the table as the market did as I expected earlier and transitioned from a downtrend to a lateral or sideways trend and in that range built positive divergences, in fact I believe we have our first 5 min positive of the week for the averages, but this is nothing to panic about as a short.

Take a look... This is why I was going to add to the QQQ or IWM call/Hedge March positions, I think they'll do well over the next day or two and that's really about it.

VXX...
 VXX leading negative, this is what I need to get the signal I'm looking for and confirms the charts below...

 IWM 1 min today

IWM 2 min

IWM 3 min

And for the first time, even an IWM small 5 min positive in to the "W" base this afternoon.

 QQQ 1 min

QQQ 2 min leading positive

QQQ 5 min also the first time this week, but it's not large and not a concern for puts/shorts.

SPY 1 min

SPY 2 min

SPY 3 min

So as you can see the underlying market trend was accumulation in to today's lows, this is what we needed and there will continue to be volatility and ups and down, but nothing has changed since Friday's expectations for this week, there are no divegrences that threaten anything considerable on the upside, but there may be enough to get that pivot signal telling us right before we move to a primary bear market, keep an eye on the VXX.

Carry Trade Rotation

There are 3 general or popular carry trades (there are many others including Chinese Yuan based trades) that are all JPY based, the USD/JPY, AUD/JPY and EUR/JPY and pretty close to that order.

The continuing economic weakness, destruction of credit markets and credit creation, banks hoarding money and the absolutely dismal macro-economic data coming out of China is one of the biggest global market causes for concern, but most traders have no idea and are literally in my view, "Whistling past the graveyard" just as they did with AAPL over $700 and Gold in 2011, despite clear signs to the contrary, we did it here in the US too, I knew there was a housing bubble in our area as early as 2003/2004.


Here's what I have, we'll look at all the pairs and their individual currency futures.

 This is the AUD/JPY vs Es (SPX futures in purple) on a 1 min chart, you can see there's a tight correlation there, but not quite as tight as it should have been at the very right side of the chart when this was captured at 3:22.


 This is the 5 min chart, I believe some overnight Chinese data played a role as the $AUD is VERY sensitive to China, in any case you can clearly see that ES underperformed the correlation right at the second (higher) high and things went down from there, the correlation to the left is actually better than it looks, the scaling on this platform in comparative analysis is not very good.

This on the other hand is the 1 min USD/JPY vs ES, there seems to be a much better "general" correlation in the pair including to the far right so this is probably my second choice for the Carry trade the market links to.

This 5 min chart of USD/JPY vs ES shows ES outperforming a bit, but the highs are about equal.

 This is the EUR/JPY 1 min and the overall and specific market hours correlation are very good, I'd say they are the best which is a bit strange considering what Mario Draghi of the European Central Bank is up to.

On the 5 min chart there's not as good of a correlation, but we are really not so concerned with the recent past, we are concerned with what it will be moving forward so we know where to run our analysis, there's no point of looking over two currencies that have very little correlation with Index futures.

Now for the pairs themselves...
 AUD/JPY 1 min 3C isn't giving us much.


 USD/JPY is giving us better divergences, more importantly it's showing a positive in the area where the averages have been working on an intraday lateral base.

Interestingly the EUR/JPY is also giving us a positive divegrence in the area in which the market is working on a base.

I say interesting because CHINA has been devaluing the Yuan and specifically "Diversifying AWAY" from the $USD and they've been buying a lot of Euros, that means selling the $USD and ,buying Euros' what do you think that does to the EUR/USD pair ? Remember the first ticker is the long in the pair and the second the short, so if the Euro goes up and the $USD down, the EUR/USD goes up. With supply available of $USD's from China selling and demand high for Euros with China buying, the EUR/USD just hit a 2 year high that hasn't been seen since October of 2011, it was at $1.3966, now it is at $1.3866.

Mario Draghi, the chairman of the European Central bank obviously does not like the currency rising as it makes exports more expensive for countries to buy European goods, but he's been unwilling to debase like the US or Japan through outright monetization of debt such as QE which is the equivalent of a printing press, however he did come out today and try to jawbone the EUR down from these highs with some statements about price stability, preparing "Non-Standard" measures to guard against deflation and that he was ready to take "FURTHER ACTION" if need be, this dropped the Euro a bit so it would not seem like the most likely candidate to be the leader of the carry trade, however currency traders have to keep in mind China is taking action, Draghi is jaw-boining and the half life of their jawboning the currency lower has had a very poor record.

Don't forget, China has essentially taken Russia's side on the Ukraine and Crimea which is coming up for the referendum vote this Sunday, they also talked about trying to create a new world reserve currency which has always been the role of the $USD, it may not be the axis of evil, but it is a powerful economic axis. I imagine traders have to take all of this in to account, FOR MY PART I HAVE AN EASIER JOB, I NEED TO DETERMINE WHAT'S ACTUALLY HAPPENING UNDER THE SURFACE OF PRICE MOVEMENTS WITH 3C.

That being said, lets look at individual currencies...
 Here the 1 min Yen is seeing intraday negatives at the same time the market is trying to make positives and was/is doing so, the importance here is no matter what pair takes over, the JPY is a part of all 3 so a negative divegrence and eventual lower prices in the Yen will be supportive of whichever carry pair is in control and it will give support to the market,. PLEASE remember though that the Yen's longer term 15, 30 and 60 min charts are very positive which means the downside market pivot is very likely and the longer term Yen charts are confirmation of exactly that.

 In the meantime the 5 min Yen is also showing a negative divegrence (I started the divergence after the new contract).

The 1 min $AUD for its part has a relative and a very small leading positive divgerence in to the EOD US markets.

 The 5 min chart has a relative negative divgerence and a leading negative, this isn't good for the AUD/JPY if both have negatives, the AUD needs to rise and Yen fall for the pair and Index futures to rise so this is why I'm thinking the AUD/JPY is likely to slip out of the favor it has found this week.

The Euro on the other hand has a very nice looking 1 min leading positive divegrence and even after Draghi specifically tried to knock it down, it appears traders are just picking up at a discount.

 The 5 min negative across is not surprising given the Central Bank knee jerk effect with Dragfhi out today trying to bash the Euro below or the EUR/USD below $1.39, however EOD we have in line and that's what is important is moving forward. This is a better chart than the 5 min AUD's leading negative.


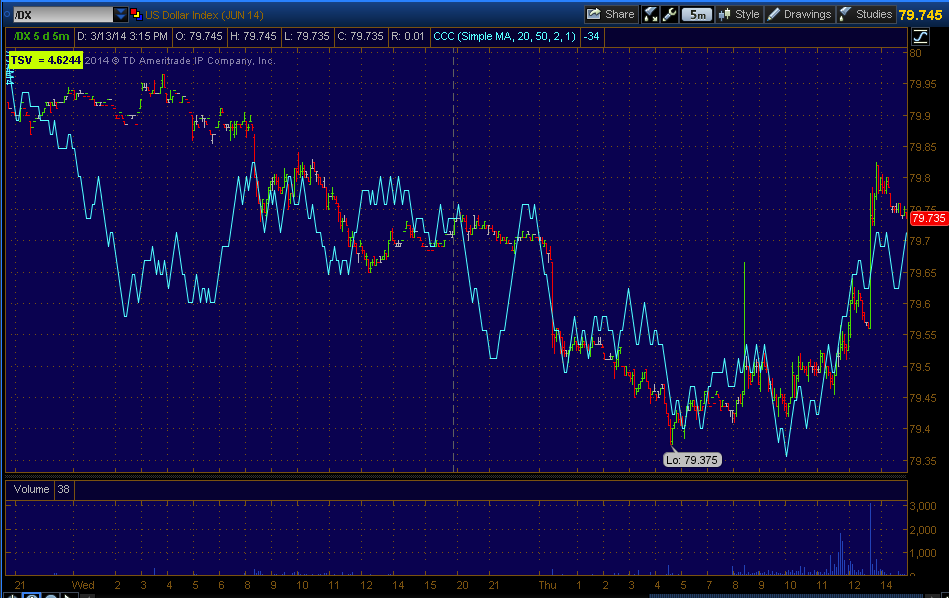
The $USD for its part is in line on the 1 min.

It's also in line on the 5 min with a small reversal process, but no divergence.

This is why I give a slight edge to EUR/JPY MOVING FORWARD, but USD/JPY may come back to lead, it just depends on how aggressive China is in selling $USD reserves. Otherwise, traders may feel China's wallet means more than Draghi's lip service and the EUR/JPY may be the Carry Trade of choice moving forward.

I'll keep an eye on this because there's a lot of leading indications at crucial points the carry trade can give us.


Could not get off QQQ March Call /Hedge Trade off in time

That's fine, it really wasn't that important, it actually is not important to have a hedge there at all, if my account were smaller and transaction costs played a role, I'd be just as happy sitting through the market with my shorts intact rather than trying to hedge anything, but I try to give you as many ideas as possible because some people will like them and they will fit their style and some people would rather wait for something else.

In this case the prize has been and continues to be getting off shorts at the exact right time in or just before a market downside pivot which is what our focus has been this entire week.

Sometimes the best course of action is just to be patient or as my favorite, Jesse Livermore-World's Greatest Trader" once said, "It was never my smarts that made me money, it was my sitting. There were a lot of people who were right on the market, but to find a trader that is both right and can sit tight is a rare thing" (paraphrased).

I'm going to show you the carry trades and we'll see how they progress, but I anticipate a change judging by the data I see right now.

Filling Out QQQ March Monthly Call/Hedge Position

Obviously I think the market has enough strength to move higher from here tomorrow.

Cary Trade SWAP Looks VERY Likely

I'll get the numerous charts I've collected out and in the next post, but the change from USD/JPY to AUD/JPY this week looks like it is going to change again, the first candidate r most likely candidate in my view as of the information now is EUR/JPY, the second most probable is USD/JPY, this is another sign of Chinese trouble and some other things that I'll go over, but if you are like me and many of you are in this respect, you are watching the carry trade, I'm going to give you the data, but I think EUR/JPY is going to rotate in which has been quite a while.

Market Update: Looking Stronger

Of all the averages, it's the weakest over the week that is now looking stronger, the SPY and I do think the volume surge was short term capitulation for an intraday bottom.

 SPY 1 min massive improvement, still ONLY a 1 min chart.

The 2 min is seeing migration for this bottoming process.

 Even the 3 min chart is now showing a little positive divergence.

The QQQ 1 min continues to build.

 The QQQ 2 min is leading positive, although small and a short timeframe.

And a relative positive QQQ 3 min

 The IWM which was in line has a 1 min positive, the trend in price has clearly changed to lateral as suspected, this is likely an intraday base reversing this morning's price action.

IWM 2 min is about as far as that one goes.

HYG has seen intraday repair so it looks like they WILL USE HYG to support the market.

The 10 min chart is still positive so this could continue in this odd shake and shimmy, but the 5 min chart has seen a lot of damage that was not there before.

VXX / UVXY has a negative as it should have to confirm everything above.

I haven't changed any plans, I still have QQQ/IWM calls that are much smaller and only 5% or so of what is otherwise bearish shorts/puts so it's a small hedging position.

I would not increase the size as I do have room unless I saw something that looked a little more serious, this is still just jiggles as we have seen this week.

VIX Futures and VXX

Generally the VIX futures are confirming intraday charts such as what I just posted, they are also showing some more strength that has been accrued (the opposite of distribution accrued this week in the averages), however, I'd still like to see the VXX/VIX futures move toward the low end of their range and send up huge leading divergences, there would be no better timing signal than that, but we have to follow the message of the market as it is and not as we'd have it, however that scenario is not ruled out either.

 VIX futures intraday (and this is all we have been really concerned with today, it's clear there's significant weakness throughout the market and there was nearly a week for migration of the Friday 1-2 minute positives to move to longer charts and form a substantial base that could put in a decent rally or bounce, even though we did not expect that, I really did not expect that the migration process would not proceed beyond 2 or 3 min charts at the max and certainly did not expect to see this accrual of distribution. The point is, anyone who might have been worried that we were going to see another February style bounce which we knew to expect before hand because of the signals, as I have been saying all week, "We are nowhere near that kind of situation")...

VIX futures move opposite the market and thus the Index futures and averages so a negative divegrence here is MORE confirmation of the intraday probability of the market making a turn sideways from its early downtrend and then likely making a turn back up. I don't have any reason to expect any kind of strong bounce at all, this is why the hedging long call QQQ/IWM options were originally going to be so short(I was looking at weekly this week, but was reminded of my rules to always use at least 2x the time you think you'll need and glad I did). These were also and are still (even with yesterday's add to) much smaller than a normal option position, they were simply meant to hedge any short term loss of profits in Puts until the puts started working for us again.

The point above is we have confirmation of the last 2 posts.


 VXX 1 min shows the non confirmation of its gap down, the exact opposite of the non confirmation of the market's gap up this morning, however since it too has put in a small negative divegrence that should send the VXX lower intraday so that's more confirmation.

 The 2 min chart, like the averages, is in line so there's not much to learn from that yet other than to know where it is so we may see if there are any changes as the day moves on.

The 3 min chart is in line, this is stronger than the market averages that have had a lot of trouble even getting a 3 min positive so this makes sense and is a reflection of what we have seen all week, despite 1 , 2 and some 3 min market positives, the bigger picture as shown earlier on a 5 min is the accrual of distribution, that's what the trend is under all of these small intraday steering divergences which is what I'd call the current situation in the market, a steering divegrence trying to get the averages back up where they'll likely see even more distribution.

 The VXX 5 min chart has a sharp leading positive divegrence, but it is not as sharp as it can be and that is what I'm ultimately looking for in calling a market pivot to the downside on a primary trend basis, so I'm hoping we still see that, this was the premise of Friday's analysis for what to expect for this week.

On the same 5 min chart of the SPY, you see it is leading negative, this is the accrual of distribution rather than the more typical migration process, instead of the market building a short term base/bounce area it is just distributing in to any strength (like this morning's gap) that it can.

PLEASE, PLEASE DO NOT FORGET, THIS IS THE PRIXZE, THIS IS WHY THE MAJORITY OF POSITIONS ARE LEANING SHORT, THE 60 MIN CHARTS IN THE AVERAGES SAW INCREDIBLE DISTRIBUTION THROUGH THE FEBRUARY RALLY/SHORT SQUEEZE, THIS IS IS COMING HOME TO ROOST AND IT WILL BE SENDING THE MARKET DOWN.

This week has been all about looking for the specific pivot point in which that happens.


Market Update

Index futures are really flying intraday so I expect we'll see more of a lateral trend form here, likely building a little accumulation pocket and sending the market at least up to this morning's range, perhaps higher, but this will depend on the divergences building more. We are already seeing some change in intraday trend and volume has increased as in a short term capitulation (bottoming ) event.

In addition the $AUD is going positive and the Yen negative intraday which should send the AUD/JPY pair higher which is what the market is tracking, even though there was obvious relative weakness this morning after about 2 days of following the pair tick for tick, but this seems to be another event suggesting we will see an intraday bottom and upside reversal in the making.
 Intraday $AUD has a small intraday negative at the highs of the week and now we have a clear positive divegrence which is confirmation of the positives in Index futures and the market averages that you'll see below.


The Yen did not have that much of a positive divegrence, I take it this was more AUD centered and likely directly centered on China. The negative divegrence in the Yen confirms the $AUD positive above and all of the positives below for the scenario I described above regarding a probable reversal back to the upside.

Remember it is AUD/JPY meaning AUD long and JPY short so that's the direction each currency needs to move for the pair to move up and support the market. Please do not forget though that I'm talking about SHORT term analysis of the situation right now, all this week the market has proven itself to be VERY weak, thus my main positioning is still largely short with inly two hedging longs that would be fine at a total loss as the Puts would make so much more money.

ES 1 min leading positive divergence e(SPX)_ intraday

 R2K futures intraday with a strong leading positive

NASDAQ futures intraday also leading positive

 QQQ 1 min positive and a larger push of volume which is usually seen at a short term bottom.

IWM was in line at the last update, it is now starting a positive as the trend starts moving more lateral from down, also a little volume surge near the lows.

SPY is showing the same positive divegrence and a volume surge near the lows which is part of price/volume analysis, it typically acts like a short term oversold condition which is what I think is happening now.

DIA is going positive as well.

So we need to see more sideways movement before we'll see a move to the upside, this is also where the divergences have a chance to strengthen.

The AUD/JPY is confirming as well as the single currencies all of the index futures and market averages so this looks high probability, but we are still very early in the process.