Friday, July 1, 2011

Internals

Short covering confirmed, "NYSE short interest for the week ended June 15 was the highest in 2011, at 13.5 billion shares, a jump of 333 million share in two weeks"

 DIA 1 min

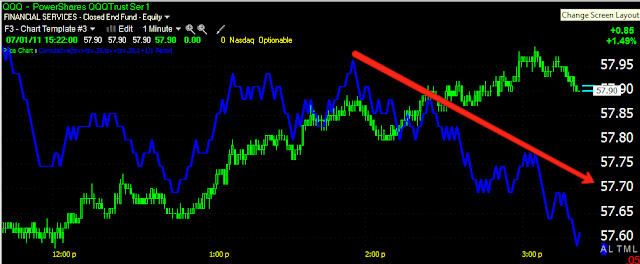
 QQQ 1 min.

 SPY 1 min

 Intraday Momentum Index (QQQ) 1 min

 Intraday Momentum Index (QQQ) 5 min
Advance/Decline Ratio (NASDAQ 100 components) 1 min.

Market Ahead of the 4th

Usually on Friday's day traders and momentum traders take profts in the late afternoon, they don't want to hold postions over an uncertain weekend, ever more the case wth long weekends like we have this week.

 The trade today has stuck to the 1 min 50 bar average, which is pretty incredible and suggests we are seeing further short covering (whenever a market rises like this with few pullbacks and no substantial pullbacks, it's ether being manipulated by HFTs or it's short covering, this morning we saw a very obvious round of short covering as the multiple trendlines I mentioned were broken to the upside.

 Right now some sell-sde volume is picking up-day traders usually start closing positions around 3:30.

The TICK Index which has seen a steady uptrend today just broke that trendline to the down side. I'd expect to see some profit taking in to the close. The only question  have is whether institutional money also pulls some out with the long/unpredictable weekend.

FXA

FXA, an ETF for tracking the Australian Dollar was helpful in that it often has a leading relationship with the market. When the SPY looked like this...

it was a very edgy situation, the market could have broken to new lows almost any day. The long term 60 min 3C chart of the SPY was positive and it's what kept me believing we would see a bounce of some significance as we have over the last 4 days. However, the FXA also showed better relative strength then the SPY which as a leading indicator was another piece of the puzzle pointing to the bounce theory.

Here's the FXA now...
Although the last time I used it as piece of the puzzle, it was over a much broader period. However, when I first showed the relationship of FXA and the market, there were numerous examples of longer duration and shorter duration. Above the FXA is in green and the SPY in red. One of the points of a bounce in the market was to cause a short squeeze and set up short positions. This morning we saw a short squeeze as the SPY crossed multiple trendlines (resistance)-laterally and the downtrend line. Note how the FXA didn't put in a strong day yesterday and today while the candle looks strong, the % gain and position is out of sync with the market, once again hinting at a piece of the puzzle in which the relationship between FXA and the market is often a leading indicator.

I'm not saying I think the bounce is over quite yet, but we are seeing several different signals and are at an area in which we want to pay close attention for a reversal.

USO Update

Yesterday I showed you USO bumping up against resistance with negative divergences and suggested USO would pullback, that happened this morning, although not quite as deep as  had though (I was off by about by about $.41), but it still pulled back nearly a point.


 This morning saw a healthy positive 5 min divergence right on the open and USO has been trending higher since. I'm not sure USO will crack resistance today, but....


The 60 min chart looks pretty darn bullish and I do think USO will break through resistance to move further north shortly.

Trade Idea-CNQR (short)

Here's another to add to your watchlist, CNQR.

 These two charts are long term 5-day charts to filter out noise and reveal the trend.  This s a 50-bar average.

Here we see the complete trend since March of 2009 through a linear regression channel, obviously something has changed for the worse for CNQR as it had been trading in the upper range of the channel until a recent breakdown. MACD has shown a consistent deterioration in the momentum of the trend and is now negative. This scenario falls under "Kiss the channel goodbye" and I'd personally like to see CNQR trading just inside the channel, somewhere around $53  or so, at that point (if it makes it there), we can look for negative divergences setting up the tactical entry. It's a significant thing when a 2+ year trend breaks its channel.

EMR Trade Idea (Short)

 EMR s another good candidate in an industry group that is experiencing a margin squeeze. I like the top, the break of the top and the typical rally after the break, it's a mature set up, you just need the right entry.

Looking at the 50-bar weekly chart, this trade would get interesting on a break of the moving average around $55, last time volume swelled. We may be able to get a better entry while it's above support on a strong negative divergence. Just another to put on your watchlist.

FDX Possible Trade Set-up (Short)

I'd put FDX on your watchlist and set an alert for a breakout above $96.90. This set up would come under the "False breakout" category.
It happened once in Feb, 2011 and a smaller one on gap resistance in late May. You can see the current trendline, watch for FDX to cross above that area, we can look for a 3C divergence at that point, or just enter a short if the breakout fails and falls back below the trend line. This can happen over the course of several days like t did n February or it can be a 1-day event, breaking through and then dropping back down below.

SCON Follow Up / Swing Trade Management

On 6/23 I posted SCOn as a speculative long idea.

Here's SCON now...
So far it's done fairly well.

Lets look at some trade management and part of this picks up from the AAPL post last night.
 Depending on your outlook and trading style, sometimes a trailing stop is best.

 For a swing trade, we have an entry here when SCON has started a new uptrend, (higher highs/higher lows).


If you feel there's a decent probability of a good swing trade with at least a 10% target or potentially a trade developing in to a trending trade and you have a significant enough profit to guarantee a break even trade with this method, you might want to consider the concept above.

Our signal candle is always the last candle to make a higher high/higher low, today may qualify as it has made both, but until the close, we can't be assured it wont make a deeper low, canceling its status as the signal candle, so for now, the signal candle is 6/24. The next 4 candles could be considered a consolidation, but for purposes of this concept, the candles are unimportant and considered to be noise within the trend.

The low of our signal candle is at $2.25, none of the proceeding 4 days made a high which is lower then our signal candle's low at 2.25 (Day 1=$2.38, Day 2=$2.26 Day 3=$2.29, Day 4=2.32 and today=$2.47). Since none of the proceeding candles have made a high lower then our signal candle, the trend is still in effect.

This methodology can be used on any timeframe you choose. For longer term investors, you can use it on a multi-day chart, such as a weekly. You can use it for intraday swing trades on any timeframe, such as 15 min or 60 min.

This methodology can also be helpful in analyzing the market.

Some swing traders will take total or partial profits on the first noise candle, which in this case would have given you a break even trade.

It's important to remember, a change in trend is almost always preceded by noise candles, but many times they are also just consolidations.

Here's GOOG as an example, GOOG reverses the uptrend, starts a new downtrend. The cover day posted a low which was higher then the signal candle's high, causing you to cover. In white a new swing uptrend is in effect.

This obviously works best in a trending market, it can be useful now in looking at the longer term trends on a multi-day chart and for trades intraday. These techniques do not have to be a stand alone trading system, obviously things like divergences may give you early warning to get out or enter sooner or trailing stops may play a part. However, understanding the concept is important as I believe we will be entering a market in the near future that is less choppy and a good fit for methodology like this. As always, take what you find useful and discard the rest. It may fit well with some of your current trade strategies.

SPY Update

The U of M Consumer Confidence which was expected to rebound came in this a.m. at a miss.

The ISM Manufacturing report came in at a huge beat, likely the cause of the push through resistance.

 SPY breaking resistance today

 This looks like short covering

There's still a negative divergence in the 1 min here.