Monday, November 3, 2014

Daily Wrap

While a lot may have seemingly stood still today right from the start as USD/JPY launched higher around 5 a.m., but as we suspected in Friday's "Week Ahead " post, we'd see early buying from weekend warriors seeing price action and feeling the emotion of greed and getting in on early action either before work or on orders placed before work, ironically right around 8 a.m. as pre-market opened, SPX futures quickly caught up with USD/JPY which was on a stop run hunt today with stops hit around 10:11 a.m. at the psychological level of $114 and then intraday / multi-year highs around 11 a.m., although ES/SPX futures failed to follow along as they had other things on their mind.

As the House of Saud cut US oil prices (some say to hold down the US shale industry) the market seemed a lot more interested in what was going on there, interestingly this is the move below support in USO we had talked about last week as a potential entry, whether that's a trade or not remains to be seen, but the divergence suggesting we see the move was tight on,

USO in light blue, SPX in green

USO 5 min divegrence seen last week suggesting a break under support.

There's a small positive divegrence starting which may be knife catchers, but we'll keep an eye on it. After a decline like that it will need to form some sort of a lateral base to accumulate enough to push back through resistance.

Stocks also seemed to react negatively to misses in both PMI and Construction Spending, so much for bad news is good news and good news is bad.

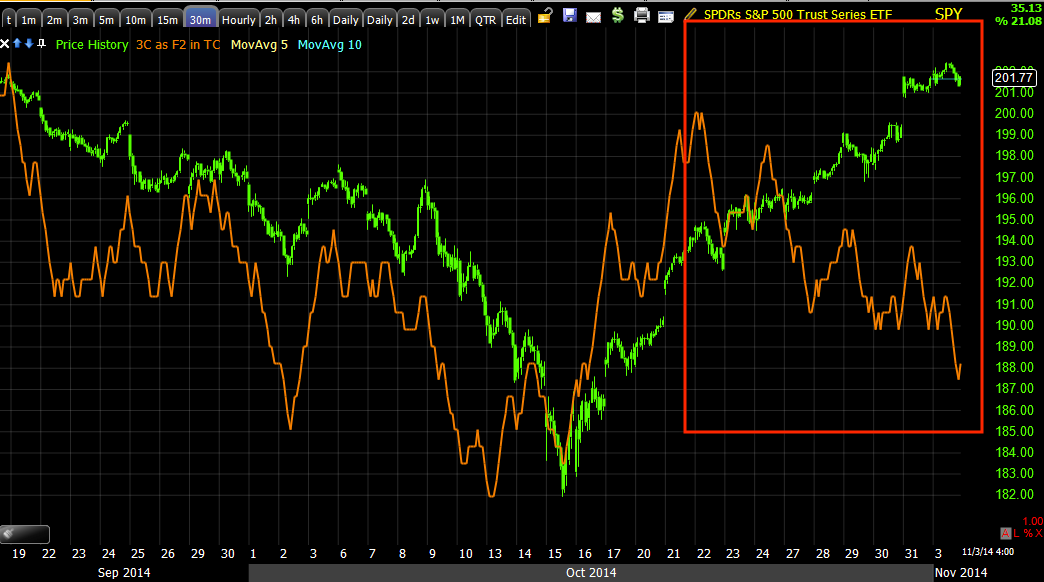
Just about everything seemed to decouple with the market from 3C as shown in several posts to HY Credit, Bonds, Leading Indicators and 30 year Treasury yields. Today's 2 part broader market update covered both Leading Indicators in Leading Indicators and the 3C charts in Broad Market Update.


HYG which has been leading negative for well over a week , but was also supporting intraday trade last week broke away as last week's negative HYG divergences would suggest and HYG gapped lower against the SPX correlation.

Note the intraday correlation Friday and the break today as well as in to the close Friday.

The longer term view shows HYG which was under accumulation mid-October when I wrote, "There's only 1 reason to accumulate HYG" in making the case for a strong move higher, now severely dislocated on a cyclical basis and a much longer primary trend basis.

I expect the SPX to start moving toward HYG and HYG to move lower, in fact new primary trend lows are likely on the table in the coming weeks.

We also saw the SPX reacting to 30 year yields , each time the SPX got a little too far ahead of yields, yields won with the SPX reverting down to their reality.

On a cycle basis from the October lows, Yields have just dislocated pretty seriously starting last week.

On an even longer term basis, again each time the SPX tries to move without 30 year yields, it loses and as you can see in this cycle there's a severe dislocation like most Leading Indicators.

Here I have inverted SPX prices (green) vs VXX to show the normal correlation and VXX's outperformance as VIX futures are clearly bid, but we already knew that from a strong 60 min positive divergence in actual VIX futures.

At the October lows we saw VIX futures under distribution, this accumulation signal is much bigger.


The spot VIX is way out-performing the SPX as well (prices inverted again).

And on a 2-day basis since Friday, spot VIX is showing strong performance vs the SPX which put in a Star Doji Candle today at the close, a common downside reversal signal.

Pro sentiment took another hit and deeper than shown earlier today vs the SPX (green) and this is just today, there's a much larger dislocation trend like the 30 year yields.

Our second pro sentiment indicator confirmed, this is also not it's first time diverging and has a much larger divergence in place.

HY Credit wasn't playing along today either as you saw in the Leading Indicators update.

The 3C charts saw a lot of damage today, especially in the flat range areas, although they have a small 1 min positive divegrence in to the close so I might expect prices to open in the area tomorrow, although I don't expect it to last long, it may be useful.

 SPY 1 min in to the close...

However right after the 2 min is deeply leading negative, a good timing indication with longer charts already negative.

 Take this 5 min which was clearly negative and added a deep leading negative divegrence today.

Or the 30 min chart already in a stronger leading negative divegrence than what was seen at the base to send prices higher this month.

As for breadth, there's nothing too exciting, almost every breadth indicator was absolutely flat (no hidden strength anywhere today) or made a turn to the negative, no smoking guns today intraday, but as you saw in Friday's Now and Then post, there are breadth divergences there that haven't been seen since the 2007 top and many worse than that going back well before the 200 top/bubble.

The Dominant Price Volume Relationship was mostly Close Up and Volume Down despite the fact that most of the averages closed in the red of near unchanged, these are the component stocks and this relationship is the most bearish of all 4 possibilities. The Dow had 15 stocks, the NDX had 63, the SPX had 217 and only the Russell 2000 had a different relationship, Close Down/Volume down, the least influential, but also the thematic relationship during a bear market.

As for the S&P and Morning star groups, there was no over sold/bought relationship, 5 of 9 closed red and 111 of 238 closed green, not an extreme, but more like a stall, just like the SPX's daily candle while Transports had a more bearish hanging man.

In addition to Friday's Now and Then post, here's what else the market shares in common with the 2007 top...

1.     Corporate debt is back to 2007 PEAK levels.
2.     Stock buybacks are back to 2007 PEAK levels.
3.     Investor bullishness is back to 2007 PEAK levels.
4.     Margin debt (money borrowed to buy stocks) is at 2007 PEAK levels.
5.     The leveraged loan market is flashing major warnings.
6.     Corporate insiders are dumping shares at a pace not seen since the TECH BUBBLE TOP
7.     Numerous investment legends have warned of a coming crash.
8.     Investor complacency is at a record LOW.
9.     The Fed has confirmed QE is ending this week, so the juice is cut off for now.

Have a great night, I'm still staying with all short positions and puts, we may even have a nice looking add to or new entry area if charts keep moving as fast as they are, already at extreme divergences, but that's what we had to kick off this move too so I suspect volatility on the next pivot down will mirror volatility of this move if not higher, that's the same thing that happened in 2007, although I want to be careful not to compare these markets too closely, they are just flashing a lot of the same bright red lights and they are hard to ignore.


HLF Reports, Not Even Stock Buybacks Can Save It... We may ride this to zero

HLF reported after the close, as you know this is one of out core short positions, the kind I'd rather leave in place and let it just work without trying to trade around every bump, bounce, decline and range. There are strong 3C charts and strong reasons we entered HLF short and did so on the day it had its biggest 1-day gain ever, although this wasn't a counter trend trade for counter trend trade's sake, we had strong objective evidence of distribution as HLF jumped over +24% on July 22nd, TALK ABOUT AN EMOTIONALLY HARD SHORT TO TAKE ON!

In addition we were shorting a stock that Carl Icahn was an owner of as well as the Oracle of Omaha, Warren Buffet, but that didn't dissuade us from shorting it in to a 25+% 1-day gain which was entirely based on objective chart data showing massive distribution.

As of the close this is what out P/L in our HLF short looked like.


On September 23rd in HLF Trade Management it was obvious HLF was going to see a counter trend rally so I provided this Trend Channel Stop for anyone who wanted to take gains and perhaps look at re-entering at better prices.

From left to right, the negative divegrence is the 1-day 24+% gain we entered HLF short for a second time, at the lows right around September 22nd we even saw a head fake move, a classic one in fact in to a positive divegrence which has since gone negative before tonight's earnings so in the post linked above, HLF Trade Management I provided this Trend Channel stop...

This is the exact chart from the HLF Trade Management post with a stop at $46.75, personally I'd rather just let core shorts work for me and not be so busy with them unless they are the trading positions we have been in and out of recently, otherwise, if I have strong reason to believe lower prices are coming, I'm fine with just being patient.

In after hours, after missing the top and bottom line and butting guidance, HLF did this...
 Note 3C in after hours went negative just before the collapse to $49.30, putting out current short at a gain of +23.5%, but given the charts below, I'm quite sure we'll be seeing lower prices...

 HLF daily 3C chart with  # 1, 2, and 4 being the 3 places I'll short a H&S top and #3 being the one place I wont because of the volatility shakeouts that led to the move above the neckline and to #4 which is where we last shorted HLF.

So whether you stayed in or took the Trend Channel exit at $46.75, you made money and can re-enter here at better prices and ride HLF down some more and why do I think it's going lower?

Here's the longer term 3C chart (multi-day).

Note the heavy accumulation of 2009 like most assets, but also the current deep leading negative divegrence, I wouldn't be surprised if they declared bankruptcy in the next year or so irregardless of whether their a scam or not.

However what really hurt HLF that we'll be talking about more since my Friday post, Now and Then looking at the market top in 2007 vs the market right now and breadth indicators.

One of the other things that's similar now like 2007 is stock buybacks, their back at 2007 highs while insider selling is back at 2007 highs as well.

What may be the last nail for HLF is the fact that like many other companies, the only way they've been able to keep share prices somewhat healthy (they would have been worse in HLF) are buybacks, HLF spent all CASH CREATION and heavy debt to repurchase approximately $690 million in shares in Q1, almost $580 million in shares in Q2 and in Q3 as their net debt climbed to an all time high at $1,150,000,000 they were only able to buy back about a million in shares this quarter, ending the game of share buyback to buoy stock prices.

All cash creation plus a bunch of debt just to buy back shares presumably long enough to let insiders sell at a gain before the company implodes. This is not unique to HLF, this has been the theme for the last 2 years in the market, a lot of stocks are as high as they are due to leveraged debt buybacks of shares at all time highs, well as HLF shows, this is a scheme that works for a bit, but not forever, especially when you can't make your numbers in earnings anymore, who's going to lend. HY credit and its decline is tied in to this entire scheme as well, where do you think the debt to finance all of this is coming from.

So hang on, HLF looks like it's going to make us a lot more in the way of gains in the months to come. I'll put out an update for HLF as it looks to be actionable again. Congratulations to HLF shorts who either took gains at the Trend Channel stop or made some more tonight, there's certainly more to come in my view, a lot more.


Broad Market Update

So far today's price action is almost EXACTLY what the Week Ahead post forecast, early strength in the morning morphing in to weakness later in the day, this was seen on 3C charts as 1 min positives in to the close and 2 and 3 min negatives after that. I already mentioned the two reasons I suspected we saw those, 1) Mutual Funds Fiscal year end and 2) the psychological greed factor over a weekend.

Continuing where Leading Indicators left off, here are the 3C charts. For one thing you'll see things look a whole lot different when you are looking at underlying trade (flow of institutional funds) and leading indicators then they do just looking at price alone, although price alone's lack of follow through on the BOJ QE is telling in and of itself, if you can suppress the emotions of fear or greed and how the market personally related to you (which it doesn't, it doesn't know or care about your positions) long enough to listen to the message of the market in objective fashion. 
While a 0% move in the averages may not seem like a big deal, put it in context of a bearish monthly hanging man, a bearish daily hanging man, the BOJ's decision which "should" (presumably) not have just went from all out risk on to risk off and those are just the price movement messages without anything else.

For instance, last week the divergence between the Dow Industrials and Dow transports despite what Crude was doing, was a tell that I'd certainly have been paying attention to if I didn't have other resources.

 Dow Theory confirmation/non-confirmation between Industrials and Transports, sort of the same as our newer indicator, the SPX/RUT Ratio.

There are many different ways to note the discrepancy in the high beta/momentum transports (especially considering oil) vs the Dow Industrials, I'm using one of the most over-looked and useful child indicators you can add to just about any indicator and enhance its performance, Rate of Change as the concept is simple, "Changes in character lead to changes in trends", thus a Evening Doji Star or Hanging man's intraday lack of price movement is a negative change in character and both candlesticks are considered bearish probable changes in trend.

 Note how much deeper the divegrence in Transports Price ROC is vs the Industrials.

Furthermore, this intraday chart of Transports (1 min) is a common theme today along the lines of "A quiet market is a dangerous market). 

Note the flat range in price today, often we see these and they are quite boring, but other than divergences against a trend, divergences in a flat range are some of the strongest and most common divergences. I think the Japanese identified this hundreds of years ago with patterns like Stars and Dojis; 3C just puts a face on what they discovered using candlesticks.

Intraday Transports 3 min in line as the price trend is moving, but as it goes flat, intraday distribution picks up significantly, the same applies for accumulation in flat ranges as well, thus the morning Doji and Doji Star's bullish bias.

As for the averages, again take note of the flat intraday price ranges and changes near or at it as well as what 3C looked like in many of the averages and Industry groups going in to the HYG positive divegrence on October 30th and you get some idea of why HYG was called up and why the divergence only reached as far as the 2 minute chart.

 HYG's positive in to the 30th and a strange upside print then a negative divegrence building as of Friday leading to a gap down this morning.

 SPY 2 min, just looking at this chart alone since Friday, it seems to me that smart money knows Japanese QE is not going to replace F_E_D QE and it's more than likely there to absorb the GPIF Pension fund's liquidation of JGB/Bond holdings in to a completely illiquid market, something that would have triple effects not only for the GPIF, but every holder of JGBs from retirees, those who are building a retirement portfolio, institutional domestic and foreign funds, etc. not to even consider the shadow banking and rehypothecation scenarios.

 SPY 3 min leading negative in to this afternoon's pump, around the area VIX was smacked this afternoon.

The 5 min chart's trend in SPY

And of course the larger picture, 30 min SPY trend and much larger flow.

As for this being a toppy area and expectations (BEFORE the move started) that we'd see a lower low after this move, that was all in place long before any thought of a move higher.
SPY 4 hour 3C chart's trend, it's very similar to the breadth trend which makes perfect sense as something has to be sold for 3C to move like this, as of late last week there were barely 50% of stocks above their 40 and 200 day moving averages despite nearly being at a new high. Immediately the Pier and rotten pilings analogy pops in to my mind, except I don't think it manifests as a dilapidated foundation slowly giving way and crumbling in to the ocean, it seems to me to be more likely that a storm slams in to it and it's just gone.


 QQQ 1 min intraday and the flat range / distribution.

QQQ 5 min trend from the lows/ V-base to the highs and 3C leading negative at a new low.

The 5 min chart is important to me because of it being the fastest timeframe to show institutional size activity intraday, thus the leading negative at the flat range today tells us a lot about underlying trade way beyond what price alone shows.

 QQQ 15 min trend from a relative negative divegrence to the stronger leading form, this is where divergences get ugly very fast.

And the QQQ 60 min chart with the August stage 1 base, the rally/Top and retrace of the entire August cycle to a new lower low as we were looking for with an even worse divergence on this move which is much more parabolic for a reason,  the reason hasn't changed since before the move started, The Psychology of Swinging Sentiment.

As far as making a lower low, the 2 hour QQQ chart and the very serious deterioration from the August cycle and even worse in to the October cycle.

Again, I DON'T trust parabolic moves  ever and this entire rally has been a parabolic move.

They tend to end as spectacularly as they rise (or fall depending on the trend of the move).

IWM intraday during a flat price range today.

IWM 3 min during the same flat price range as well as Friday's buying, I suspected a bull trap in the week ahead.

This is the same chart zoomed out and with the HYG divegrence added, note how 3C falls apart around the area, it seems HYG was brought in to finish the trend as the distribution was getting so heavy it was likely not going to go much further without a lever... HYG.

 And the institutional 5 min chart intraday in to a flat range.

 The larger 15 min trend and a deep leading negative divegrence. The longer the timeframe, the less detail, but the more clearly the trend is displayed and the more important the signals as they represent much larger flows of funds.

 And why I think the R2K will make a lower low, this is the trend throughout the year and the reason I think the Russell 2000 has essentially already topped.

XLF for the FAZ longs intraday , Friday was bad, today was worse and I'm not using any data that was missing from Thursday.

 XLK/Tech 5 min , again note the change in 3C around the time the HYG divegrence was able to support the market.

XLK 10 min

And XLK 60 minwith distribution in to the August cycle's rounding top at "!" and the Chimney in most averages at "B" and how 3C has fallen drastically short of any type of confirmation on the last move at "C"

On a 2 hour chart, this move wasn't even showing up as accumulation because it didn't need that much as sentiment did most of the work(short squeeze), however this tells me something about the primary trend/big picture and why I'm confident in lower lows and comfortable holding shorts here.