Wednesday, November 16, 2011

Market Wrap

 This is the daily S&P 500 and all the talk in Technical circles are focussed on this triangle which is generally too large to be a consolidation/continuation triangle, yet not as big as some of the major triangle tops, it does appear however to be a triangle top from the October rally, it is proportionate in that sense. Top or not, the issue of "head fake" has become prevalent. Usually I would say that it is so obvious that it will be head faked, but the question of whether it will be head faked has become so obvious in technical circles, that I almost side with the idea of, "A head fake her is too obvious and too expected". The closing candle, which has no upper or lower wick is bearish and most commonly followed by a follow through selling day as you can see by the white arrows.

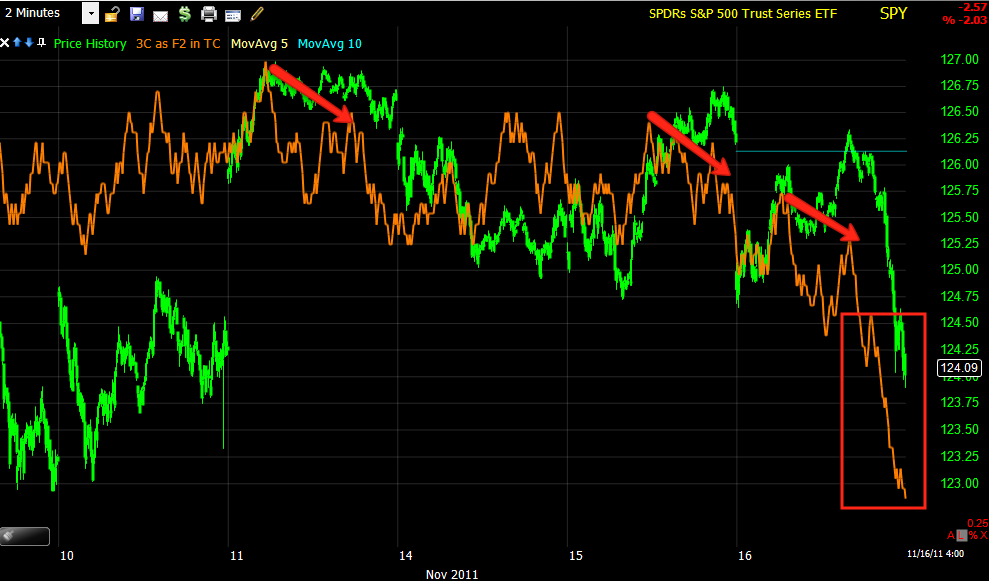
 The same pattern is visible on the SPY, the closing candle is also bearish, it is a rejection of higher prices and often a bearish candle as you can see by the examples. Volume was high today, this can be taken in 2 ways, 1) a serious break 2)short term oversold capitulation. The second is more common then the first, but considering where we are, it's a toss up.

 The SPY long term charts have been showing what every bit of information from hedge fund holdings to all kinds of redemptions have shown us, so the chart makes sense and is bearish, very much so.

Even on a short term basis today, the bearishness was very quick to materialize and confirm that apparently more should be on the way.

 The long term DIA chart shows the same extreme level of 3C bearishness.

 as did today's short term charts

 And the QQQ long term chart, very bearish., we have seen much worse falls on much less severe divergences.

 Financials, which are quickly becoming the epicenter of the crisis again have a much less ambiguous top, this is a descending triangle and is bearish, especially in a bearish environment (statistically). Today that top was broken on increasing volume, it is not unusual for price to linger in the area after such a break, but follow through selling would be a very bad sign for the market.


And XLF long term, a horrible negative leading divergence, the first of which created the top/reversal point.

Market breadth indictors are heading south in  hurry and credit is showing major dislocations from equities.
 This is a first crude attempt to show the difference between the S&P and credit, large peaks are where dislocations occur and the revert to the mean. On a long term basis, you can see the red peak that caused the S&P to fall or revert toward the mean, the two green arrows show the dislocation now and in 2008 at the same relative level after a larger dislocation formed tops in 2011 and 2007.

 Here's a 15 min hart showing the OCT rally in green when credit and equities were pretty much the same, it led to a decent rally, but at each red peak, there was a downside correction in the S&P and the dislocation between the two has only grown.

Here's a closer look.


The next 3 captures show today's dominant Price/Volume relationship, this is for the DOW with most stocks closing down on increased volume and with only 1 stock of 30 closing green


Here's the NASDAQ 100, again the dominant theme is close lower on heavier volume with 7 of 100 stocks closing green


And the S&P-500 with the same dominant P/V relationship and 38 of 500 stocks closing green.

After  prolonged decline, I would call this capitulation and look for a bounce, it still could be a 1 day oversold condition or the 3rd possibility is that it is the start of a much bigger fracture in the market.

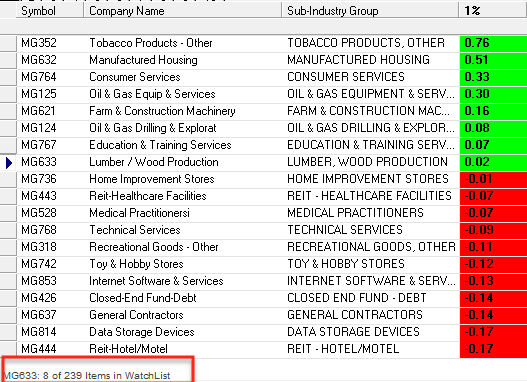
These are the 239 Morningstar subindustry groups, only 8 closed green at very small gains, again this can be a sign of oversold, but that is more typical after a prolonged downtrend, the kind of break tht would be considered follow through selling after a day like this is rare and only happens a few times a year, so a bounce statistically is the most likely, but follow through selling would be a definitive sign of a major break in the market.

 Finally USO posted an evening star candle today, which is often a reversal candle and it did so on what appears to be a false breakout from a bearish wedge, the next few days should settle the USO question which has been very strange in all manners.

 The short term charts today didn't even try to confirm the gap up as you can see above and below.


ES is rather flat thus far with a slight 1 min positive divergence in AH.

The only currency pair we are concerned with right now largely mimics the ES market. Come 3 a.m. EDT, we'll get our first look at what the EU bond market is up to. Today was notable in that the sugar rush rumors that have been seen in the afternoon ONLY after Europe closes, did not hold today and there was no counter bad news to send the market lower, it broke of its own accord, so expect the rumors to start getting heavier and at a faster pace, the markets failure to respond to them will be a key development as the Forest is starting to take precedence over the trees.

Back To Credit Markets

Honestly, I feel a little like I'm holding a crystal ball, I would NEVER be so arrogant as to truly think that lest the Stock Market strike me down with a thunderbolt, it's just since Sunday's post, all of the main topics that I covered in "Sorting the noise from the trend" have thus far come to fruition in the weirdest ways and in such a timely manner that I am shocked and while that statement wreaks of arrogance, I say it with all humility as a lifelong student of the market, it's just the irony of the timing is incredible.

If I had to guess, I would say it's just the experience of having to put food on the table, literally, by trading the 2008 market crash and nothing teaches you faster or creates more vivid memories then that kind of pressure. All of the same events and market turbulence that happened in 2008 are replaying in HD/3D before my eyes, thus I can generally distinguish between a market sugar high on temporary news and those events that really matter.

I just posted about hoe boring, but how important the credit markets are for us to watch, I guarantee that 99% of technical traders are watching moving averages rather then what really moves markets and to be honest, I just signed up for Briefing.com again and am 100% throughly disappointed when I read their "Technical Take". Everything that happens in the market in their experienced eye is because of a support level at $1247.21 or a 55 exponential moving average crossing below a 23 simple moving average. In other words, everything they publish is 100% all about "technicalities" and they miss important events, fundamental issues that move the market; the extent of their creative out of the box thinking, is tweaking moving averages to fit with the market action.

In any case,  just get done telling you how important credit is to equities/the market and how we finally have an ETF/tool to gauge that. Exactly 12 minutes later this piece is published, while I don't agree with their perpetual bearish stance (you take what the market gives), they do have an amazing ability to collect news that even my paid subscription to Briefing.com doesn't come close to. In any case, maybe the article will serve as some confirmation for you of just how important credit is in the world of finance.

Bear Flag Head Fake

This is a longer term pattern that started as the market hit its October rally highs and broke down from there, a bear flag formed, it was very obvious and thus very likely to be gamed.

The flag pole starts at the top, a bear flag is formed, it breaks down as expected, drawing in shorts and then reverses to the upside. The dogma of technical analysis represented in 80 years worth or writing and probably hundreds if not thousands of books, "If a pattern fails, reverse you position", which means that those shorts went long and the market gave them a reason to believe. Now the bear flag has closed the gap and is doing exactly what the sentiment that created it intended, the only thing was the head fake in the middle courtesy of Wall Street and the fact that technical traders are so predictable in what they will do. THIS IS WHY WE MUST THINK OUTSIDE OF THE BOX. "To make money on Wall Street, you must see what the crowd missed"

All Gaps Filled

The rally from yesterday... retraced, the gap of support, filled and do I need to point out the volume and the reason why we don't put stops at obvious levels.

What Industry Group Have I Singled Out As Being the Grim Reaper?

If you said FINANCIALS, you are right and this is a major development today, it doesn't matter if the price decline was -.25% or the real -2%

XLF broke an intermediate term trendline of support-this is where the trouble is

Follow Up

The importance of credit markets cannot be overlooked, for equity traders it's much easier to look at Stochastics, Bollinger bands, MACD, take your pick. I have long suspected that the explosion of technical analysis in the late 1990's, (I can remember when it was called "Voodoo analysis" and had no credibility), in my opinion was largely due to pure, unadulterated laziness. Fundamental analysis, which I put zero credibility in because the numbers that go in are flawed to start with, was much more time intensive.

The point being, as technical traders or traders in general, you can never stop growing or learning and although credit is pretty boring, it IS where institutional money has the largest presence due to the immense liquidity.

Credit markets lead equity markets and now, for the first time we have a tool in HYG to look at credit without having to try to second mortgage out homes for a Bloomberg terminal. USE this new edge, it was right on yesterday, it was right on today.

I didn't want to make this chart anymore confusing, so credit is the white price line, SPY is green and as I already have a lot of trendlines drawn here, I added 3 white arrows to show credit DID NOT make new highs with the market, this was a red flag yesterday leading to the overnight massacre in ES as well as the gap and it led to today's drop from a closed gap.

The white trendline shows an area on the SPY of possible support, but before I could even post this, that has been wiped out already.

You are seeing the underlying trend, there was no news that went in to the making of the melt down vs the making of the afternoon ramp, this is what 3C shows, this is what is reflective of the real issues the market faces.

I guess a sugar high only lasts so long

And what in fact does that say about the market that the only way to prop / ramp it up is short term news when Italian/French/Spanish yields are hitting new highs almost daily.

There will be more discussion on the topic.

For now, I haven't seen the news to send the market lower, so to me it looks like a function of the dumping represented by the leading negative divergences in the last post.

 Unexpected to this degree, the SPY filled the gap, showed us resistance to moving any further north then that and then took out 2 intraday support levels, the second being the top of the a.m. triangle , on massive volume. I expected at least some support at the lower trendline, maybe we'll see some fudging around the area?

 For all intents and purposes, the DIA/DOW did the same thing

Update

Despite the fact of bear markets having as many or more up or unchanged days then down days, it seems the play is to short the afternoon sugar rally and cover the morning gap down. However, that is to say nothing of the trend which we'll look at later.

Some of the same weird signals from yesterday are showing up again today.


 Yesterday it wasn't that pronounced, today though the SPY is well north of the commodity index CCI which should rally with the market and as you can see, hasn't.

 Again, the leading investment for institutional players, credit, just like yesterday is way underperforming the SPY/market.

 The DIA is in a leading negative divergence, but today it's worse then yesterday if you look at the two red boxes, prices are at the same relative level, 3C is making new lows.

 Here's the SPY unchanged mark at the top rd trendline, resistance 3 times with a decent dump on the first break, I imagine we'd see the same if the upper trendline were broken to the upside and then to the downside again as far as volume goes.

And the SPY is in a leading negative divergence, I didn't draw in the relative comparison areas, but you can see where price was the same and the difference between then and now in 3C.

TICK Chart Warns Again

Except this time it's hitting -1000 levels


Be Careful chasing GLD

 GLD 1 min

 GLD 2 min

GLD 5 min

Market Update

Here are a few potential warning signs the sugar rush is fading...
 Momentum indicators are starting to fade like late day yesterday

 3C is negative on even a 2 min chart.

And volume is quite large right at the gap

As for the market's latest sugar rush ramp

Today's sugar high comes from Boston Fed President, Eric Rosengren gave an interview which is nearly perfectly timed with the market ramp, Here are some excerpts:

-Crisis might warrant coordinated action by the Fed and ECB
-Fed Shouldn't be disuaded from trying to help
-There are clear stresses in short term credit markets (circa 2008)
-The economy is not creating "As many jobs as I'd like"
-GDP growth is "Not what I'd like to see"
-"The economy should be picking up if there are no further shocks" (or, the economy should pick up if the EU is magically transformed in to a global growth engine overnight and does not see any EU or bank defaults)
-the central bank still has power to boost the economy through lower interest rates.
-“The common misconception is that rates are already low so further monetary policy actions will have no impact on the economy.  In fact, statistical analysis suggests the opposite.” (That would be based on the massive improvement since ZIRP?)
-"Even small easing steps can be worthwhile when the economy is so badly damaged" (This is sounding a bit contradictory)
-“While the scale of the problem is great, that should not dissuade us from actions that make even just ‘a dent,’” he said. “For instance, an action that reduces the unemployment rate by half a percent does not bring us close to full employment, and does not solve the country’s problems, but nonetheless would perhaps create roughly 750,000 jobs that may not have been created in the absence of the action.”


German plans for an EU withdrawal more advanced then we suspect?

What would cause the head of the EU's EuroGroup to come out an openly attack Germany which almost seems to be an effort to exert pressure on German yields?

The only thing I can think of is deep-seated resentment and again, the signs of a market getting ready to enter stage 4 decline are as I have posted well over a week ago and confirmed by several well respected analysts  since then that I have posted, lack of trust between interconnected parties. If this doesn't fit the bill, then I don't know what does.

This from Reuters an hour or so ago...


Juncker says German debt cause for concern

Eurogroup head Jean-Claude Juncker was quoted in a German newspaper on Wednesday saying that Germany's debt level is worrying and even higher than Spain's.

In an interview to appear in Thursday's General-Anzeiger newspaper in Bonn, Juncker also said it would be a disastrous scenario if Greece were to exit the euro zone.
"I consider the level of German debts to be a cause for concern," Juncker said.
"Germany has higher debts than Spain," he added. "The only thing is that here (in Germany) no one wants to know about that."
Juncker said Greece was on the right path. But if it were to leave the euro zone it would lead to a "disastrous scenario".


Being that Germany is the key to any form of salvation for the EU, whether it be agreeing to let the ECB monetize debt, which the German Constitutional Court has already ruled against, or for Germany to lend its support in whatever fashion, even if it is simply Merkel making supportive statements, it is another one of those astounding surprises that Junker would come out and "Junk" Germany in such a condescending and provocative way.


The parts that I have put in bold, to me at least, indicate that German plans to ditch EU countries and possibly the EU altogether may be far more advanced then even what I already suspect is pretty far advanced. Clearly Juncker is referring to German plans already voted on and approved by Merkel's CDU ruling party to give the boot to nations in the monetary union, whether the actual language is "forced" or "voluntary" is a matter of semantics and completely irrelevant as I pointed out yesterday, Germany can make life so intolerable inside the EU for any country it chooses that a voluntary withdrawal would be inevitable. 


It's a short article, read it, let it sink in and tell me that it doesn't seem like Junker who obviously does not want any changes to the EU, is panicking at what have been weekly intensifications of German planning to due exactly what he calls a, "Disastrous scenario"!


By the way, it may indeed save Germany, rather then be the next to follow in the footsteps of France, albeit an early stage for France, we see where this is leading as contagion has now hit the core, but I agree it would send the rest of the EU into a deep and prolonged recession/depression as somewhere around 11 countries would eventually be forced to default and cause an economic shock to world markets such as we have never seen, so much for the new world order.


Still, to say that Germany is worse off then Spain, even if that could possibly be conceived as partially true and then to say the Geman's in effect just want to bury their heads in the sand over the issue, is more then provocative and I would expect relations to fall apart more rapidly then we can even imagine and retaliations to from Germany to be fierce. 


The fact that Junker showed so little consideration in making such a statement must reflect how desperate things are behind the scenes.


Oh, and if you didn't notice Sigma X's most actively traded issues yesterday, there was not only England's Barclay's which I have singled out repeatedly recently, but more surprising, Germany's own Commerzbank (Barclay's 6th most actively traded issue and down 1.6% / Commerzbank 10th most actively traded issue and down -2.65%)


There's the bounce

Last market update I said the intraday/a.m. support from the triangle will likely cause a bounce, I wrote that even as the SPY was just breaking below the support line, but it's all too predictable as it happens again and again day in and day out.

So here's the first bounce off support.


I'm going to look at the market in depth as I did yesterday and see if any of the same of different market anomalies are posting any red flags like yesterday's late day rally did.

Bak to the market

Now that the gap fill attempt seems to be cooling off and this is exactly why I don't put too much weight in early trade...

 The SPY broke just a little with the FX correlation at the read arrow in a finger tip reach for the gap, currently sitting on some intraday support from the triangle's breakout this morning.

 DIA saw some ugly volume at the lose yesterday, it is dwarfed by this volume spike, which in the position it is in, I would guess is indicative of churning.

 The Q's also saw ugly volume near the close, again dwarfed by recent volume.

 And the SPY which also saw VERY ugly closing volume is on par today as intraday/morning support is touched.

For scale, here's what yesterday's volume looked like near the close as it is not looking proportional at all compared to today's

Yesterday's closing SPY volume for comparison to today's.

 I have covered some conventional indicators you can follow to see what the market is getting ready to do, I posted the NYSE Tick chart in the last market update and here's the TICK, which is all NYSE advancing issues minus declining issues, since then-TREDND CLEARLY BROKEN and the TICK as well as 3C provided early warning.

 Here's the DIA now, starting to lead negative, although there's a decent chance for some brief support at the morning support.

 The Q's with yesterday's horrible readings and today's confirmation of the downside move, also starting to lead negative.

 The same with the SPY.

 Keep an eye on USO, last week it pulled a major surprise reversal on the inventories report an hour or two after, 3C is not improving .

Heres a longer chart showing where 3C went negative and USO DID in fact break down in the red box, just something strange has been going on since, this chart is not improving today either.

Back to USO

While you have seen with your own eyes, crude absolutely defy the natural physics of its trading ever since it was first sold in $USD which is probably as long as it has been sold, and while there is seemingly no reason that we are aware of, there is some reason. Whether it is a HUGE head fake remains to be seen as we continue to watch for developments.

Some speculation has been the tension between Iran and Israel, some others speculate the US is printing and devaluing the dollar and thus crude has adjusted, but it's one heck of a parabolic adjustment and from what I see and posted yesterday, it looks like the dollar is starting or rather has been seeing the move toward accumulation while the Euro has seen a move toward distribution as well as the trend that would accompany that.

Today we have a third "possibility" and I use the term loosely because of the underlying trade and the actual parabolic trade and all the other reasons I posted this a.m., but it is something to consider.

This news broke today about the former French colony, According to the BBC:

"Turkey and members of the Arab League have called for "urgent measures" to protect Syrian civilians from a brutal government crackdown.


At a meeting in Morocco, they also declared they were "against all foreign intervention in Syria". Why would they say that?


The statement came hours after reports that rebel Syrian troops had attacked a major military base near Damascus.
In another sign of Syria's increasing international isolation, France said it was withdrawing its ambassador.
Foreign Minister Alain Juppe told parliament: "There has been renewed violence in Syria, which has led me to close our consular offices in Aleppo and in Latakia as well as our cultural institutes and to recall our ambassador to Paris."
These are the times I wish I still had my Stratfor subscription.
Now that France has dispatched with Gadaffi for almost identical reasons, I wonder how many more foreign ambassadors may quietly exit the country? 
Of course Iran being Syria's closest ally and neighbor would likely not look favorably on UN/NATO/US or Israeli intervention in their backyard.

Something is definitely going on that we are not aware of, or this is one of the biggest head fakes crude has seen in years.


While we have an intermission

Last night we saw a rare glimpse of the Dark Pool trading conducted by GS Sigma X, I asked you to look at the most actively traded issues and look who was #1

Now that Goldman has it's henchmen (former and current employees and advisors) in the Italian government as well as the ECB, is it surprising to see Italy's UniCredit as the most actively traded issue YESTERDAY with a 6% loss when just today, this breaks...

Italy's BTPs (10 year debt) opened once again above 7% around 7.10% before the ECB came in buying in bulk and sending the yield back down to 6.75%. As recently mentioned ECB interventions are seeing a half life that continues to dwindle. A few hours later, and lord knows how many billions of wasted ECB dollars, the yield broke back above 7% and why?

From the FT

UniCredit has its begging bowl pointing Frankfurt-wards, it seems. Reuters is reporting that the Italian bank will ask the European Central Bank to increase access to ECB borrowing for Italian banks at a meeting on Wednesday, highlighting funding concerns among the country’s lenders.


Italian banks have ramped up their reliance on the ECB for cheaper funding since the summer as the euro zone’s third biggest economy was sucked ever deeper into the region’s debt crisis and its lenders faced sharply higher refinancing costs.
The Reuters source, who declined to be named, said the meeting would be held in Frankfurt in Wednesday. The ECB declined to comment.
Earlier, the Corriere della Sera newspaper reported UniCredit Chief Executive Federico Ghizzoni saying he would ask the ECB “to extend the access to ECB liquidity by widening the type of collateral offered.” The request would also be on behalf of smaller Italian banks.
UniCredit’s five-year credit default swaps, measuring the cost of insuring its debt, widened by 40 basis points to 575 basis points after the news, on fears that under current liquidity provisions UniCredit might be under pressure.

Furthermore:
UniCredit's net negative interbank position at the end of September rose to 67 billion euros, from 44 billion in the previous quarter, said Cheuvreux analyst Silvia Benzi. "Going forward, this funding mix is barely sustainable, particularly in a context in which regulators are pushing for a more balanced funding structure," she said in a report.

This is what sent Italian yields soaring again and is it not convenient that a VERY well connected Goldman Sachs had UniCredit as their top traded issue YESTERDAY at a significant loss. I won't say insider information, but because I won't say it doesn't mean.....