Thursday, February 5, 2015

Daily Wrap

This week has seen more than 1 lever deployed, yesterday I showed the SPY Arbitrage that depicts the 3 most common levers, VXX, TLT and HYG. However in addition to that, the Most Shorted Index has been active this week, MCP is actually one of the components of the MSI, although it has a real fundamental reason behind its move. the MSI had it's biggest 4-day move since Sept. 2013, although it was difficult to tell today looking at the intraday NYSE TICK Index which was uncharacteristically flat most of the day. The price action didn't look much like a short squeeze either, but we are talking about the Most Shorted Index, not just a short squeeze broadly.

The major averages achieved today what Draghi stripped from them yesterday, they finally went green on the year to date. However HY Credit dislocated with the SPX around 2:30, perhaps concerns over tomorrow's Non-Farm Payroll data at 8:30 a.m. We also have a typical options expiration Friday, we usually see an open and pin somewhere around Thursday close until about 2 p.m.

I made reference numerous times today to some strange looking charts, TICK looked odd, several 3C charts had some sudden and rather big moves vs the normal progression of a mini cycle which is for the most part within a large choppy range for 2015 (and even half of December).

The 2015 range, very unlike the normal Q1 over the last several years that has seen seasonal adjustments and the January effect send them higher for the first quarter- we also missed the December Santa Rally. The range above looks very tempting for a head fake / false breakout which would be a nice put/option set up.

One big difference today was the internals and a solid overbought condition, this usually ends up seeing the next day close red, but I suspect Non-Farm Payrolls will be the pivotal data tomorrow.

In any case, the Dominant Price/Volume Relationship was across all 4 major averages and it was  Close Up/Volume Down, the most bearish of the 4 possibilities with 26 Dow stocks, 67 NDX-100, 871 Russell 2000 and 311 S&P 500 component stocks.

In addition 9 of 9 S&P sectors closed green with materials leading at +2.42 and Consumer Staples lagging at +.51.

In addition to that, a very overbought reading in the Morningstar Industry/Sub-Industry groups with 215 of 238 closing green, all in all a very overbought (1-day) condition that would usually see the next day close red.


VXX and TLT (two of the 3 main ramping levers both saw some interesting moves today, TLT quite a bit stronger.
 I suppose the VXX (short term VIX futures) could be related to hedging in front of tomorrow's NFP, but the divegrence in TLT looks like something different altogether.

This is a 15 min leading positive divegrence in TLT, beyond the lever being deactivated, a move higher in TLT means a move lower in Yields which tend to attract equities like a magnet.


Beyond what I've already posted through the day today, some of the post-cash market Index Futures are looking interesting , at least this early on...I'll check them later before turning in and post anything that stands out, but right now, this is standing out...
This intraday NQ/NASDAQ Futures chart was pretty much in line most of the day, then after the cash close, something went south quick. Remember earlier in the day the Tech/XLK and QQQ charts seeing fast moves in 2 min charts leading negative...

As I said, I'll check them out before I turn in and I'll see what the Index futures look like after the Non-Farm Payrolls. The last NFP data wasn't taken well by the market on January 9th.


$USD

One of the most overdone trades out there is long $USD. I have mentioned earlier that I don't see how the F_E_D can raise rates with the Global race to debase. Just think about the Yen and the BOJ's QE-zilla, the expanded ECB asset buying program which of course debases the EUR and the already strong dollar (with the end of QE and looming rate hikes), this causes a problem for F_E_D rate hikes "IF" they are truly data dependent.

Without getting off on another rant, it is my opinion that the F_E_D is locked on a course of rate hikes sooner than later and them having nothing to do with data dependency.

I first put the theory of policy normalization forward a couple of years ago, that the F_E_D, even as they unleashed QE3, had made their intentions regarding certain policy known that seemed they were already in the planning stages of a exit from accommodative policy. One of the first hints was talk of a new measuring stick for guidance, rather than quantitatively based as in, "We intend to do "X" by "X"", the F_E_D hinted they'd move to qualitative guidance which is to say , "It depends on the incoming data", but we all know that quantitative guidance is determined by qualitative analysis, so why the change or at that time, the possible change in the yardstick? At the time it was my guess that the F_E_D wanted to allow for ambiguity and interpretation so they could exit accommodative policy even if the data didn't support it. Fast forward a couple of years and at the last F_O_M_C meeting the F_E_D not only removed the dovish, "Considerable Time" language, replacing it with "Patient", but they essentially upgraded the US economy/outlook while admitting inflation expectations are likely to be subdued with oil being cheap, but that this was a transitory event.

To hike rates the F_E_D needs to be or act convinced that the economy is taking off, that the employment situation has improved substantially and should remain on target to continue to improve and that inflation expectations will move toward their long term 2% goal, even though all F_E_D inflation projections have been dead wrong for 2.5 years.

What the F_E_D did recently has me pretty well convinced that they are set on rate hikes and getting off ZIRP ASAP, these actions include not waiting to hike rates until inflation moves toward the 2% target, but put language in the policy statement that they would hike rates BEFORE inflation moves in the appropriate direction as long as they "FEEL" that inflation will head toward their long range target. Well we know by 2.5 years of fudged inflation expectations that the F_E_D can say anything it wants regarding inflation and hike rates any time they want based on simply saying, "We believe inflation will head toward our long term goal, even though it's moving in the wrong direction now, because we feel that the current environment is TRANSITORY".

They also, amazingly upgraded their outlook of the US economy and as such employment which the CEO of Gallup just yesterday called the unemployment rate of 5.6% a "Big Lie" perpetrated by the White House, Wall Street and the media. We already know or you know now that the easiest way to knock down the unemployment rate is to exclude the unemployed from the workforce, thus making the unemployment rate look lower because once you are no longer collecting unemployment benefits (with extended benefits cut last year in the US Budget, knocking some 3.3 million Americans off the extended benefits for 2014 alone), you are no longer considered part of the workforce, thus no longer counted which did wonders for the unemployment rate, but as the CEP of Gallup said, it's a Big Lie", but one necessary for the F_E_D to hike rates.

The F_E_D also talked about the US economy in glowing terms, upgrading it despite the fact that the Bloomberg Macro Economic Surprise (negative) Index registered the start of the new year as being the worst in over a DECADE! You might recall that Q3 GDP came in at 5%, granted, it received a HUGE boost due to Obamacare, which is perverse if you look at how much Obamacare actually represented of that 5% print, but you may also know that the Q4 GDP came in at almost half of Q3 at 2.6% (annualized).

The one thing I mentioned recently on several occasions was the difficulty the strong $USD will cause for the US economy as it seems nearly everyone else around the globe is debasing their currency while the $USD stays strong and that this could be a problem for the F_E_D to hike rates as the strong $USD would have negative impacts on the economy, specifically exports. I also said that I've seen 3C indications of $USD currency moves in the charts that seemed impossible at the time, but the charts were correct and only after the fact did we find out why, but the charts for the $USD have not been all that negative so I wasn't sure how they'd get around this.

Fast forward to this morning with the release of the US Trade Deficit for December  which came in at a miss, printing at a surge of 17.10% for December alone all due to the strong $USD, the deficit came in at $46bn for December vs consensus of $38 bn and the revised previous of $39.8bn; this is the widest deficit since 2012 and the biggest miss since July of 2008!

The first thought for most commentators... "Here comes the Q4 GDP downgrade revisions".

I hope the point is made that the strong $USd, especially vs. debased currencies around the world, is troubling to say the least for F_E_D rate hikes which some people believe isn't what the F_E_D wants to do, but based on the talk and changes the F_E_D has made since Qe3 was introduced, it has been a long string of events that has led me to the belief that for whatever reason, whether they want to or not, the F_E_D HAS to hike rates sooner than later. This may be based on the notion expressed by the Bank for International Settlements (BIS which is the central banks' bank) annual report which said, "Macroeconomic policy has little room for manoeuvre to deal with any untoward surprises that might be sprung, including a normal recession."

You can read the whole report here, and I'd at least read the section titled, "A balance sheet recession and its aftermath".

In any case, before the Trade data came out this morning, the Euro (Euro Crosses) were aggressively being bought in the overnight session after the ECB cut off Greek Banks' ability to pledge domestic debt as collateral under an ECB waiver, an obvious political move aimed at forcing Greece to come to the table and take whatever they are offered rather than act like uppity upstarts. The obvious reaction was going to be capital flight out of Greek banks and in to safe havens, one of the leading safe havens would naturally be the Swiss Franc, so after the ECB action yesterday late in the day time session, we saw the Swiss National Banks' (SNB) soft ceiling for the Swiss Franc of $1.05 - $1.10 (EUR/CHF) breached.

 EUR/CHF plunging just after Draghi cuts Greek Bank collateral. Thus all of the EUR cross buying in the overnight session which was heavy and said to have hit the stops in EUR/USD today at $1.15 (although I can't verify $1.15 specifically, it was very close and there was a huge surge of trades right around the level which was said to be a breach of $1.15 (which I can only find to be very near as in $1.1496 and the like- although judging by the trade count in the area, stops were hit at a breach of EUD/USD $1.15)

Note the EUR/CHF above is defended as the soft ceiling of $1.10-$1.05 was breached, thus the talk this morning in FX circles was it was the SNB buying up Euro crosses in order to defend their ceiling on the Swissy. Frighteningly, it is estimated it will cost the SNB CHF $10 bn to defend their soft cieling and that was an estimate BEFORE the Greek baks had their collateral pulled yesterday, making the exodus out of Greek banks and in to the Swissy inevitable, thus the reason they were out in force this morning and today trying to defend their currency. Estimates are that the SNB will spend more than Switzerland's GDP defending the ceiling.

As such, EUR/USD driven higher and apparently breaking the $1.15 level, hitting numerous stops.

As usual, everything is connected to everything, it's the "Butterfly Effect", the ECB punishes Greece in order to bring them to their knees and accept the terms or, well they are already getting a taste of the chaos of bank runs and the potential collapse of their financial sector which is why I said the Greeks having lost their position of strength in a single day are now more dangerous than ever, like a wounded animal forced in to a corner, Europe and the ECB may VERY WELL regret their decision to push the new Syriza led government in to a corner.

In talks today with Germany's FinMin, Schauble said that he was advised by his press secretary to say they agreed to disagree to which Greece's FinMin said they didn't even agree to disagree.


In any case, this is really more about the $USD and a few interesting charts have popped up, I don't know the how, why or ifs, but it looks like this...
In one of the most overcrowded trades, since 2015, there's a large negative divegrence in the $USDX, thus a short squeeze here could prove epic. I don't know how this may be achieved, I don't think the SNB can purchase enough Euros to cause this kind of divergence to show up, but it's there and with it, perhaps the answer the F_E_D needs to weaken the $USd and hike rates.

I'll be following up of course, but for now, this is one of the stronger, most unexpected charts out there. Ironically the last time I saw a strong divergence that I could make no sense of until it moved and later we found out why, it too was the $USD.


Market Update

I've noticed some strange things today in the market, but I haven't been able to exactly put my finger on what it is, what's causing it. I don't see today as an actionable day, meaning a time (broadly speaking) to be entering new positions, although we have deterioration, we aren't at the point in the cycle in which charts are jump[ing off the screen and that's when we have our sharpest edge, like USO, like MCP, etc.

I can only make a quick and obvious guess that perhaps some of these strange things are related to the ECB's, the Troika's and generally the EU's reaction to Greece and how Greece gave up a position of strength, which was seen in the way the German Finance Minister was pretty much dismissive of the Greek Finance Minister in today's meeting saying that "My advisor said I should say we agreed to disagree", with the obvious implication being there's not even that much agreement between them.

I think this puts Greece in the role of wounded animal backed in to a corner, rather than negotiate from strength which perhaps their inexperience , caused them to give away after a few friendly probes from the EU, they are now in a position of accept whatever the EU tells you or break all boundaries , exit the EU and let the chips fall where they may which almost inevitably ends up with Russian aid and a Russian naval port smack dab in the middle of the Mediterranean and in the heart of Europe. The stakes went from extreme to beyond comprehension in less than a week, that may be what the market is starting to reflect, it may be partly op-ex related, it may just be the tail end of a multi-year cycle without precedent, except the 1920's and the Great Depression/MArket Crash of 1929 as the closest thing to a historical precedent, in other words, we have no map in which to gauge the current situation because the last 6 years are without precedent.

Here are some of what I noticed today, although I'm far from finished, as I said above, I see the odd behavior, but haven't put my finger on where the smoke is coming from yet, in any case I don't consider this to be actionable at the moment, but there's a clear increase in the rate of activity moving toward actionable.

Whatever it is that I'm picking up on, it's very apparent in Capital Context's, ES model, risk assets are picking up on the same thing.
The Context model for ES/SPX Futures is showing a move today of risk off in risk assets that usually move with ES and put ES at a premium of nearly 30 ES points (too rich vs how other risk assets are behaving that normally would move with ES).

In other words, I'm not the only one seeing whatever it is, managers are moving out of risk assets that would normally track with SPX futures.

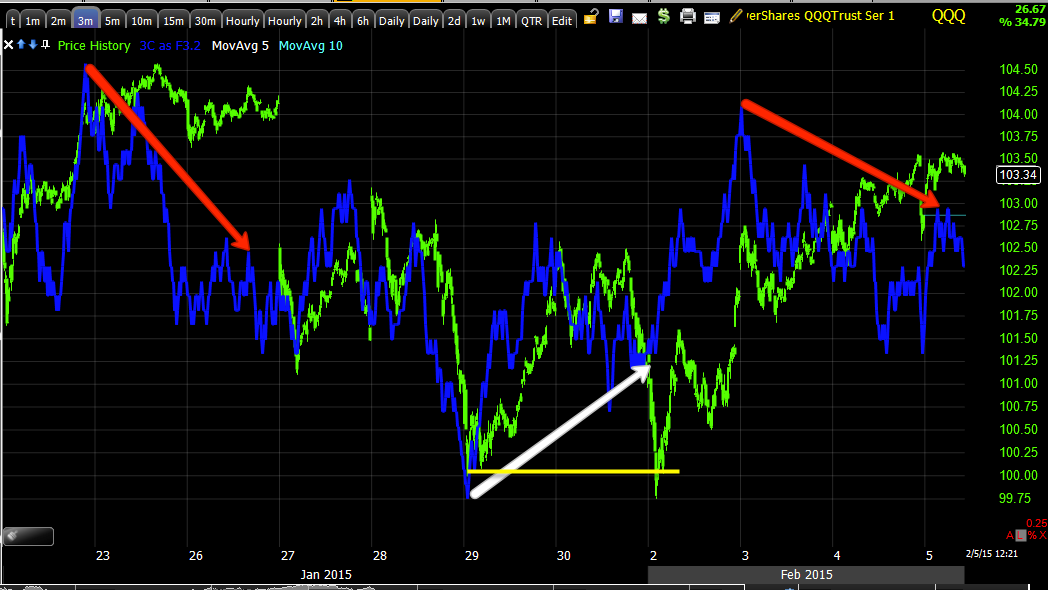
Here's what normal looks like in intraday steering divergences, QQQ 1 min.
 This is "normal" QQQ 1 min intraday, but beyond the intraday steering divergences...

 There's a sharp negatie change in character in QQQ 2 min, just as I showed earlier and in Tech as the NDX is tech heavy.

 QQQ 5 min and the divergence which is about right, but I wanted to point out the gap right in the area, a gap fill would be an obvious target.

 IWM 1 min in line and positive at yesterday's close with a sudden drop off of 3C today, like the 2 min charts, it seems something has changed quickly in the market's discounting mechanism.

 IWM 3 min is about in line with the other averages.

SPY 3 min has unusual movement today

The SPY 5 min divegrence is one of the best examples of a divergence, it has been seen in all of the other averages and it's only a short period of time before this divegrence takes over market action (negative).

Note Energy / XLE also saw an unusual move on their 3 min chart, pointing to whatever this is, being something that happened in the last 24 hours.

XLE 5 min along the lines of the major averages, so it hasn't had that much time to migrate, again seemingly along the lines of the last 24 hours or so.

It's possible Energy stocks don't follow Oil on the upside beyond what they already have.

Look at this VERY strange leading negative in the XLF / Financials 5 min chart, not usual.

 Tech as pointed out earlier also seeing a sharp, negative, unusual move today.

Otherwise the 5 min XLK chart is about in line with expectations.

And the very unusual TICK Index today, finally acting a bit more normal toward the afternoon/close.

This is to say NOTHING of the $USD which I thought would have to come down before a F_E_D rate hike, but I didn't see how, well it's down today and as you'll see, there's a large, longer term chart divegrence suggesting it's just the start, what the catalyst is, I don't know, but as I said in reference to the $USD, the F_E_D will need it lower before hiking, how they do that is an unknown,  but the 3C charts often show us the move before we can understand why, the problem was at the time, the 3C charts weren't showing us the negative divegrence, they are now, I'll get to that shortly.

I'd stay patient with an op-ex Friday and pin coming up tomorrow, but also the NFP, which will be the key data point this week at 8:30 a.m.

I don't think the charts are there yet to take strong action broadly, but today has certainly moved them closer quicker for whatever reason.

More to come...


USO / Crude Update

Other than a couple of posts dealing with the USO/Energy Sector/MArket influence and Crude Inventories, this was really the last update of significance as to USO/Crude's action, expected action and mass psychology as it relates to USO and what is likely to come next.

From Tuesday, February 3rd, USO Update

"Oil is now on track for its 4th consecutive daily gain and it appears, as usual, the bottom callers are in, just in time for what should be a little consolidation which will likely kick them out of the trade and turn them bearish again just as USO makes another leg higher.

Other than the Mass Psychology of calling the obvious long after it has occurred and taking it to an extreme of a "Bottom", which this clearly is not, the market is finally noticing what we have been forecasting for weeks, but it does look like we are at an area of natural consolidation, one I'm sure will be interpreted as "Oil is not at a bottom, it was a false start"."


The mass psychology of all of the bottom callers who didn't call a bottom, they saw price move up and went overboard including Cramer, which was nearly as wrong as you could be in his timing, oil only moved a little higher after his "Smell a bottom" comment, I get how retail gets over-zealous, calls a bottom and has no idea why this should be a potential bottom (No fundamental evidence, no technical evidence), all they see is what price did last and they chase that and make assumptions which is about as far as you can get from objective analysis, it's emotional group think.

The pullback in oil was almost perfectly timed with the master of retail thought, Jim Cramer's off base comments about smelling a bottom. At that point you could use mass psychology and no other technical indications other than the increased ROC of price to the upside following his comments, the "seemingly" bullish... RED FLAG, to call a pullback.

My thoughts on oil/USO have been that we'd see a sharp rally, a short squeeze, a counter trend rally, but as of yet, no evidence of a bottom. I still think we have plenty more upside to go and as retail who was busy calling a bottom Tuesday quickly changes their tune over a pullback/correction in USO/oil, they are adding the additional short exposure that will ramp USO even higher on an additional short squeeze.

As for the charts, I was watching them today and the gains in oil, I didn't put out any calls for a possible new long trade/ entry because I suspected that we'd see today's move fade, it's just not big enough in a single day of correction to support the additional gains that it is capable of. Understanding how crucial a base is to supporting a move is one of the best uses of your time simply by going back and looking at historical charts. You'll develop a feel for the original base, the trend and what a proportional correction is likely to look like.

Here are the charts I think are most important.
 This is the daily USO chart, in regard to a base...

This is what the 2009 USO base looked like and it didn't even move much after, but look at the size compared to now.

 This is the 2 hour chart for USO from distribution to confirming the downtrend to a leading positive divegrence.

I'm not saying this couldn't turn in to a base, but there's no objective evidence of a base now, which shouldn't discourage anyone as a counter trend rally is going to move faster and further in that time than a base and a new trend, it just won't last.

 USO 30 min and a leading positive divegrence, the main point so far is there's no damage to the chart, suggesting additional upside, in fact from my expectations for this move, we've barely started.

 The 15 min chart shows the base and an increasingly strong positive in an intermediate timeframe which is more of a timing divergence than a 30, 60 min divergence, in addition all price moves have seen 3C confirmation so again no damage to the charts even in an intermediate term timeframe.

 The 5 min chart shows the increasingly positive divegrence/base as it head fake/ran stops and at #2 we have the typical 4 stage cycle mark-up and at 3 the distribution phase which is less top and more pullback.

The lows from yesterday saw a positive divegrence, but in my view this was simply too soon for additional upside without more consolidation.

A close view of the 3 min intraday chart shows that base at the lows or positive and the run up today as well as the rounding over on a negative divergence. It would not be uncommon for price to move back to yesterday's lows or even lower and build a stronger pullback base to start the next leg up from.

Crude Futures show broadly the same thing, although timeframes differ a little.
 4 hour (CL) Brent Crude Futures with the negative sending crude lower and the recent positive like USO.

The 15 min chart, a small positive divegrence, in my opinion not large enough to support a strong next leg higher and in line on today's move.

The more detailed 7 min CL chart shows the negative in to yesterday and in to today's highs.

In my best guess opinion...
Using our X-Over Screen, it would seem reasonable for price to consolidate along the yellow 10-day and blue 22-day moving averages before the next leg up, we just need to watch for improving near term (short term charts' leading divergences) strength, but this general area along the 2 moving averages seems about right in terms of depth and time.


Technology/ XLK

We've covered Tech before, it's not a pretty sight, there have been some significant trend changes recently and in to 2015, I'm giving you a look at some of the background, longer term charts just to get your bearings, what I'm really trying to point out is the strange behavior today and it showing up in Tech which I do like as a longer term position short, whether short XLX , using the leveraged TECS (3x short Tech) or just broad exposure via a QQQ short or leveraged ETF derivative like SQQQ (3x short QQQ).

 XLK/Tech Daily chart, note the clean uptrend and then the increased ROC to the upside peeling away from the trendline, this is the "seemingly" bullish activity that is almost always a red flag warning of an impending change in trend (orange arrow), suddenly there's a big change in trend with the first major lower low in well over a year followed by a more lateral trend that if you look closely is a series of lower highs and lower lows.

 Here's a closer look and as far as the most recent swing to the upside, note the candlesticks and volume.

 The long term 2 hour chart goes from confirmation to a sharp negative divegrence leading to the break of the trend and since the lateral Q4-2014/Q1 2015 downtrend, note the leading negative divergence and this is a serious time frame at 2 hour.

 The 60 min chart may look slightly different, but the signals are exactly the same, the negative in to the big dip at the October lows and a leading negative divergence since in to a lateral trend with lower highs/lower lows, a downtrend.

While a major break has not occurred since the October lows, if you look at XLK from the October lows/base/cycle, it's clearly rounding over in the trend of lower highs/lower lows.

That's kind of the background information, the very negative tone in Tech.

At a 15 min chart it's not only leading negative, but you can make out each of the negative divergences at the series of lower highs.

 The same is true of the 10 min chart, just to show we have what I'd call a full house through multiple timeframes.

However for the current activity rigt now and today's strange trends, check out this 2 min chart showing the most recent base area since the 14th-16th's failure and note today's activity specifically on this 2 min chart, seeing sudden and seemingly pretty strong distribution.
XLK 2 min.

The average that would be most effected my this would be the Tech heavy NASDAQ 100/QQQ.

Here's the same 2 min chart in QQQ today...
I don't think that's coincidence...

Market Update

We are green for 2015, well at least for a bit today any way.

The market continues to have a very strange look about it, especially intraday breadth. To me it looks like intraday charts and price action are starting to roll negative.

 While the chart is not SCREAMING or jumping off the screen, the intraday SPY (1 min) continues to deteriorate.

Other than the opening ramp, there hasn't been much activity the rest of the day, see the R2K futures below...
The overall negative tone trend pops out on this intraday Futures chart of R2K, but also note that beyond the opening ramp, not much has happened since.

 The SPY 2 min is showing some change in character as well, it isn't screaming at this point, but it is moving in that direction at a pretty steady pace.

Of course the highest probability for the resolution of this move is seen in all of the averages on their 5 min charts, this is not good as this is one of the earliest, serious timeframes, 5 min which is what I consider to be the earliest timeframe showing institutional activity.

 The SPY trend since the October cycle has also shown very clear deterioration, especially since 2015 started.


Q's intraday are showing similar consistent negative activity, while not screaming or jumping off the chart, if it keeps this up, it won't be long before it is screaming and popping off the chart.

 QQQ 3 min which is where the positive divegrence reached for this most recent swing in the large choppy range is also clearly turning negative.

And the 5 min chart with the reversal process.

I put the 10 min chart in the post just to show the reversal process, sometimes we watch the market so closely we expect things to happen faster than what is reasonable, so I thought I'd show you what has been reasonable in recent past reversals.

Note that each top side reversal is proportionate with the preceding trend, the larger the uptrend was, the larger the topping reversal process. Also note that as usual, downside reversal areas are almost always much tighter than upside reversals, this has been something we have seen for a long time and nothing unique to this particular market/time period.

The overall trend of the 3C chart is probably one of the most important pieces of information on this chart.

 IWM 1 min is also acting like SPY/QQQ today, which is uncharacteristic for recent action on the timeframe.


 And the 3 min IWM in the chop range and the different cycles including the 6th, the 14th-16th and the most recent one as well as their distribution areas and reversals.

 And other than the 5 min chart leading negative in the most recent cycle like all of the other averages, again the most important data on the chart is the trend of 3C through the entire zone of chop.

Sometimes these choppy ranges can be bases, but I think we can rule that our judging by the 3C trend through the range.

And what is grabbing my attention most today as a "Strange market" is the NYSE TICK, usually there's some trend, this trend is pure lateral, no extremes in the TICK at all, pretty much in a very tight range between + and - 500. Very odd.