Thursday, May 23, 2013

EOD

Well there's a lot to show in many ways and there's not a lot to talk about in many ways, it's going to be a challenge to write tonight's "Daily Wrap".

I think the biggest surprise of the day is how bullish retail "Knit-Twits" remain; it's a case of "Pavlov's Dog Experiment". I'm serious!

AAPL was a great example of the Pavlov's Dog Experiment, AAPL does one thing for so long and traders actually lose their objectivity and fall in love with a stock. I say, "Fall in love with your spouse, Fall in love with Ben and Jerry's Strawberry Shortcake Ice-cream, but never fall in love with a stock".

Once we are conditioned to expect certain behavior from a stock or a market, we are in real trouble and while I think this is normal for people, I expect more from traders. I can't believe how many are still Uber-bullish on this market and even crazier still is some of the justifications and feelings about what happened not only yesterday, but overnight as well.

We know that Japanese JGB (Japanese Bonds) futures were halted just after their open as the JGB futures went limit down on the open! The USD/JPY lost over 200 pips overnight, the Nikkei had a 9% range-losing 9% off the intraday highs and closing down -7.32% after an even crazier parabolic run than the US has seen.


 As ForexLive notes, the striking correlation between the current rampage in the Japanese stock market and that of 1987 is stunning. In 1987, the index had a remarkably smooth 89% rally that began in early November, lasted 186 days, and was followed by a 9.1% correction. Currently, the Nikkei 225 has had a remarkably smooth 85% rally that began in late October and has lasted 191 days culminating with last night's 9% correction. That was a true correction, I believe history rhythms, but doesn't repeat as Mark Twain said, this is a much different market, in fact this is a market with no historical precedent, not even close. 

We have the most globally connected economy with most of the developed world either in recession, coming out of one or going in to one, many are double and triple dipping. We have unprecedented Central bank action across the globe, not to mention the U.S. In fact, from 2007 to the start of May, we've had 512 Central bank interest rate cuts across the globe!

If Hank Paulson had a Bazooka, Japan's P.M., Abe, has an early release of the new Gerald R. Ford Class U.S. Aircraft Carrier. After more than 2 decades of rampant deflation in Japan (remember in the 1980's it seemed like Japan owned the United States?) Abe and the BOJ embarked on the largest, most out of control QE the world has ever seen. Yes, out of control, this is like a squirrelly 1967 Hemi-Cuda with a Posi-rear axle and a nitrous kit, they literally don't know if it will run off the road. Oh, and by the way, this is the world's third largest economy.

While the BOJ is actively (it's a secret though) buying JGB's trying to stabilize the rising yields, it's just not working. In fact after all of Japan's recent volatility and last night's 7.32% close down (now that's a move-not these +0.27% moves everyone gets so worked up about in the U.S.), CME just hiked just about every Nikkei related future's margin by 33%, so sorry if you are 100% leveraged and need to come up with another 33% in margin. Watch the Nikkei tonight because I guarantee after the super-parabolic move due to the world's largest QE ever, Nikkei traders are likely more than 100% in, with full leverage so between margin calls and the added 1/3 margin hike tonight, things could get interesting tonight.

Japanese traders, take a hint from the U.S. traders and just keep buying the dip, a 7.32% decline is a nice dip, BUY IT!

Most Asian markets were down on average about -2.5%, China's PMI data showing their manufacturing sector has contracted again which last happened in 2012, certainly didn't help,  ESPECIALLY GIVEN THE ENTIRE WORLD BELIEVES CHINA SHINES UP THEIR DATA TO LOOK A LOT BETTER THAN IT IS.

The European BE--500 closed down 2% for the biggest 1-day loss in 10 months and that was with a closing ramp higher!

So while we fully expected as of yesterday the market would not only run out any new momentum chasing shorts that latched on yesterday, at the same time it should continue to blow Pavlov's whistle and keep conditioning retail traders to buy the dip, no matter what because they did the first time (today) and that worked out great. What? A bigger dip you say? Well just add more leverage/margin and buy that too and so on until you are buying dips that have retraced 50% of the 2009 lows to 2013 highs, then panic and watch the market slice through the 2009 lows!

I'd say, that's roughly the game plan.

I'll be back with some charts and anything interesting I find, honestly I saw a lot of potential opportunities today, but the market action itself wasn't interesting, it was expected, but then again, so was the break in the market and yesterday is not really the break I'm talikng about, I mean the break that fulfills this divergence.


Someone Is Using Our Concepts

Anyone here go by TrilionDolarMan on TeleChart/Tc2000 Chat?

I was missing a few bars of EOD intraday information and the fastest way to find out if there's a Real-Time issue is to look at chat as everyone will be talking about it, then I see the name above reference in CAPS, "Crazy Ivan", which as you know, is one of our concepts named specifically by me after a movie that I like a lot, "The Hunt For Red October" because the concept behind this Russian Submariner tactic is similar to a run of the stops both above resistance and below support, the same way Russian subs do a 180 degree U-turn to see if anyone is following in their baffles as the acoustic signature of another submarine following in their prop-wash cannot be heard.

I specifically named this move in the market after that movie, I find it highly unlikely that someone else would use the same exact term for a 20 year old movie.

It's fine if you are the person, I'd just be interested to know if it's one of our members or if our concepts are making it out beyond these webpages.

MCP probabilities for a move up

Very speculative, short term as well

TLT Spec Position

I still have the TBT Puts which are like TLT long, but if you are nimble, if you have en here, TLT looks like it will see another move higher in the near term.

The longer term looks pretty solid, but I'm just talking about tomorrow perhaps. I think you need the leverage of calls to make it worthwhile, but the charts on a number of intraday and further out charts looks excellent.

I'm going to add to the GLD June $133 Calls

I have a feeling these could appreciate over night. You will have to be VERY nimble to enter this trade as it may require it be closed on the open.

It still looks like it needs to pullback before we get the bounce I'm looking for, but from what I see, I think GLD will make at least a small move higher.

THIS IS A VERY SPECULATIVE POSITION.

Yesterday's TBT Put Still Open

This is probably getting a little confusing, but yesterday I saw divergences suggesting the "Flight to Safety" Treasuries were going to be up today so I opened a TLT Call and opened a TBT Put, TBT is the 2x leveraged inverse or "Bear" version of TLT, so in essence, by shorting TBT with a put, I am essentially going long TLT with 2x leverage as well as the Put/option leverage.

I closed TLT and took profits as soon as I got home from the Dr. this morning, but left TBT open.

Here's why...
 In the red box, I closed the TLT call opened yesterday afternoon-I told you this would be hit and run trading as the market gets volatile and choppy, but that was a nice 21.5% gain for about an hour or market exposure not incl. overnight.

I didn't close TBT puts because of the reason I warned you of yesterday-they have so little volume that it's hard to get a bid, big mistake.

 Any way, TBT needs to go down and TLT up for the TBT put to make money, as you can see on the 1 min it's leading negative.

Same on the 2 min

The 5 min is quite clear, this chart alone could tell anyone that the market was in trouble.

And the cycle in TBT 15 min with accumulation, confirmation, distribution and now decline.

Closing AAPL Calls for now at a 5% gain

Looking for a better entry

$USD May Help to Explain

The $USD's primaRY TREND IS VERY BULLISH, THE SHORT TERM TREND LOOKS AS IF IT COULD PULLBACK AND THE INTRADAY TREND LOOKS AS IF IT COULD BOUNCE. BEING RISK ASSETS TYPICALLY ACT THE OPPOSITE OF THE $USD, THIS WOULD MAKE SENSE,

 RISK ASSETS PRIMARY TREND IS BEARISH, THE SHORT TERM LOOKS TO BOUNCE AND INTRADAY LOOKS TO PULLBACK-SORRY ABOUT THE CAPS-I'M WATCHING THE KEYBOARD RATHER THAN THE SCREEN-"HUNT AND PECK TYPING"

 Primary Trend-Daily $USDX with a huge accumulation area in a "W" base.

30 min chart looks as if the $USDX pulls back-allowing the market some room to bounce, but intraday...

The 5 min chart looks as if the $USDX is heading up, meaning risk assets including oil should move down.

Another Example of Patience

The QQQ...

 This 10 min positive leading QQQ divergence has me looking at the Q's as a decent bounce candidate, but I've stayed patient, take a look at what happened next...

The intraday chart goes negative and the Q's look set to pullback.

MCP

MCP is a long we have been in and out of, I generally like it, but on corrections.

I was emailed about it, it does look like it could see a short term move to the upside, it's not where I'd want to personally buy it as a high probability trade.

In looking at MCP, I'm noticing on other charts as well that this "potential pullback then bounce", could be a bit different than expected.

First the entire thing could collapse because most of the stocks that look as if they could bounce have short term divergences at best.

Some look like they could see a bounce that is so quick, I'm not sure you'd even have reasonable time to asses it and close the trade.

That is unless, there's going to be a larger divergence, but further out, as in tomorrow is Friday with a 3-day weekend, many traders may be loathe to hold any longs going in to this weekend with all the bad news that could come out. So perhaps we don't get real accumulation (if we get it at all by that time) for a short term bounce until next week.

Also tomorrow is an op-ex Friday, I don't know that it will matter much, but we have seen Thursday's close near the Friday pin.

In short, stay patient, wait for the high quality trades.

Also just to avoid confusion, the fact I'm looking at playing some short term bounces does NOT in any way diminish my thoughts about this market.

I have NO INTENTION OF CLOSING LONGER TERM EQUITY SHORTS/ETFS BASED ON A SHORT TERM EVENT.

Entering Half size USO June $33 Calls

It doesn't look like there's a high probability pullback, although I suspect USO would likely move with most risk assets. This is one position that is discounted already, I've been expecting a move up and the charts are in great condition outside of intraday and intraday they are in good condition.

Since SCO has a lot less draw down, I'll leave that open (Oil 2x short ETF) until I feel strongly enough to enter the other half of the USO Call position.

Again, these are all Speculative and should be money you can afford to risk. In other words with the profits of the last 2 days, I have some funny money that I can afford to risk.

It Has Been Hard To Sit

Speaking of Livermore's quote, that's what I have to do now, but for a different reason. Let me give you an example, SLV.

 This 2 min leading positive divergence in SLV really makes me want to get right in there, I know with only a 2 min positive this would be a very short trade indeed and I know that probabilities remain high that this is not the pullback I'm looking for. After waiting a bit longer, the fastest 1 min chart below confirmed my patience...

The fastest chart went negative, suggesting SLV will pull back, so the patience paid off, but even if SLV took off to the upside from here...


It's not a High Probability trade. The probabilities may be to the upside, but we need a better entry and less risk, SLV is right in the middle of a range, there's no better entry or reduced risk, but if it does pullback as the 1 min chart suggests, then maybe it will become a High Probability trade.

If it doesn't, we just wait for the next opportunity.

These divergences are so young, most of this theory is based on market behavior, it just so happens we have early divergences seemingly confirming the "Market Behavior " theory and all that is, is understanding how Wall St. plays the game.

If you have emailed me, it may seem I'm not busy as I'm not posting a lot right now, but I'm jumping back and forth every couple of seconds between about 50  assets looking for clues.

Please Don't Chase Anything

I'll let you know when divergences are looking appealing and there looks to be a high probability trade at hand.

We still have some very strong signals in protective assets like TLT, those will have to be tamed down, however it does look like the "Buy the dip" crowd is stepping up on the dip thus far, I just  want to make sure we are not following retail, but smart money (as a short term trade).

The bottom line is, even if the probabilities are good, we still need an excellent trade set up. I can tell you the probabilities are high that the market rises, but if we can't buy in to a decline at better prices and lower risk, higher probabilities do not equal a high [probability trade.

I'd rather miss the trade than take a sub-par trade just so I don't miss the probabilities, because then I'm setting myself up for the probability of too much risk for not enough potential gain.

Entering AAPL Call June $440 1/2 position size

These are speculative size positions to start with, so this is a very small entry, 2% of portfolio approx.

The short term longs are setting up

I may start entering some 1/2 size positions, half of the intended Spec size position. Then if we get more downside, I'll add to them.

I'll call them out as entered.

The First Part of the Plan Is in Motion

Now, before entering any short term (SPECULATIVE) options, mostly calls for a market bounce,  we need to see 3C verify, for the calls, accumulation. For the TBT put position from yesterday, I need to see accumulation in to price declines or TLT seeing negative divergences in to price advances-they are the same thing as TBT is the inverse leveraged version of TLT.


Watching AAPl as Well

For a potential trade, I'd think since we are probably not talking about a larger trending move, but it should be emotional, there's probably not much profit incentive to try to swing or "momentum" trade AAPL stock, I'm thinking yoiu'd need the leverage of calls.

I am leaving my June and next week Puts open, these positions , if we take them, will off-set any draw down and I want to maintain short coverage, this market can change overnight-just look at the Nikkei last night or to a lesser extent, the US averages yesterday.

I'd probably look to freshen those puts up a little though at the right time by adding a little to them at much better prices, but for now, I want at least some exposure to the short side for a possible;e Black Swan Event.

XLf - Financials

This is one of the weaker candidates.

I'll be watching though for a pullback in XLF/Financials and then... We won't enter ANY of these positions just on a pullback, they have to prove they have the short term accumulation to make them worthy of a trade.

Again I want to emphasize that the bounces to the upside I expect, are all very weak and the longer term or more important charts are very negative, so this is just like riding a bounce and then selling it and selling it short for the bigger move down.

For XLF, you can use FAS as a 3x leveraged equity long if you don't want to use options, when it is ready to reverse down again, you can use FAZ-3x bear financials.


Entering Half position GLD Calls

I'm looking at GLD June (monthly) $133 calls, I'll enter half now, set alerts and enter the other half on a pullback.

Remember to keep these spec. size, there's a ton of volatility coming.

Adding back GLD Call- This will still be a speculative size position

Not sure if this will pullback-it has consolidated all day and the positive signals have been stronger as the day goes on.

SLV

SLV should be a long on a pullback intraday, I'm looking for at least below $21.60, like yesterday/today's GLD call, this is a short term position to take advantage of a SLV pullback to get in and then SLV should move up with the market. I'd say this may be a 1-3 day trade, with options probably shorter).

There are leveraged silver long ETFs as well that could be used.

SCO / USO

On the first pullback, I'll probably close my SCO long positions and hold my USO calls. The SCO trade could be left open as it is longer term USO down, but for the scenario laid out, max profit is taking profits in SCO, letting USO ride out the upside and at the right time going short USO by adding SCO long back to the mix.

TBT Trade

I think TLT long or TBT short or TBT puts if the B/A isn't too bad can be used for this short term move I'm talking about, that's the first move of market down to accumulate more before market heads up on a psychological move to tell the BTD crowd they were right and keep doing what you are doing as well as shake lose the shorts as they get squeezed.

When that move ends, it's back toi the downtrend and probably more violent than we can imagine.

So this trade above is for the first part only, it will possibly be over today.

Market Update

From taking a look around, I do think the market itself, the averages, will most likely pullback a little and will accumulate some more for a nice, emotional pop to the upside that washes away the horrors of yesterday for the buy the dip crowd and as I said yesterday, shakes lose any new momentum shorts that jumped on yesterday.

The fate is still sealed, but it's already obvious they will use the 3 levers HYG (up), TLT and VXX (down) to support this move which has no real support otherwise, other than whatever they are willing to throw at the manipulation-retail itself can't do it.

So you might want to think about any short term positions you have, long or short and plan accordingly.

Examples...

HYG needs to move up to manipulate the SPY arbitrage positively.
 The 2 min chart is leading positive, a short timeframe, but good enough for a near term move.

Longer timeframes...

That's huge money flow on a 4 hr, negative-HYG is for all intents and purposes, done, bur it will bounce as we have lots of volatility coming.

VXX needs to go down to manipulate the SPY arbitrage positively.

2 min chart has minor accumulation, this is why I think TLT makes a little run higher/the market lower (not worth trading this run in my view) and then the market continues to accumulate a larger short term base as suggested last night.

 VXX 5 min is leading negative-this fits perfect with the scenario laid out above.

VXX 30 min is more than a little positive, this is the ultimate direction, up and the market down, but we are talking about top/reversal volatility, we are getting ready for these long term trends.

TLT needs to go down to effect the SPY arbitrage positively.

3 min is leading positive, I'd be looking to sell any short term TLT positions (long) in to the next move up intraday which should be close (down for the market).

Daily TLT leading positive-so again the longer term trends or the most important are still well within the Bearish camp, very much so, but we are talking about short term volatility psychological warfare on traders.

Put URRE on you Long Watchlist

I has some work to do, but it got the pullback started, as it flattens out to a range and looks very dull, accumulation will pick up here and this should be good for another nice run.

UNG Update

I think UNG could see a shorter term pullback, I'm sticking with the long position and would like to add back the shares I recently sold on any short term weakness.

I'm also interested in checking out LNG, I think it's way overpriced, but it's coming down after a short term bounce, in fact it would probably make a nice pairs trade with UNG for a while (short LNG / long UNG) until it gets to a reasonable level.

The more reasonable CHK is also an interesting play on NG, I think both can be had for lower prices so they'll be on the watchlist.

UNG...

 1 min intraday, UNG looks like it will pullback, I've been waiting for that to add the shares recently closed to lock in some gains in anticipation of a pullback.

5 min looks great so I don't think it's much more than a corrective pullback.


UNG has ALWAYS been a long term trade idea, like an investment and this 2 hour chart shows why, how it's developed and how it is getting stronger.

I think it's a hold with an "add-to" on pullbacks.

GOOG As an Example

I already started a GOOG short equity (Core-longer term ) position, I left plenty of room to add to it at better prices and we are in the area. I'd consider a short term call position to ride a move higher that I think and thought yesterday, will be used to lock in the "Buy the Dip" crowd, they'll feel justified in buying the dip and at the same time, any shorts that jumped in yesterday will likely get knocked off.

For now though I  can't buy a GOOG short term (day or so-) call for this psychological warfare, on the other hand, I could enter or add to the equity short, but I think chances are good we can get a better entry, although no where near as important as it is with options.

So I'll wait on both, I'll show you why and what I will wait for. I will keep looking for some Hit and run trades that look favorable.


 The most important is the 60 min chart, above the red trendline is a head fake move and part of the top, note how negative 3C is, smart money has known for a long time, that is why we have these long signals of them selling and probably creating enormous short positions (by virtue of the size of the negative divergence) that is on par with a bubble this big, fed by F_E_D liquidity that is obviously going to be shrinking as they try to also keep the market from forming any more of an asset bubble.

This longer term view and the unprecedented size, because of the unprecedented US and Global Central bank and economic policies is not a good options trade, but an equity short can withstand the extreme market without seeing too bad of a drawdown. This is why this area in the big picture is fine for an equity short,, but we can get better positioning.

 The 15 min is telling us the strategic view is moving to the tactical execution, this is where we really want to get serious about building out those positions.

 5 min chart is not at a good risk/momentum area for a call trade for short term profits, but...

The 1 min chart suggests GOOG may pullback intraday or so, that will give us a better entry for a call position to ride the bounce, when that is closed, we'll be close to adding put positions as well as filling out the equity short or for new positions, entering equity shorts.

Patience, although I'll keep looking.

Let me reassure you, if the data changes, I'd gladly change my position, but the data has been overwhelming in the message of the market.

They say, "Price pays", but in a market like this, "Price also takes away". I wouldn't want any longer term longs as a waterfall sell-off will put them at 1-2 month lows on a gap opening. The risk reward profile for being long here anything but short term trades, is very dangerous.

Why do you think they want to lock in the "Buy the Dip " crowd? They want to convince them that after a day like yesterday, buying the dip like they have done the last 4 years is still the right thing to do, this will lock these longs in and keep them buying as the market goes down until they are carried out feet first.

Market Update

As suspected, TLT has come down, there are some small positives that should send the averages higher confirming the "Dip Buyers and locking them in.

TLT, although filled the gap, is already starting to accumulate again, it's too early to take a position, but it will come up again.

The market averages are accumulating, but as shown yesterday, the damage done is insurmountable, so these are great trading opportunities as well as Tactical entries for strategic short positions.

Our USO long should gain shortly.


I'll bring you more shortly, maybe some new trades.

Buying the Dip

It is amazing because there are so many red flags for so long and these retail twittertards just don't get it, they don't get what the F_E_D has been saying, what it did say yesterday.

More sentiment from the stream, again thanks to Sam...


"TIP of day OF goog breaks thru 890 runs to 900 in a flash"

"correection is over... load the boat lol"

"volatility coming out of the market, as usual before the holiday weekend"

"a good sign is that small caps not falling apart leading on the downside there is still hope for the bulls"

The key words here are "Hope", the thought that things are "as usual", "Correction is over".

I think the market will allow the dip buyers to hang themselves, that's why we entered some long-type positions and closed some short type positions, but not only will the market take out the dip-buyers (as I said, these people are run by emotion, not facts), in doing so it will run out any new shorts although it seems few of the "Momentum" traders jumped on that train so lets just call "Momentum Traders" what they really are, "Perma Bulls" that don't recognize that the element that drove the market higher for 4 years just said it's getting ready to back out.

Amazing ignorance, but great for us.


We have a nice Gain in GLD-This one is on you

I personally think GLD has some more base building before it really makes a strong upside move, but it is still very positive.

Whether or not to take the nice gains form GLD calls from yesterday which should be up between 25% and 30% today (or leveraged long ETFs) is up to you. On one hand I want to stay nimble and hit and run and think GLD has a bigger base to build, on the other, the market is increasingly unpredictable and the near term institutional timeframe of 5 mins is very strong.

I can only give you the charts...
 GLD's 5 min chart...This is still leading positive, the faster timeframes aren't telling me much yet. I only had a small position of a single contract I just closed.

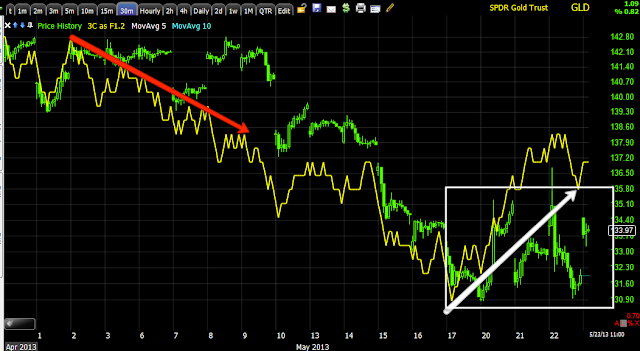
The longer term 30 min chart shows the distribution sending GLD lower, an in line status on the trend down and accumulation starting on a 30 min chart which is huge, but for this to continue to accumulation this large of a base, GLD will have to come down to be accumulated and run in the lateral range in the white box.

We'll have plenty of opportunities. I'd just say, Bulls make money, bears make money, pigs get slaughtered.

AAPL TLT P/L , Sentiment and Rank

We have several members that feed me sentiment from monitoring the Stocktwits/Twitter Stream, is it any wonder with comments like today's that our rank is so high on this move? Don't miss the sentiment part-thanks again Sam.

First the P/L for yesterday's TLT and an AAPL put.


At the fill for the AAPL Puts, it's about a 15% gain


At the fill for the TLT Calls from yesterday, it's a +21.5% gain.

Like I said a couple of days ago, in this current market environment, we build out longer term equity positions and use guerilla hit and run tactics, in and out. Don't try to be a hero with the volatility coming our way.


Here is the current sentiment from our member who sends me updates, it seems No one saw this coming, which explains our rank for the Options Tracking Portfolio:

No one on my stream saw it coming. NO ONE!!!

"Rolled over calls to next week.

I was playing for a gap up in Apple this morning. I did not expect the overnight market/Apple dump.
and on and on."

Well, I'd say that "No one" saw it coming wasn't exactly true, but we're rarely on the stream. Again, you might be sick of hearing it, but one of my idols, the greatest equity traders that may have ever lived, Jesse Livermore from the early part of the 20th century (during the 1929 Crash) said (and I paraphrase),

"It wasn't me being right on the market, a lot of people were right, it was my sitting that made me money"

Meaning Jesse stuck with his convictions and wasn't run off by emotions and price which as I always say, "Is deceptive". Other traders weere right too, they were just run off from price/emotions.

There's immediate gratification and then there's trading and investing with the big picture in mind, I try to give you a little of both.

Our weekly gain doubled since yesterday and the monthly even, for the entire month of May, despite having a couple of worthless expirations last week, is way up there too.


This week's rank, #4 of 760 portfolios. Remember too that most of these people are swinging for the fences with huge positions so if they are right, they are right big time. Our positions are only around 5% of portfolio value, they are much smaller which means we have a lot more moving in the right direction.


Weekly Ranking


Monthly Ranking

Closing TLT Calls as well

I'm Back & Taking Profits on the June AAPL 445 Puts

The AAPL short equity position stays in place, I'll look for a new option entry for AAPL.

Pre-Market

To say all heck broke loose would be an understatement.

The previously stellar performing Nikkei started the session with JGB futures halted on the open as they went limit down, not too long after the Nikkei lost over 1100 points, swinging 9% from the highs to the lows and closing down -7.32%.

After that Chinese PMI came out and sent the country's manufacturing sector in to contraction for the first time since 2012.

All other major markets across the world closed down between 1.9% and 7.32%, most in the -2.6% range.

Our Calls in GLD should be happy, here's what gold did overnight...

Gold futures overnight.

As for the market, well that depends on the PPT, I don't believe they are there to manipulate the market higher, I think they are there to maintain an orderly sell-off, it seems clear the F_E_D doesn't want any more of a bubble in the Stock market.

This is ES which was among the futures I said "Didn't look good" last night, it went from making a new high yesterday for the week to a new low today for the week...
There is a positive divergence building in pre-market, I'm guessing its the PPT, but that's just more opportunities for us, I'd try to stay fairly nimble with options, taking gains on momentum -watch momentum indicators for signs of reversals, the core shorts I'd try to build in to any bounce or strength.

NQ is building a similar divergence.

My guess would be if we got an early bounce, by the afternoon that would likely be close to reversing. We'll let the market tell us as usual though. I did think it was probable for the IWM/SPY and others to build a slightly bigger positive divergence so this may allow that unless we just go over the water fall.

The USD/JPY...

This fell well over 200 pips overnight on Japan...

You can see it too has a positive divergence this morning.

That means the Yen gained a lot overnight.

Remember, GLD was a trading position.

I have an 8:15 Dr.'s appointment, I should be back in time for the open.

Let the fun begin. This is just the kind of market you don't chase, you were either in on time or not, those poor souls who are still buying the dip!