Wednesday, July 13, 2011

Bonds To Pullback?

Take a look at TLT...
 Here's the very typical bullish descending wedge that move into a lateral base, other examples can be found in DUG, EDZ, FXP just to name a few, but it's been a pretty common occurrence.  Here we see price approach the breakout level of the base in May/June, note the problems with RSI from late May to early June and then again after the DIP (RSI after the dip is lower then it was at resistance through June. A pullback from the initial contact with resistance isn't rare, but the volume on the advance after the pullback should have picked up substantially.

 A look with the 50 sma. If you look at this as a rounding bottom, the problems with volume right now are obvious.

 TLT (Bonds) largely have an inverse relationship with the market, typically they are a flight to safety play. You can see the relationship though is not on a 1:1 raton as the SPY (red) would be down around the red trendlne.

 The daily chart shows the negative divergence at the 2010 top and the positive divergence at the bottom, this is a long term base with good 3C support.

 However, the 60 min chart reveals some relative weakness, you can see distribution at resistance and on a relative basis, 3C is lower now then t should be compared to the white box at the left.

 The 15 min chart shows more detail and you can see the negative divergence that caused the dip and a current negative divergence at resistance.

The 1 min chart shows detail of the last few days, a negative divergence at resistance and several on attempted moves higher on the way down. Currently TLT is in a negative divergence. Taken with the 15 min divergent, this looks to be a pretty good timing signal, the only other  thing we could ask for as far as timing signals go would be an upside false breakout.

The obvious play here would be TBT (Ultrashort 20 year). As of now, I view this as more of a swing trade then a long term trend problem, but we'll see how it plays out.

The Miners Trading System

As of tonight, both systems are out of the DUST trade because of the stop-loss rule. I know some of you are sticking it out and I'm always available to provide updates as I posted an earlier update on DUST today.
As of now, there's no position, this may change tomorrow. Remember, the power of compounding is a big part of the system so trades should be made that include all of the gains of losses from the last signal. If you alter the amount you invest in each signal in an arbitrary way, you will not see the results of compounding. As always though, any trade should fall within the risk parameters of your risk management plan. I prefer the 2% rule.

I've had some questions about my perspective on gold the last few days and if that might effect  DUST positively. There is some correlation between gold and GDX although GDX s specifically gold miners.

Here you can see the correlation between GLD (red) and GDX (green). There are times when the correlation is stronger then others. The ratio or relative performance of the correlation is very poor. For example, YTD GLD is up 30.20% and GDX is up +17.68%.

One of the reasons I'm bullish long term on gold miners is because of the relative performance, which has been very poor for the miners as many people seek to take physical possession of gold. In years past, gold miners have actually outperformed the metal itself, not so currently. However, as the price of gold rises, people will always gravitate to a sale or discount, that's the mechanics behind the Cats and Dogs trade near the end of an extended bull market when they are firing off the most. People who didn't trust the rally and are late comers, seek to find stocks at a discount and that's why the C&D trades work.

As for miners, when we consider their reserves and their multiples (value), they are currently running at an adjusted rate of approximately $350 per oz. of gold, a significant discount.


The Miners System doesn't have a single line of code that references the price of gold or what gold is doing. What I found and why the system works is based on the following:

Gold miners, especially those outside of the U.S. have costs that are not fixed (wages would be an example of fixed costs). One of the biggest variables in Gold miners cost of operations is energy, specifically oil. Another variable for miners outside of the US is the exchange rate. For example, a mine in Australia pays its workers in local currency, the Australian dollar, however they are pad for their product (gold) in U.S. dollars, so when their local currency is trading rich compared to the US dollar, their wage costs are higher (relatively speaking) then the money they bring in for the gold they produce as the dollar is weaker. This is also a variable. We all know that it is generally accepted that a falling $USD makes oil more expensive as oil is also traded around the world in $USD. The G.W. Bush era weak dollar policy had a lot to do with oil soaring from the low $20's when he came into office. However, the correlation is not fixed and sometimes a falling dollar will not have as dramatic of an effect on the price of oil as other times.

The trading system looks to take advantage of lower energy costs and a higher $USD, but it's not as simple as that alone. The way I've coded the system, it looks for trends in the relative performance of oil and the $USD and when those trends are favorable to the miners, the system produces a long NUGT signal, when they are not favorable to miners, then a long is triggered in DUST. It's a bit complicated with regard to how I define these relationships, but the system is basically as simple as that so in answering some questions recently, the price of gold does not figure in to the signals generated by the trading system.

As you know, I've built in a 3% stop loss rule and that is what has triggered the exit of the DUST trade.

I hope that gives you some more insight as to how the trading system works.

I've backtested literally hundreds of trading systems including most of the ones you have read about in popular technical analysis books and I can tell you that there are very few if any that can consistently beat the market. By narrowing the Miners system down to 2 trading vehicles, it has greatly enhanced the results of the system, I mention that for those of you who are back testing trading systems.

ISRG Short Trade Follow Up

This was an idea from July 7th  (please review the post)


 Here was the setup in ISRG, the all too common False breakout in the yellow box.

 The first candle with an orange arrow broke the back of the uptrend, even though the trade was showing earlier signs via the false breakout. Today was the first noise candle in the current swing move down, a close with a low higher then the orange line (which is the high of our swing signal candle) would end the swing downtrend. Even if that were to happen, ISRG still has potential as a short position. As you know, it's very common for the first breakdown to see a bounce or a kiss goodbye, whether that be to a resistance line, a channel, a moving average, etc. I do have some cause for concern in which I think some choices or adjustments need to be considered.

 Here is the stop we were using which has so far held as there has been no close above the lowest point of the upper Trend Channel, however, I think this has a good chance of stopping out.

 The 30 min 3C chart is cause for some alarm. In red you can see where the false breakout occurred, 3C was in a negative divergence as ISRG made the breakout, showing us that it was almost certainly a false breakout. However now on the 30 min, there's a positive divergence forming at the white arrow, it should be taken seriously.

 The 10 min chart is confirming the findings of the 30 min chart.

 The 5 min chart goes back to the false breakout with a negative divergence at the breakout (first red arrow to the left. There has been another negative divergence on the 7/8 bounce and currently another relative positive divergence at the white arrows. The fact that there are 3 charts all showing a positive divergence makes me take this more seriously.


 Today also formed a Harami Candlestick reversal pattern (the Japanese call this pattern, "mother with baby"), in western vernacular we would call this an inside day and hints at an upside reversal.

 If you want to give the trade more room, the 3-day Trend Channel has held 3 trends, as you can see.

If you want to use this stop, the level would be on a close at $374, this would leave you with a slight loss on the trade as the entry was at $369.77. 


The other options would be to keep using the hourly trend channel and just stop out, although in this case I would consider at least a partial stop out on an intraday breach of the channel, rather then the closing basis. You could also use the swing trade identification method.


You could also use the 10-day moving average as with any new trend, the first pullback tends to be to the 10-day moving average. You might add 1% or so above the 10-day as a stop, you can always check with me to see what 3C looks like. The advantage of the 10-day sma would be the stop out level would be close to $367 which would keep the trade near break-even or a small gain.


In any case, I would view any bounce as a second chance shorting opportunity, if this comes to pass, we'll take another look in the area. 

DUST/NUGT Trading System

Even though today was a stop out on the open, I'm getting a lot of emails about how DUST looks. This is outside of the trading system, but here it is.

In a single word: "Improvement"
 60  min

 30 mn.

 15 min.

 10 mn.

 5 mn.

1 min.

PCLN Short Trade Follow Up

On Monday I showed you PCLN and sad I liked the short trade right there at $544.71.
Here's Monday's entry at the red arrow with the tightest stop at $549, so far so good. Wider stops were around $550.

Here's PCLN now...
 The 3C 10-min chart. There was a small positive divergence late yesterday leading to today's bounce, but that looks to have failed with a negative divergence.

 The 5 min chart is showing the same, confirmation, a slight bounce and the negative divergence on today's bounce.

We are starting a pattern of lower highs, lower lows and the red trendline will mark the next lower low once support there is broken, it should come on increased volume. I still like PCLN as a new trade even here. If you are interested, we could look for some strength to short in to, or you may prefer to short the break of support, making a second lower low in the downtrend, which is a good indication that the trade is moving in our favor.

There's plenty of downside potential here so if you like the trade, you certainly haven't missed the boat.

SPY Update

In light of the options chain I just posted and my guess based on the chain that the SPY would likely close out the week around $132.50 (subject to change if the options chain changes significantly) on Op-Ex Friday, these following charts make some sense in this light.

 Here's where the back of the uptrend was broken, don't forget my first post of the week on what reversals look like (we'll come back to that). At the red arrow, the back of the trend was broken.

 Looking at the new downtrend, we've had 3 of 4 days trending lower, only today qualifies as a nose day, but its low is not above the yellow signal candle's highs, so the downtrend s intact. The hypothetical candle I drew in (yellow) would break the downtrend as its low would be higher then our current signal candle's high.

 Here the 60 min 3C chart is confirming the downtrend, from upside confirmation, to negative divergence at the top to downside confirmation now at the second red arrow.

 The 30 min chart is also confirming the downtrend with the lows of today being at a relative negative divergence at the second red arrow (meaning they-price- are higher then the start of the arrow , yet 3C is at the same level-thus a relative negative divergence.

 The 15 min chart shows the reversal (the first white arrow should be red, my bad), there was a positive divergence yesterday at the EOD lows that sent the market higher today, but there's nothing n this chart beyond confirmation, no bullish positive divergences. It's almost as if they are keeping the SPY in the $132-ish range.

 The 10 min chart shows confirmation of the downtrend at the green arrow and a negative divergence at today's highs. Currently the 3C position in the red box is at a slight leading negative divergence. In any case, there's no signs here of a big move up or even a big move down, once again it looks like the market is being pinned.

 The 5 min chart  shows today's negative divergence at the price highs of the day, there's a slight relative positive divergence, suggesting they don't want the market to drop too far, t all looks very controlled.

And the 1 min chart is just showing the price moves, with some positive and negative divergences, but once again nothing extremely strong pointing to a directional move of any significance. This all fits well with the options chain I posted earlier.

As for Monday's post of what reversals look like, you may want to review it here

Thus far the reversal is what I would expect to see.

Here's the reversal in white with only some slight volatility/noise in the red square, actually quite a bit less then some of the examples of major reversals  showed in Monday's post linked above.

Op-Ex Friday

Well we're looking at the options chain again to see where Wall Street plans to pin the SPY. Of course the data can change as we have a couple of days, but here's how it's shaping up and Puts seems to be they key.


CALLS
Looking at the calls, a close around $132 on Friday seems like it will cause the most pain. Remember that even if you own $132 Calls, there's still a $1.11 premium on them, so a close just above $132 doesn't do you much good.


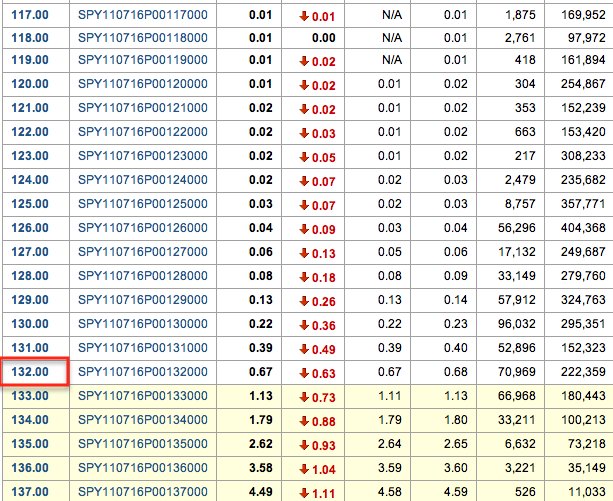
PUTS
There's a lot of open interest in the PUTS, albeit the premium is low in the $120's. It looks like a close around $132-ish ($132.50?) here would also inflict maximum pain when adjusted for the premium. So as of now, I'm looking for a pin somewhere in the $132 range on the SPY. I'll check the chain and see if there has been any significant movement over the next couple of days, but that' where we are right now.

If any of our options traders want to shoot me an email with your thoughts, I'd be glad to hear them.

GLD Update

Right now, I'm happy with my warning or rather 3C's warning on the move up in gold.
 This is a 1 min chart with a pretty nasty decline on volume the last 10 mins or so n GLD. GLD is still in the green on the day, but this is not how it should be acting when looking at price and volume alone.

 The 5 min 3C chart isn't showing any hints that this current leg starting to move down is going to let up any time soon.

VXX trade Follow Up

Earlier today I noticed VXX setting up for at least an intraday trade at $21.75

So far the trade is up 2.5% since noon time, unless you used options, then you'd have a significantly larger profit.

Taking a closer look, this may be a trade that has some longer term aspects then just intraday.
 This 30 min chart shows accumulation on a 4 day base. The run thus far has only been about 2 days, it would seem to me the base should be able to support a longer move then 2 days. You mght want to take a closer look at VXX.

This is the chart that prompted me to put out the idea around noon time. So far so good as the SPY drops and volatility increases.

USO Update

 Based on the 30-60 min USO 3C charts, I still have a bullish bias toward USO, but it is bumping up against some resistance and with the dollar possibly gaining a foothold, a correction would not be unlikely.

 USO 10 mn 3C is negatively divergent

 As is the 5 min

 As s the 1 min with a leading negative bias.

 Based on where some of the gaps are and the moving average's historical correlation, I'm guessing a pullback could fall around the red zone.

Also note that the Bollinger Bands have seen an extremely tight period of volatility which is indicative of a directional move coming, from what I see above, I'm guessing it will be a correction down.

GLD Update

 I think I'm going to stick with my warning on GLD for the time being...

 GLD 3C 2 min (a new timeframe for us using StockFinder)

 GLD 5 min still negatve

 The 15 min chart is starting to fall apart here.

 As I mentioned earlier, for whatever reason, the dollar seems to be looking for its footing. It has stabilized since the last update. It may continue to base and form a rectangular trading range.

 The 10 min $USD chart (via UUP as a proxy) just showed some rather incredible upside very quickly.

As has the 15 min. chart.