Wednesday, June 20, 2012

USO Update

I was watching USO for a possible trade on the EIA report today, it looks like it may be setting up for a long trade.

This recent descending wedge is a pattern we've been seeing a lot lately, there have been so good head fake moves off these. Today we saw the downside move that technical traders expect from the price pattern, so the question is, is it setting up  bear trap?


 I know the EIA report showed a build, but the move today seemed excessive, even vs the $USD  it seemed excessive, that is unless someone wanted to manipulate the pattern to set a bear trap.

If the EIA report was leaked, this negative divergence on the 5 min chart makes sense, if it wasn't, the probability of a bear trap being set goes up. Either way, USO was working on a positive divergence all afternoon as it was near it's lows on the day. This is one we need to keep an eye on for a quick trade; I think the last set up similar to this in GLD yielded about 200% in a day or two on some call options.

Risk Asset Update

The Risk Asset layout is looking better and better, should it hold up in to a pullback, we'll have a great positive divergence.

 High yield credit keeps improving this week, making a new high today

 HY credit hasn't quite caught up, but if it holds and the market pulls back, they should be in line.

 Yields have moved in to line and are looking very good.

 As is the $AUD

 And the Euro

Finally High Yield Corp. Credit is looking great having made a new high today.

Looking at the risk asset indications alone, it seems hard to believe we will see a pullback, but that's what 3C is showing. As mentioned above, a pullback in the SPX with these indicators just holding where they are now roughly, will present a positive divergence in the layout; the last time we had a positive divergence in the layout was at the SPX lows and market bear trap.

ES Update and Example

As you can see, ES has seen some price gains in to the close, but the divergences on the chart clearly favor the negative side (pullback), I view this movement in Es as noise and not worth risking money on trading such a small positive divergence when a much larger negative is in place. I do think using price strength to enter a short trade (remember it is for a pullback move) is worthwhile-in essence using price strength to let the trade come to you.

Charts-

I've closed several speculative Calls at a profit this week, FB & AAPL among them. Because my primary positions are short and we've been expecting a move higher since mid-May, rather than close the short positions which we entered at excellent prices (as of now, even with the move up, every short position is at a gain), I made the decision some time back to keep the core shorts rather than try to trade around them as I would normally do. I believe we've entered a period in the market in which there are too many events that the market or smart money cannot discount; for instance the outcome of the Greek elections, the negative reaction to the Spanish banking bailout, the unsustainable yields in Italy that may send them looking for a bailout, German politics which may hold up ratification of the ESM bailout mechanism, doubts about whether the ESM can possibly be effective if Spain and Italy break at the same time, etc.

We have entered, "Black Swan Season" and rather than trying to get too fancy and try to trade around the market (I have been burnt before thinking I could trade around the market when we were in similar periods in the US circa 2008), I decided to hedge the short positions with smaller positions in leveraged longs, ETFs & options. 

The thinking goes like this: The short positions were entered at excellent levels, thus they are all still in the green (BIDU and CAT are up nearly +20% with no leverage at all). My big picture analysis suggests we would and will continue to see higher prices in the market before the next significant leg down. If all goes as planned, not only will the short positions be hedged against upside risk, but the leveraged longs should also make money (out of 4 equity long positions in leveraged long ETFs, 3 of 4 are at a profit:  1%, 8% and 13+% and the only loser is down -0.23%). In the equity model portfolio there are 10 long and short positions with only the 1 loser of -0.23%. I have good short positioning if a black swan event occurs, the hedge longs should make money and in the end, I should be able to add to core short positions at better prices and significantly less position risk. I usually don't like to hedge, but events are spinning out of control so rapidly in Europe that maintaining those core shorts is a priority.

  I have mentioned several times this week that it appears we are set for a pullback, even though both the Euro and the SPX are at levels in which additional gains should cause more shorts to be squeezed, the market never makes anything easy, thus we see a lot of noisy moves to shake out both bulls and bears.

As of just before the close, it appeared that we may see some upside volatility, but the only real theme with an edge in near term trade is the pullback, whether you play the pullback on the short side or use the pullback to enter long positions for continued upside gains.

 DIA 3 min has a couple of positive intraday divergences so there's a possibility for some more upside (I mentioned this in the GLD trade post).


 The real edge though can be seen on a 15 min DIA chart,this divergence is large enough for me to take profits on longs and loo at the possibility of entering a few short term short positions. However I didn't close all long positions as I want to maintain that hedge, but there's definitely a bias to the downside in current positioning. Again let me repeat that I expect a pullback, the 30/60 min charts still suggest more upside and it could be quite impressive.

 IWM 1 min has an intraday positive divergence, but unless I was a day trader watching this every minute, there's not enough of an edge here to make a long trade worthwhile, especially considering it will probably very volatile as we saw intraday today.

 IWM 3 min negative divergence suggests a pullback as has been mentioned Monday/Tuesday as well.

 The IWM 5 min is sharp enough to consider a trade on this divergence, I chose GLD thus far as the signals there are quite strong.

 QQQ 1 min intraday shows a positive divergence at the 3:15 lows, some more upside is certainly possible here, but in my view I would only use that possible upside to set up better positioning on some short term pullback short positions.

 QQQ 5 min is positive at the F_O_M_C lows and largely in line since.

 However the signal that has some edge is found on the 15 min chart, again, while there may be upside volatility intraday, this is a signal I consider to be worthwhile.

 SPY 1 min with a small relative positive at the afternoon lows.

 SPY 2 min shows the stronger signal suggests a pullback.

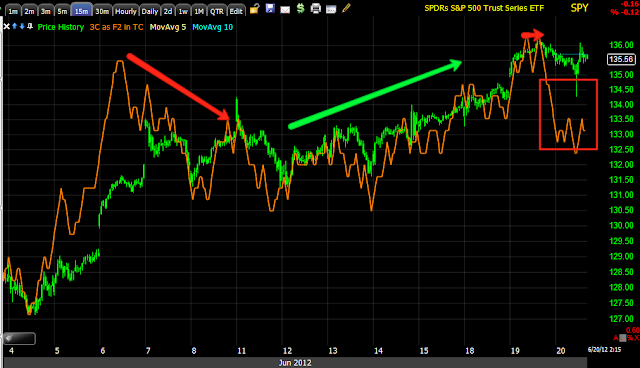
SPY 15 min again is the only short term signal worth trading in my opinion.

To be clear, while I feel the signal is worthwhile, this is for a pullback move only. The more important trade is re-establishing some of the longs like FB/AAPL that were closed because of the probability of a pullback. If we can get a pullback with positive divergences, we will have a trade with high probabilities, low risk and a trade that has come to us rather than a trade we are chasing.

Next up is the Risk Asset Layout Update.

Closing Indications

It looks like some short term volatility, maybe some upside, but the pullback looks set

Starting GLD Put Position

I'd prefer to watch GLD carefully for higher prices intraday to enter a position, but I don't have the time for that so I'll be starting a small position with August  $160 Puts. This is a trade looking to capitalize on the 60 min negative divergence in GLD.

GLD Update and possible explanation

As you may recall from yesterday's update, GLD has had a very negative divergence out to the 60 min chart suggesting some decent downside in the PM. However we also have a longer term daily chart which had been negative until recently, now showing longer term trend positive divergences. There may be a reason why...

This link to the FDIC government news explains why gold may be looking a lot better on the longer term charts/longer term trend. As a member summarized the article,

"It has been proposed by the Basil III agreement that Gold should be
accepted as a tier 1 asset, meaning that it would be as good as cash,
treasury, cash equivelants and A rated soverign debt.  Currently gold
is considered a tier 3 asset which mean it is on allowed a 50% asset
value.  It appears that either the FDIC is accepting this Basil III
recomendation of seriously considering it."

The basic charts of importance in GLD right now...
 The 60 min chart which went positive very quickly on May 30th, then saw the biggest 1 day move up in years, that move saw distribution in to the price strength and there's a significant negative divergence suggesting Gold will see downside from here. Judging by the daily chart, I would expect to se that downside accumulated and if that happens, GLD may be a worthwhile longer term long position.

Near term for those that are nimble, GLD may be worth a short as a short or using puts for a pullback move.

 Intraday the move higher is seeing a negative divergence as of 2 p.m. which is now leading negative.

This is the daily chart which has changed character quite dramatically, going from a very negative divergence at the 2011 highs to a more recent series of positive divergences at support around $148. It would be likely that a downside move would break through that support as it is becoming obvious, if there's accumulation in to that move, that would also offer a very nice long position entry in GLD.

AAPL Update

I still like AAPL for higher prices, like the market in general, I expect a pullback. As you know yesterday and today I closed all AAPL calls at a profit, I'll be looking for an opportunity to add new calls on a pullback. As for the primary trend, I continue to maintain a primary trend short position which is also at a gain.

 AAPL has formed a bullish ascending triangle right above major resistance, the price pattern is not technically correct as this is a continuation / consolidation pattern and there isn't a preceding uptrend in place before the price pattern formed. There have been some recent forays above resistance of the pattern, the candlestick pattern of the last 2 days also suggests a pullback. A deep head fake pullback would be below the triangle's support around $550, that would bring shorts back in to AAPL, if that were to happen, we'd be looking for 3C confirmation of a bear trap and that may make for an excellent long position for a sub-intermediate uptrend. If we can get a short squeeze move and higher prices, we'll be looking for 3C confirmation of distribution in to that move. In that case I would likely add some to the current equity short in place for the Primary trend. So there are two potential trades, a shorter term long which would be a set up in which the trade comes to us and a longer term short for the primary trend, again, this us a trade set up that lets the trade come to us which in either case, gives us much better price positioning, higher probabilities and significantly lower risk. Patience and the fact you don't always have to be in the market are two of your greatest advantages over Wall Street.


 The 5 min AAPL chart suggests a pullback as AAPL has gone negative in to a resistance area twice now. The fact this is a 5 min chart suggests this is more apt to be a pullback rather than a resumption of the primary downtrend or next primary leg lower.

 The 60 min chart in AAPL shows strong distribution at the March top and then a strong accumulation phase (not as strong as the distribution) which has sent AAPL higher off its lows. It has been my opinion that any accumulation in AAPL is already done and positions are already in place. I do not expect to see any significant longer term accumulation events at this time.

The Trend Channel shows where AAPL's uptrend from stopped out, a move above the red trendline to the right (top trendline) would almost certainly create a strong short squeeze in AAPL and a powerful sub-intermediate move higher. Right now I'm looking at the $560 area as a possible pullback target, but I plan on letting the market tell me.

UNG Update

I'm getting a lot of emails about UNG status updates so I'll just post them here. As many of you know, UNG is one of the few LONG TERM longs I like, but I view this as a long term trade.

As for my near term view, much like the market I expect a pullback, I'll be watching for accumulation in to that pullback to give us an idea of when the next swing move up may start.


 UNG daily chart shows 2 Harami Candlestick reversals (Japanese call it "baby in mother) in the west we cal it an inside day)-there is no price target with a Harami reversal, just that the current trend is likely to see a change (usually near term), both marked with yellow arrows, the red arrow appears to be confirmation of this pullback signal.

 The longer term view -30 min chart ) is quite positive with a leading positive divergence

 The 5 min chart is also in leading positive position

 a close up of the 5 min chart shows a negative divergence, this suggests the pullback I mentioned.

 The 2 min chart also shows the negative divergence-keep in mind these are short term timeframes and I believe they represent a simple pullback.

The 1 min chart has stayed relatively positive, this suggests the lower prices are under accumulation. I don't think the pullback is done, but it appears to be healthy thus far

Full SPY Update-Road Map

I think it's important to give you the perspective from intraday to short term trends to the sub-intermediate to the primary trend.

 Intraday the 3C was moving down with the SPY, the Merkel news as well as the F_E_D saw a very small relative positive divergence, right now the SPY is trading in line, or price/trend confirmation.

 The 2 min chart as I have mentioned all this week shows a negative divergence (for the pullback I have expected) and we see trend confirmation at the green arrow, there's no positive divergence this afternoon before the bump higher and that move is in a relative negative divergence, suggesting to me it is intraday noise and a pullback is still the most likely path for the short term trend (days).

 The 5 min chart has been in confirmation of the move up since the SPX hit its lows on that bear trap when the SPX closed below its 200 day moving average combined with a head fake move out of the bear flag. Right now we have a negative divergence in the SPY, slightly leading, all in all it still looks like a pullback.

 A closer view of the 5 min chart showing a small leading negative divergence as the divergences from the 1 - 2 min chart have bled through . Intraday the SPY is in a leading negative position.

 The 15 min chart shows a small leading neg. divergence, we have seen them before in this move up, it still doesn't strike me as anything more than a pullback.

 15 min longer view shows the SPY in a confirmed leading positive divergence and has been positive since the bear flag formed in May.

 The 30 min chart (sub-intermediate trend) is also leading positive, suggesting we have quite a bit more upside before the next leg lower in the primary trend.

 The 60 min chart shows the same-leading positive.

The daily chart (intermediate to primary trend ) shows the negative divergence at the top, the leading negative move and at the yellow arrow the 60 min leading positive divergence is moving this chart.

All in all, I expect a short term (days) pullback, followed by a significant move higher, finally the primary trend resumes to make a new low.

ES Update

I suspect we'll see even more intraday volatility at 2 p.m. and then 2:15, thus far this is what ES looks like

ES has a relative negative divergence, in yellow there was no positive divergence so this appears to be either part of a knee-jerk reaction, reaction to the Merkel news or a bit of both.


Closing AAPL $550 Calls

I don't trust this intraday move to hold, I still expect a pullback in the market so I'm going to use this strength to close the AAPL July $550 calls


There's probably an intraday opportunity to fade this move in the market, but first I'd like to see a nice signal.

F_O_M_C Statement

The F_O_M_C policy statement seemed kind of bland, no QE, but rather an extension of operation twist through 2012, specifically, purchase treasuries with a duration of 6-30 years and sell treasuries of 3 year less.

A couple of things stand out here, first the reaction in the long dated end of treasuries and yesterday's analysis of TLT (long dated Treasury ETF)

TLT sees a pop on the policy statement.

These are charts and their commentary from yesterday's analysis of TLT linked above...
  As mentioned, there seems to be accumulation here which is odd considering it usually trades opposite to the market.


The daily chart is even more positive, this is why I suspect something positive will be announced tomorrow in the Treasury space.


I can't say these charts reflected a leak or inside knowledge of the F_O_M_C policy before hand because the extension of Twist isn't such a wild idea, however it seems clear that smart money was expecting policy action that would benefit long dated treasuries as these charts showing accumulation are from yesterday as is the commentary below them.


Also specifically from yesterday's analysis...


"I shouldn't be speculating like this, but after looking at the Risk Asset close and some other indications, my best guess is that the F_O_M_C will disappoint the market with a lack of QE, in fact I don't even think it will be mentioned (as in the Jackson Hole Speech of 2010) beyond some possibly more dovish than usual, "We stand ready with an array of policy tools to step in should market conditions warrant intervention" or something along those lines. This may bring the market pullback I've been expecting and the Euro may be the catalyst for the short squeeze, meanwhile GLD I expect to pullback, but most probably be accumulated for QE possibly later this year. By the looks of treasuries, I would not be surprised if some policy adjustment was made that may be favorable for treasuries."

As you know that was a gut feeling based on the charts, but thus far (we have to discount the knee jerk reaction), it seems to be right in line with the policy statement.

As for the market, we are at about unchanged on the initial knee jerk reaction, however we'd be up huge right now if QE3 were announced, this fits pretty much with yesterday's "SPY Full Update"

" The 3 min chart is negative after being in confirmation, but it's really not that bad, again, it looks more like the kind of divergence seen at a pullback."


"I suspect a pullback as I have maintained for the last 2 days, from there it looks like the market has plenty of juice left."


As for GLD, this is one asset class that would have gone through the roof on an announcement of QE as it did the last two times. From yesterday's update...


"I would think if smart money knew what the F_O_M_C was going to do (and we have seen instances in the past in which it looked very much like they have known in advance-not often, but there have been several very odd instances) it would be reflected in gold. "IF" the F_O_M_C creates some sort of QE3 program, historically gold has been one of the biggest beneficiaries."


As you may recall, we weren't seeing that kind of action in GLD that would have suggested a QE3 announcement, specifically...


" The 30 min chart shows the breakout to the upside-the exact opposite of what technical analysis teaches and 3C showing distribution in to that big move up and a recent negative divergence as well. To me, it looks like GLD is coming down."


"Everything looks like GLD will fall, which would suggest, "If smart money knew what the policy statement would be, it doesn't look good for QE and doesn't look good for gold". There's only 1 problem...

The daily chart..."


"This shows GLD negative in to the highs that formed the left side of the triangle, there's a positive at support in December, then GLD is run back down and now there's a positive at the support area from May/June.

If I had to guess, I would say there's no QE and GLD comes down, however perhaps there's QE later in the year.

I would think for GLD to come down, the F_E_D would not hint at QE coming. That's just my initial thoughts."


Thus far all of our analysis seems to be right on track, we may be seeing the typical knee-jerk reaction, however everything in the policy statement seems to be consistent with the themes outlined above.


I think it is more likely that this statement (another 180 reversal ) from Merkel is what the market is reacting to (this was also part of our analysis-"The Euro short squeeze would be what gets the market running higher")


MERKEL SAYS BOND PURCHASING BY BAILOUT FUND A POSSIBILITY


Now we have 2 more events at 2 pm (outlook) and 2:15 (questions).


I'm going to take a look around and see if there are some opportunities in what appears to be the "initial knee jerk reaction" that is typically reversed.