Friday, August 5, 2011

MC Summation

Here's the McClellan Summation Index as of yesterday's close. Note that spikes down result in rallies, typically the rally starts before the Index turns up. We have the largest spike down for 2011 and much of 2010. I'll check today's data after the close.

SPY Shakeout

 Snce this triangle was so obvious andwhat traders would do is so obvious being a bullish continuation pattern, I believe we saw a weak hand shakeout.

The short term 3 harts had been looking like that was the way it would go down. This is why I say Wall Street uses everything you have learned about technical analysis against you.

The TICK chart on the recent move back up looks pretty strong.
Note the downtrend into the pullback in the market and now that has been broken, we are seeing 1000 prints in TICK

CSE Trade Management

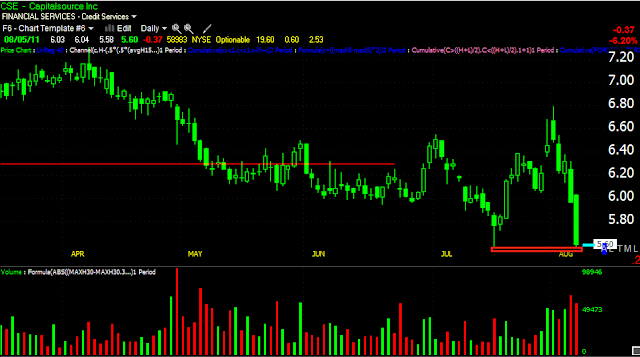
CSE is a trade idea from 7/20, there was also a follow up on 7/21 looking for an entry (short) at $6.40-$6.50, we got that entry on 7/29. which puts the trade at about a 14% gain.

 Our 7/29 entry-patience is your edge over Wall Street.

 Since we have a decent swing gain and we are at a support level on a small RSI positive divergence, it makes sense to trail a stop here. Even though this s the second break of the top, and a more likely trending trade, some of you are swing trading, thus a trailing stop is a good idea.

 Here's a stop that has captured the recent momentum and will allow you to hang onto the bulk of your gains (50 bar m.a. on a 5 min chart).

The longer term trend can be defined with a 50-bar m.a. on a 30 min chart. Since the plunge has been so rapid, the daily trend channel hasn't caught up yet, but should be used for trend traders as soon as possible.

Should there be a pullback to the upside, my first target would be the $6.20 area.

TLT Follow Up

One of the things I've been watching carefully is the action in the safe haven trades, TLT, a 20+ year treasury ETF has been a safe haven trade during the decline so it has been on my watch list.

What I look for is significant changes in character.

 Thus far TLT's daily action, should it hold through the close sets up a Harami candlestick reversal and a nearly textbook one with higher prices being rejected on heavy, churning-like volume.

 This is the first time since the move lower in the markets that TLT has crossed below it's 15 min 50 bar m.a. Also note the RSI negative divergence. I suspect there will be some volatility around the trend line, crossing above and below, but it looks like the damage is serious.

 The 3C 15 min chart, the most common reversal timeframe, put in a negative divergence right as TLT was making the highs of the day, I suspect that was accompanied by churning in volume.

Here's the 1 min short term chart suggesting TLT will move toward the average, as I mentioned, there's often volatility around a break of an important price level.

Trade Idea KCG (long)

 KCG put in a positive RSI divergence at the lows, the price pattern is a bull flag and the volume today is excellent.

ADX signaled the end of the downtrend and is now in position to start a new trend signal. The Trend Channel has held the entire pullback, excellent action . The implied first target is near $13.

My crossover screen also went long, I'd look for the first pullback on a move up to fall t the 10-dy average (yellow), at that point it may be an add-to.

Trade Idea SIGM (long)

 SIGM has also shown excellent relative strength, there was an RSI positive divergence at the lows and it's crossing the 50 m.a.

 My moving average crossover screen that I use to prevent false signals went long on all 3 components.

Finally my Trend Channel held the downtrend and has held the entire move up thus far, even in a flat market. ADX signaled the end of the downtrend when it crossed down from above 40 and it is now at a level consistent with the start of a new trend. I like the trade here with the stop channel, but ideally I'd like to give the initial stop a little more room n case of a head fake.

The market looks like it's preparing for another leg higher

Trade Idea PMT (long)

 PMT is another that has shown excellent relative strength, it's broken through the daily 50-m.a. and had a positive RSI divergence at the lows.

The daly 3C chart which had been in confirmation of the downtrend has shown a positive divergence since early July, this would be a significant base. I like the trade here or on any pullback.

Trade Idea EEFT (long)

Just browsing charts and I like the price pattern of this one, it looks like it wants to breakout.
It has shown excellent relative strength and may be ready to crack resistance. There's also a nice base put in.

SPY Does It AGAIN!

Earlier I posted this about the strongest 15 min candle in all of my intraday history going back to May 4th, well the SPY did it again.

 A second record 15 min candle and stronger then the first.

A net move of 1.61 points and 1.36% vs the last record move earlier today of 1.40 points and a 1.19% gain! This wreaks of some short covering on that kind of momentum.

VIX reversal signal?

VIX (green) vs the SPY (white)

Accumulation of the low

 Here's the low I mentioned early as possible support, note the positive divergences at the low-15 min DIA

 15 min IWM

 5 min QQQ

10 min SPY

All of the averages are now green on the day, with the Dow-30 up 1.36%

Another interesting move...

The 50-bar 5 min moving average has acted as resistance, it's a popular average for day and short term swing traders. Price just broke above the average for the first time since we had that bullish close on Wednesday -July 8th

Interesting move off support mentioned previously

My intraday data only goes back to 5/4 on a 15 min chart. This move off the support I mentioned is the biggest 15 min move for all of the intraday history I have, so the 15 min move off support s likely the biggest move in a long time, predating 5/4.

 Here's the move off the 200- bar weekly average on a 15 min time frame.

A 1.40 point change and 1.19% change in 15 minutes.

Possible Support

The S&P is now testing its 200 bar weekly moving average and looks initially to be finding some support here.

BPT Trade Management

The original BPT short trade from July 15th, was a swing trade idea, where our profit target is 10-15%

 Here's the trade date, our stop was $117 so that was never hit. The trade is coming up on a 10% gain now.

 For a tight stop, the 50-bar on a 10 min chart should work well.

BPT is a false breakout from a large triangle, that was part of the premise of the trade. However, I expect some temporary support around these level, thus I would use a trailing stop.

GLD/DZZ Follow Up (long)

Yesterday I mentioned DZZ as a long trade, it may be a good time to get your toes wet in this trade. Risk looks low, probabilities look high.

 GLD has also been a flight to safety trade during the market decline, however the last 2 days, today may be the third, GLD has opened higher only to give back the gains, despite the market.

 Here's this morning's intraday action thus far.

 Today's 3C chart...

 And the underlying problems in the daily chart of GLD, which I have been warning about.

 In contrast, DZZ (Gold Double Short ETN) has shown underlying strength for some time (60 min)

 Here's the 30 min chart

And a closer look at today's 30 min chart with a positive divergence on the gap down lows. Even if you enter the trade here with a stop below yesterday morning's lows, the risk amounts to about 3% on the trade, that' a pretty decent R:R ratio for a trade. Even if you only dip your toes in the water on a speculative position, DZZ is one to consider here.

Browsing the market

I'm taking a look around at some of the indications in the market.

First yesterday I posted this about the dollar showing signs of a decline

The dollar has dropped today.

Treasuries have been one of the biggest safe haven trades during this decline...
TLT vs the SPY (red)-you can see the obvious flight to treasuries.

 In addition, this has been the most serious break of the 50 bar average since the decline started, volume s the highest and RSI is negative here.

ADX s also showing signs of a reversal, the trend channel here has held the entire TLT uptrend, the channel has widened this morning from volatility, I'll be watching for the channel to turn down and or be broken.

NFP Data

Non Farm Payrolls Beat

The NFP came in at 114k on consensus of 85k. The unemployment rate dropped to 9.1%.

The market has responded favorably thus far.