Thursday, April 26, 2012

Was Spanish Downgrade Leaked?

In looking at this chart of FXE (Euro ETF), I have to wonder whether the Spanish downgrade was leaked to FX traders and Wall Street. If so, that gives a whole new meaning to the strong 3C negative divergences in the DIA and IWM today.

The 3C trend was largely lateral and listless before today when it went clearly leading negative. With divergences this clear and out of recent character, I don't put much faith in coincidence.


My Crystal Ball is Working!

I may have to give up on the market and join the circus, set up a little booth with a crystal (or glass) ball and charge $5 per sitting.

On a more serious note, this isn't a victory lap, this is my way of pointing out something I think is important. I'm no fan of company specific fundamental data, but I am a huge advocate of understanding the principle, concepts and trends in economic fundamentals. There's a fine line that I try to observe between having too much news on the site which you can get on your own and having the right news that gives you insights in to the market by way of understanding the fundamentals of the world economy.

I don't think we have to be experts and know the 2018 projected debt to GDP for Belgium, but understanding the macro trends can only help you in understanding the market, understanding the extent to which something is important and understanding certain things, for example, the EU banking sector's capital shortfall and how Euro repatriation effects the EUR/USD pair and how that gave the market some breathing room to move to the upside, but still understanding that the catalyst behind the short term strength is rooted in EU bank problems, VERY BIG ones.

So in this post, "Wrap Up For Monday" posted April 24th (Monday-2 days ago), I covered a lot of topics, but this is what I want to point out to justify the usefulness of the news and analysis of that news presented here.

From the post,

"OK, so the market today, in one word, "Europe". Europe was quiet for too long in the beginning of the year. Most of you probably remember me saying a month or so ago, "Europe will once again be the market focus very soon", today was a great example of that. "


"As you might know, the Dutch cabinet resigned en masse today after failing to reduce their budget to the EU mandates. PREDICTION: Get ready for more sovereign downgrades and then the government raiding the offices of S&P, Fitch and the other ratings agencies that downgraded them."


I wasn't being facetious or spewing hyperbole, I meant what I said, thus the capital letters on the word, "PREDICTION".


Even I'm shocked at the timing of this update and the news tonight from the S&P Ratings agency and you know how much I've been talking about Spain lately...


From the S&P:


"NEW YORK (Standard & Poor's) April 26, 2012--Standard & Poor's Ratings Services today said it lowered its long-term sovereign credit rating on the Kingdom of Spain to 'BBB+' from 'A'. At the same time, we lowered the short-term sovereign credit rating to 'A-2' from 'A-1'. The outlook on the long-term rating is negative."


And there you have it. Now watch Spanish (and every other EU sovereign except maybe Germany) yields explode to the upside through 6% and probably 7%. This makes it a whole lot harder for Spain to go to the market to raise finds through debt issuance and when that happens they have no other choice than to try to raise capital the good ole European way, through bailouts. The convergence of Black Swans is staggering. Just today we learned that the ESM bailout mechanism, the one Spain will probably soon try to tap (although it is not nearly big enough even with the EFSF running in tandem to help Spain and deal with the fallout across the EU), may be used to fund EU banks that have huge holes where there should be capital and they have run out of options for raising capital, otherwise the incredibly desperate idea of funding EU banks through their soveirgn debt firewall, the ESM, would have never been proposed.


The plot thickens and the market-well you know what I think about that.

Closing indications for the averages

I don't know if anyone else feels it, but this market is moving fast, an effect of the volatility. I use to have time to check just about everything I wanted to, FX, Risk Assets, news, etc; now important signals can develop in a few minutes while I'm positing an update. The day goes by fast, faster than I can remember. Around 2007 and before, there use to be the summer doldrums when you could look at 100 charts and not be able to find a trade to save your life, what a difference.


The Dow and the Russell 2000 were the clear percentage winners today and it shows in the charts. Wall Street sells/short in to higher prices, the Dow and R2K gave the market that today and the market used it, you'll see in the update.

 DIA 1 min with a strong leading negative divergence, if you need to, comeback and compare the SPY's 1 min chart to the DIA or IWM.

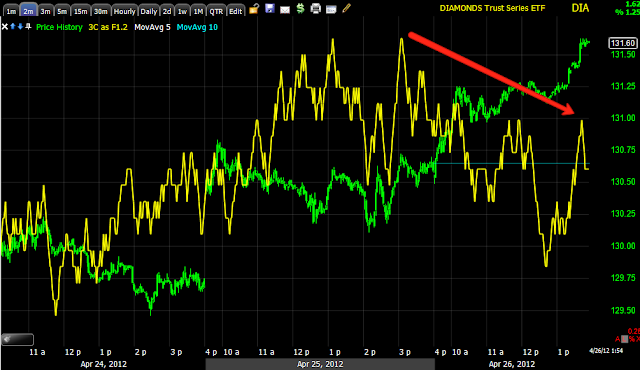
 2 min DIA, another very strong negative divergence

 The 5 min has a relative negative divergence which is pretty deep.

 Although the 15 min chart is moving in line with price, it is at a clear relative negative divergence, usually the next step is the transition to the stronger leading negative divergence.

 A longer term trend of the same chart shows the damage that has occurred from the 3 previous bounces, this leaves the DIA 15 min  in a deep negative divergence.

 The IWM was the other top percentage mover today and the 1 min leading negative divergence is sharp

 That weakness has bled over to the 2 min chart which is also leading negative.

 And the 5 min leading negative.

 The 15 min chart is moving with the IWM and pretty close to confirmation, just slightly lower.

 The QQQ 1 min is leading negative at the end of the day, but compared to the DIA/IWM, it's not as sharp.

 The 5 min is still in line.

 The 15 min is in a positive position, but I suppose that isn't surprising considering how long the tech sector lagged the market.

 The SPY 1 min, again, compare to the DIA or IWM which performed nearly twice as well in percentage terms.

 2 min SPY is leading negative, again nowhere near the DIA/IWM-you can't sell aggressively in to strength if the strength isn't there.

 The SPY 2 min leading negative in to the close. I suspect this may have been some risk off profit taking ahead of the GDP tomorrow.

 The 5 min is slightly leading negative.

 The 15 min appears to be in line...

However when the longer trend is viewed, you can see it is not in line, it is lagging compared to the 17th, like I mentioned, the last 3 bounces did some major damage.

Dont't Forget GDP tomorrow at 8:30

This is another one that will be very difficult to interpret as the QE crowd sees bad eco data as good news. However I would think that the F_E_D knew well in advance of their policy statement what GDP would look like.

Quick market update

There are some signs that the parabolic intraday move is running in to headwinds again, I'll need to look further to figure out what they are.

For the time being, a pullback/consolidation looks probable.
 1 min SPY

2 min SPY leading negative intraday. That is really a parabolic move, even though it is small/intraday.

GDXJ Update

 Nearly a 35% gain in GDXJ


 Having broken out of the consolidation, volume has dropped off, RSI has a slight negative divergence, it just looks likely it will pullback.

 GDX looks a bit better near term than GDXJ in 3C, but GDXJ has clearly been the better choice. Here's  1 min negative divergence, not horrible, but enough to justify the probability of a pullback.

 The 2 min is lagging.

The 60 min still looks great and if I get the pullback I would look at a longer dated expiration considering this longer positive divergence on a 60 min chart.

Closing GDXJ

Here's my rationale, I still like GDXJ for further gains, the position is at a 35% gain, but I feel a pullback could come in to play, even a 1 day pullback could do some damage and I would rather re-enter the trade with a longer expiration.

SPX 1400

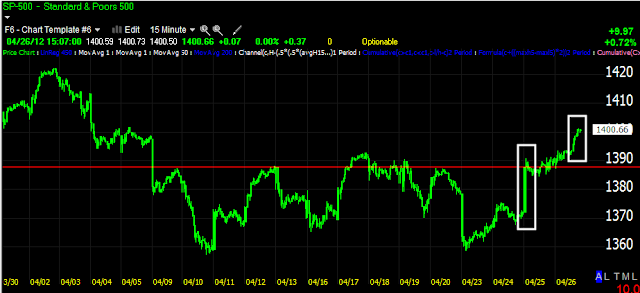
I believe it was yesterday when I was talking about April 10th when the SPX broke the 50-ay moving average. Because of the market's behavior and the predictability of that behavior, before we even had our first sign of a positive divergence , expectations were laid out of a bounce off those lows and what the bounce would do and why. The bottom line  could b paraphrased as, 'There's no point to run a bounce/volatility shakeout if it does not knock shorts out and get longs in the market, setting them up in a bull trap. To do this, serious levels of resistance would need to be taken out". I believe it was yesterday I said I thought the SPX still had enough in the tank to take out $1400 and that's a key level psychologically which helps a lot in achieving the goal of running the volatility shakeout cycle. Add to that increasing volatility and the swings become much bigger.
The SPX has done it, taken out $1400 and thus far although it is starting to get a little scary with the parabolic moves, the underlying conditions are thus far holding fairly well although that may change VERY fast.


 Not only has major resistance been taken out as well as that recent consolidation area in early April, but the centennial mark of $1400 has been hit.

The moves, especially today's even though it is not as large, it has happened very quickly, are getting very parabolic, this is caused by the increased volatility and the market doing what it set out to do, flip-flop emotions-get the shorts very scared and the bulls very excited.


AAPL Update

Patience may pay off if you are looking to initiate short in AAPL or like me, an add to.

Being we expected AAPL to be the final word on the market and being there are still several target zones that we'd like to see, but still haven't quite made it to yet, this update I think is very interesting.

 AAPL hasn't done much today, most likely consolidating yesterday's gains. The market can consolidate in two ways, through a pullback (price) or through time (price patterns like triangles, rectangles, etc). I like the looks of AAPL's volume as far as the short position goes.

 Talk about some intervention on behalf of the market ! A very nice leading positive 1 min.

 When the chart is correctly scaled, you can see the extent of the leading positive move today. One other thing that I started pointing out last night, the accumulation zones. In this case AAPL's first accumulation area as around $565-$572, AAPL dropped further from there to the $550's area. This just goes to show, Wall Street is not taking a loss on their planned cycles, even accumulating at a higher area (because AAPL is so large it takes more time and they will do it in to price weakness), AAPL is significantly higher and in a day.

This is just a point I'm trying to make with regard to some other positions or future positions.


 2 min leading positive

 Just for confirmation I took a look at the 3 min which I rarely use, again leading positive.

The 15 min was the basis of the view that Tech would take over, this formed before AAPL reported. There;s even a bit of a leading component here on the 15 min, so I think the chance to initiate a position or ad to one at higher prices not only in AAPL, but in many of the stocks we are looking at (because of AAPL) looks a lot better than it did earlier today.


Big Blue Still moving

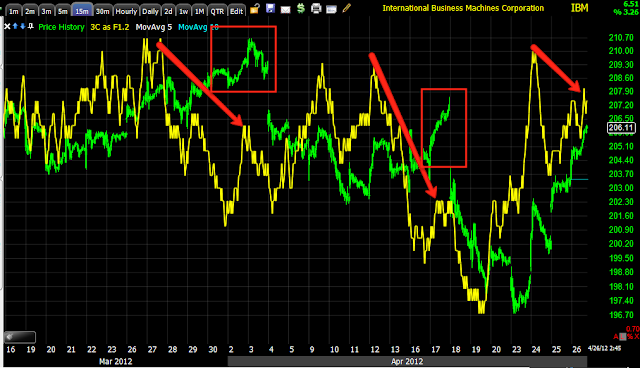
Yesterday I put out some target areas for IBM, so far so good.

 IBM has made it through the major resistance zone at the bottom, it's now taking on the second zone at the higher red trendline, I think it can still make it to the small gap at the yellow area. If IBM's Beta wasn't so low at 0.61, I would consider starting a position here. Given the beta is low I personally would only take the trade at the yellow zone or better as a concession for the low Beta.

I pointed out last night that IBM tends to go negative in to what almost looks like a dog's tail (see the red boxes) and 3C is deteriorating on the 15 min chart, it is not as bad yet as previous divergences sending IBM lower. The price move itself since the 23rd is more volatile and parabolic than the past moves and longer lived, this makes perfect sense as market volatility has increased, so again, for the trade to be worthwhile for me, I'd want the concession of a higher price entry which also gives you a lower risk profile.


Market Update

In a previous update (I believe of Tech and PCLN), I mentioned the holding pattern the market was in with some looking better than others and mentioned that it might take an extra kick from Wall Street to get the market moving again, it looks like that extra kick came. The difficulty now is that the averages are approaching or in resistance areas and the $USD did NOT weaken, in fact the market is moving against a stable $USD, which looks like further evidence that Wall Street did actually chip in the ante needed to break the holding patterns.


 The DIA is a unique case, other than the Russell 2000, the Dow has the strongest price performance, which also means it is in the best position for selling in to strength and it appears that is underway. Here's a fairly bullish ascending triangle-as I said, some consolidations looked better than others. My concern here is this pattern is VERY obvious, the Dollar is not supportive and we are running in to resistance areas. This is not the strong environment that would produce a more stable trend.

 DIA 1 min saw a negative divergence right on the open and has been in a leading negative position since. This is only a 1 min chart, but it seems to be a clear signal that strength is being sold as it should.

 The 2 min chart here is looking pretty negative.

 The 5 min chart, while moving in the same direction, is lagging pretty badly here, this puts this chart in a leading negative position as well. I also don't like this parabolic price movement, again, the underlying conditions in the market are not stable, parabolic price moves are inherently unstable.

 The 15 min chart which is where we should see the final signals is moving in the right direction like the 5 min, but from previous bounces and the distribution in to them, the DIA as well as the rest of the market, started this bounce from a weaker position (in underlying trade) than any of the previous bounces. In fact each bounce has steadily deteriorated the underlying trend in the market.

 The QQQ was the weakest consolidation.

 Unlike the DIA which was already performing well price wise, the Q's were not, they need strength to sell in to, the DIA offers that, the Q's didn't, so it looks like they stepped in with some support as I mentioned earlier they may have to as to keep this bounce alive as it face mounting headwinds. The 2 min chart shows a clear intraday positive divergence before the Q's moved up.

 The 5 min chart is at price trend confirmation, but also at a resistance area from yesterday afternoon.

 Remember that we saw the Q's and Tech would rotate in BEFORE AAPL announced, that was based on this 15 min positive divergence, it is still looking good here and is actually leading compared to the 19th.

 SPY also with a reasonable consolidation

 The positive divergence to get the SPY moving is seen here on the 5 min chart.

 You may recall the SPY's strength for this bounce came on the 23rd when 3C refused to move lower with price, creating a leading positive divergence, so far it remains in line, but is looking very wedgey.

The 15 min is lagging in the SPY, this makes some sense as it was Techs turn to rotate in. It's not at a red line position as of yet, but we have seen these 15 min charts turn in an hour. So far though, the higher targets I had set in last night's post look like they are still on track.

PCLN / Tech Update

PCLN was another mentioned in looking for a good target area

PCLN already put in the positive divergence that has it moving as shown last night.

I'd like to start a position in PCLN, I'm feeling a bit overweighed in Tech right now so if I did, it would have to be a small position.

PCLN is in somewhat of a holding pattern right now, it formed a triangle (consolidation) and is lingering in the area. Now that Europe has closed, do we see the trend of $USD weakness to pull stocks higher? So far the EUR/USD is in the same consolidative holding pattern.

 Here are the target areas I marked last night for PCLN, note the very small bodied daily candle today, indicative of indecision. All of the averages right now are in a holding pattern, some worse than others such as the NDX.

 The 2 min XLK-Tech chart is still in line, I believe there is still the will to take the market higher, does Wall Street have the will though to throw more support in the mix if needed?

 The 3 min chart is showing what we expect to see in to higher prices, non-confirmation which leaves Tech in a leading negative divergence, this is normal and prices "can" still rise in this situation. We are supposed to see selling in to strength. It is when 3C shows an overwhelming negative divergence that we know they are preparing the market to move lower upon their completed mission.

 On the 5 min chart I'm giving what I think is probably the average accumulated price, distribution takes place only after prices are above this average position, we are in the area, but in my opinion not as high as we would normally see. So, more upside in the cards? I think that is the plan.

 PCLN's current move is being fed from this 15 min positive divergence from the 20th to the 24th, however the first signs of a negative divergence are appearing on this chart. A 15 min chart usually does not move very fast, but when it does, there's typically a very quick reversal following that divergence. I don't see this as red-line critical, but it is under way.

 Here's the short term 1 min PCLN, this negative divergence has thus far caused the holding pattern.

 The divergence has bled to the 2 min chart

 and now the 5 min chart. Should these worsen dramatically, the 15 min chart will decay and PCLN will be that much closer to its final upside destination.

 A closer view of the 15 min shows today's non-confirmation of the move higher which came late yesterday.

 Here's the holding pattern as of this capture.  It looks like PCLN is trying to break north of the triangle right now.

 Back to the XLK charts, the 15 min here still is in line, despite the underperformance today. My guess is we have enough support to get through today, who knows what comes out of the EU tomorrow though?

XLK 1 min is in line as well, so for the time being, I'm going to stay patient with PCLN as I already am a bit tech heavy. If price offers a nice price level, which reduces risk and the negative divergences are very strong, I will probably add some PCLN, otherwise because of my tech heavy positioning right now, I'll pass. In other words, only if the trade looks too good to pass up. Your situation may be different as you may not have the same exposure to tech that I have. I still like PCLN, but only at the price levels marked last night and shown above.