Tuesday, July 28, 2015

Daily Wrap

Not much has changed from the last post, Broad Market Update including my opinion so I'm not going to rehash the same charts and the same indications as before.

I did mention Leading Indicators which have had small, short term bounce indications which I believe would be meant for more than just a single day, but I wouldn't go so far as to say too much more than that which is consistent with what we have been seeing and thinking.

Tomorrow is the F_O_M_C policy statement at 2 pm,  there was talk of a July rate hike before there was talk of a September rate hike, the bottom line is we simply don't know.  As usual though what we do know is the F_E_D has been an apologist for the economy and has set up a broad spectrum of arbitrary and ambigouos conditions in which they can hike which makes almost all qualitative guidance worth about zero. They are going to hike when they want to hike which is why the caveats have been built in over the last year. From a fundamental economic standpoint, it would seem a rate hike is the last thing the economy needs, but the F_E_D is boxed in at ZIRP and they are obviously more afraid of being boxed in than what damage a rate hike or series of rate hikes may do to the economy. They have been VERY clear in guidance that it's coming, when is anyone's guess, but it seems "sooner than later" has been the theme from F_E_D speakers.

As ALWAYS, BEWARE THE F_E_D KNEE JERK REACTION... that crazy parabolic move in price (up or down) that is almost always wrong and almost always retraced. That's emotional investing and that's what you really want to be careful with. 

As I said in the last post, Broad Market Update it seems there's still gas in the tank and I don't think Leading Indicators are contradictory to that statement.

 Yesterday our Leading Indicator SPX:RUT Ratio went flat which was positive in the market environment so today's move wasn't surprising. As you can see though, the intraday move was not fully confirmed and a bit on the divergent/weak side which fits with the intraday 3C charts of the averages.

 I noted late last week HYG/High Yield Corporate Credit, one of the first levers of market manipulation they reach for (short term) had already been activated, today you can see it led the SPX (green) and then toward the afternoon/close diverged a little to the downside.

While HYG's divergence that activated the support asset is still intact and has "Gas in the tank", it did see some intraday decay like the rest of the major averages. Distribution and accumulation are not events, they are a process which is why reversals are a process.

 As a reminder to keep the big picture in mind, this is HYG (blue) vs the SPX on a longer 60 min chart. Remember the importance of HY Credit, "HY Credit leads, equities follow".


As for our Pro Sentiment assets, they too were positive in to yesterday and in line with the SPX today, they are not yet diverging to the downside which is what I'd expect as the bounce starts to lose steam.

As for the longer term picture or bigger picture so we don''t get lost in the lines of intraday trade, this is the 60 min chart leading negative in a big way.

Our secondary/confirmation P{ro Sentiment shows the same as it was positive in to Friday and yesterday and in line with the SPX today.

 Yields which have been acting as an effective leading indicator didn't move up like you might expect, but rather were at a divergent area a bit lower. Equities tend to be drawn to yields like a magnet and while I wouldn't call this a screaming, chart popping divergence, it does seem about right compared to every other indication I've seen today of some deterioration/selling in to higher prices, but still gas in the tank for more upside which is why I left the IWM call position open today, which is a position we added a bit to today from its opening Friday, Trade Idea:IWM Calls (SPECULATIVE).

 As for Yields vs the SPX on a larger timeframe encompassing the last bounce cycle, you can see how they led the market to the upside, confirmed and then led the market to the downside.

HY Credit was slightly supportive yesterday which is much more than it has been generally since the SPX's head fake in May in which HY Credit has only went positive once and that was right before the July 10th bounce. This is a very slight divergence at the "W" base from the last 2 days and just slightly out of line/deterioration vs the SPX intraday today.

Really this is the bounce we were looking for. Any counter trend bounce is going to be stronger than you think, in fact some of the strongest bounces and rallies I've ever seen n any market because they have to be convincing and because they have extra fuel via things like short squeezes in which today saw the largest short squeeze in nearly 6 months after 5 days down in the SPX.

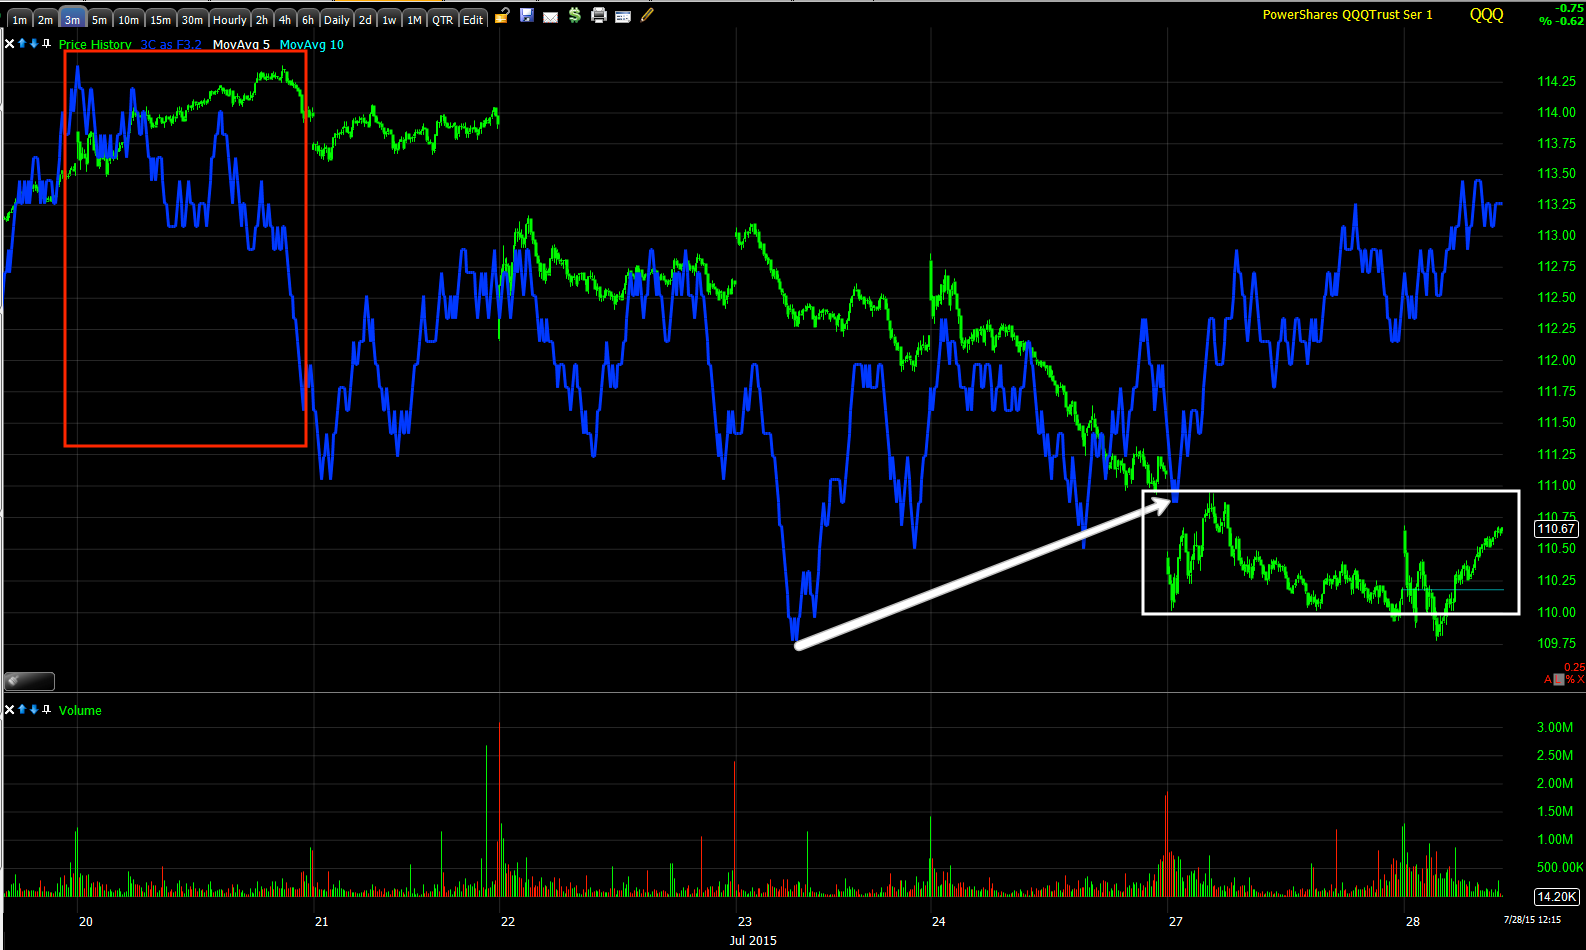
Yesterday's closing candles were near perfect for a signal for today's bounce as was posted intraday yesterday and in the Daily Wrap last night. Today's closing candles are in line with more gas in the tank...
 SPY (which just gives a better candlestick ) with a Morning Star reversal yesterday at last ditch major support at the 200-day moving average and today a decent momentum candle.

 The DIA also with a Morningstar Reversal candle yesterday at last ditch support of a large local , choppy range.

 The NDX also with a Morningstar reversal candle yesterday and above former support/resistance in the area where it needs to be to get retail to chase. You saw from Friday to yesterday how fast their sentiment changes, technical levels just need to be hit which is why they are so predictable that it makes Wall St. predictable in that they are going to hit those levels that make retail traders react.

And the IWM with the same type candle yesterday at last ditch local support and a large hammer today which is pretty much a 2-day reversal candle pair inviting more gains tomorrow.

The one thing that gets me is the concept of 3C charts picking up where they left off the next trading day (cash market) as the averages all closed something like the SPY below...
Although this is a weaker 1 min chart, it's the fastest to respond and as we have seen numerous times, the market tends to pick up the next trading day (even over a 3-day weekend) where this divergence left off which is negative. All of the other averages have the same 1 min charts, that is to say negative, but that doesn't mean a whole;e lot on a day like today in which overnight gains were pretty much retraced at the open and then we moved higher.

However what also gets me, although makes sense in front of an unknown risk event like the F_O_M_C are the VXX charts and the way they behaved today and closed...

 VXX 1 min positive intraday especially in to the afternoon, confirming the negative in SPY 1 min above.

 VXX 2 min looking very similar. honestly from looking at the price pattern alone, I could see about a half day more of reversal process and VXX up/market down so it may work out near perfect with the F_O_M_C tomorrow.

As for the 5 min chart, this is a MUCH bigger leading positive divergence that hasn't fired to the upside yet, which is why I chose to leave my UVXY longs open even though we expected them to take some head today as posted yesterday, VXX /UVXY Update

Interestingly the SPY (and other averages intraday 3C charts look exactly like Index futures , except Index futures NEVER went positive in to the 5 min timeframes as noted earlier today).

 ES 1 min leading negative in to the overnight session.

NQ/NDX futures the same (1 min).

And TF/Russell 200 futures 

I don't see the same divergences in $USD and Yen futures that we did coming in to the overnight session in which we expected them to lead Index futures to the upside, they're just not there, but that's not strange ass the divergences suggesting a USD/JPY boost were all shorter term anyway. I'm just trying to figure out what the support is for the averages while they still have some "Gas in the tank" charts.

Furthermore it's not even like the Index futures put in the typical 5 min positive divergence even for a short term bounce so there's nothing there more than confirmation at BEST! At worst, well.. our bigger picture expectations of the market slicing through support (SPX down through its 200-day) and market sentiment taking a true and definitive turn for the much, much worse. Well, I'll let the market worry about how it will get through the overnight session and stick to the objective evidence which is we expected a bounce, we have a bounce, there's still room for more upside, but it's being sold in to fairly heavily so I don't expect it to last too much longer.

Other than trying to go in to a trance and force the future, that's what I have for you based on objective evidence. Of course the F_O_M_C days can always be a bit volatile so maybe that with some more short squeeze can pull it off, but a short squeeze is not at all the same thing as market support or institutional sponsorship.

The big picture reminds the same despite the short term noise...

SPX daily chart with the 200-day moving average...

Have a great night.

And by the way, it looks like we have the email server situation sorted out for the new site, so I may ask you to bare with me for 1 more test day with duplicate emails just to make sure everything is running fine before we make the transition, I'll let you know in advance.


Broad Market Update

After having gone through a lot of charts, I think there are possibilities that could be reflective of leaks, but this is just pure conjecture, perhaps coincidental timing, perhaps timing that's not coincidental and is also not reflective of anything more than what we expected Friday in to early this week and yesterday.

For example, you can find the expectations from both in one place, last night's Daily Wrap, in fact the first paragraph...

"Friday's The Week Ahead forecast started with this paragraph:

"There are numerous smaller indications that make me think we either open higher early next week or we try to put in more of a base for a bounce, but I mean bounce in the most nearly meaningless way, nothing I would trade (other than a speculative position) and nothing that would make me think that our course is going to be interrupted by anything more than some short term noise if that."

Today looked a lot like that "trying to put in more of a bounce for an early week bounce",however it's important to take the forecast above for what it is. This is the 5th consecutive red close for the SPX, with the 200-day expected to act as a brief speed bump and after that, everything changes. 

It appears the retail crowd who was so bullish on Friday with the "Buy the Dip" motto have changed their mind today which is perfect for the Week Ahead (early option of the week) forecast above."


The "Speed Bump" analogy was from yesterday's, MARKET UPDATE:

Earlier this morning I mentioned the support areas we are right at or close to as well as the SPX-200 day moving average. I expect we will slice through it like a hot-knife through butter, but very short term (and I don't mean short term like the July 10th bounce, but as in a day or so) the 200-day could easily act like a momentary speed bump.

So while there "could" be something more to all of this, we have no way of knowing with any kind of objectivity,  but what we do know is exactly what we expected as of Friday's "Week Ahead forecast" and from everything we saw yesterday, today is right on track.

It looks to me like there's some more gas in the tank, although it is strange that Index futures really bare no resemblance to the market at all beyond the FX forecasts of USD/JPY bouncing and lifting the market which happened overnight, but at this time, I don't see any divergences in FX futures that would suggest there's more where that came from. The divergences were there, they fired overnight and did their job, but I don't expect more support from them based on the charts or objective evidence.

 USD/JPY in candlesticks vs ES/SPX futures (purple). The Carry pair lifted the market on this 3 min chart, and now the two have more or less reverted to the mean. As I said, I don't see the same kind of $USD and Yen futures signals that led to the forecast that USD/JPY would act as an engine for Index futures/the market and I think you know my opinion on the longer term trajectory of the $USD and USD/JPY.


 As for the SPY and the 200-day as a speed bump, this is the daily chart, it looks like it did exactly as we expected in the commentary from yesterday linked above.

Intraday after 5-days of decline, a counter trend bounce is not at all uncommon and you can see the little "W" base that I was expecting early this week to form as of Friday's Week Ahead forecast.

As for the QQQ daily chart, I mentioned it broke below the Ascending Triangle yesterday which is price confirmation of what we knew before the bounce started, that it would be a head fake or failed breakout.

Intraday the QQQ / market would set up the best head fake with a move above what is seen as local resistance as retail is pretty fickle and will chase giving the pros the chance to sell/short in to price strength which is what we have been seeing intraday today.

 I'd call this 5 min SPY chart with a leading positive divergence off the small "W" base the "Gas in the tank". Until this chart starts falling apart, I think the market "can" put in more upside.


 However intraday on the SPY 1 min where any new divergence will start, we can already see they are selling in to price strength.

Lets call this 10 min QQQ the "gas in the tank" with accumulation of today's morning lows on volume.

 Intraday the 1 min chart has shown some confirmation until prices moved up a bit and then we see selling in to higher prices.

The divergence is migrating to the 2 min chart meaning it's picking up some strength.

As it is on the 3 min chart to the far right.

Remember though, the 10 min chart represents the gas in the tank, when that falls apart and goes negative, I don't think we have much upside left.

 IWM 10 min gas in the tank.

 And the intraday selling on the 1 min chart...

migrating or strengthening on the 2 min chart...

As well as the 3 min chart...

And even on the 5 min chart. These will get worse before too much happens on the 109 min chart, but judging from what I see, unless some other support mechanism joins the party, the bounce ending in to the F_O_M_C tomorrow with the typical knee jerk reaction on the announcement (who knows which way?) sounds about right.

I'll bring you Leading Indicators which have been supportive of a small bounce and and anything new in Futures in the Daily Wrap.

2 Year Note Results Goosed the Market

As I said in the last post, I'm going to keep an eye out for distribution in to higher prices. It's obvious this morning's sellers' shares were accumulated by the flying 5-10 min intraday divergences. Remember retail sentiment flipped from Buy the Dip Friday to fear yesterday so whatever they sold and there was some volume on the decline this morning as some of those last ditch support areas were tickled and a nice gap was given up, was picked up on the cheap.

The thing about retail is they love to chase. Going in to tomorrow's F_O_M_C, one might take today's 2 year auction as an indication that some heavy hitters like foreign central banks have an inside line on what the F_E_D is going to do and that the perception may have been that a hike is further off than currently expected by broad consensus.

Did you see the market around 1 pm?

The intraday NYSE TICK shows the market going from getting a bit tired to a parabolic pop higher (see ES below)...

ES 1 min-see the area in white.

The 2 year Treasury auction concluded with the highest indirect bidder take down since June of 2009. Typically these entities are foreign concerns, foreign central banks. In any case, the indirect take down at a 6 year high was 54.37%, but that's not all.

Remember the "Staff leak" from the F_E_D with projections of where the F_E_D Funds rate would be at the end of 2016? It was +1.26%. Remember this was a 2 year Treasury auction today and it came in at a yield of +.69% even though the F_E_D Funds rate is forecast to be nearly double that by the end of 2016 while this issue is still active.

I'm not a bond guru and there are a lot of reasons foreign central banks may want our paper, but from a tinfoil hat perspective, some may have the perception that the takedown was so high at such a low yield because the F_E_D isn't ready for lift-off (Oh, that's the first and last time I say that!) at the September meeting, thus the market reaction at the same time.

As I said, I'm not a bond expert, but there are a lot of reasons foreign central banks/entities might be interested in US paper right now. Or... perhaps the tin foil hat theory holds water.

Broad Market Update

Perhaps the F_O_M_C is an influence in today's market activity, but perhaps its not in the way I initially wondered about. Perhaps this is exactly the bounce we were looking for, it's the right kind of move and at the right time and once you see the charts below, it may have the right confirmation to fulfill the expectations of exactly what we thought it ow;ld be Friday and yesterday.

I'm going to post numerous charts in various timeframes, this morning's decline looks to have been accumulated with some very interesting moves in 10 and 15 min charts intraday.

There are some strange non-confirmation signals in the Index futures and Currency futures at this moment, they can move pretty quickly, but I'd say as of this moment, there's a divergence in the charts between the averages and Index futures and the Carry pairs or at least USD/JPY.

QQQ
 2 min

 3 min

 5 min

 10 min with a sharp intraday move

 10 min with some context from the last bounce/cycle

IWM
 3 min-again this is the move I was thinking may happen yesterday and why I liked the idea of leaving some room in the IWM position to possibly add to if circumstances start looking better.

 5 min with another big leading 3C signal intraday which is somewhat unusual on a chart like this with timeframes 5 min and longer.

 10 min with another sharp 3C move higher today,  it's the volume/head fake.

 And the same at a 15 min chart.

 The IWM trend is provided for some context, (30 min), so while what we have right now is getting more interesting, it's still not something that really even sits at the same table as this later underlying trend.

SPY
 2 min

 3 min

 5 min with the last bounce cycle's stage 3 top.

 SPY 5 min trend within some longer term trend context. It's easy to get lost in the lines with big intraday moves and forget what the long term underlying trend is.

 SPY 15 min which saw most of its movement today . I put a "C" at what looks like a hot term capitulation event which we marked as it happened and "A" where it looks like the early selling today was accumulated.

 SPY 30 min with some context with a positive divergence at the last stage 1 base area before the bounce started, stage 2 mark-up, stage 3 top and 4=decline.

 The custom TICK indicator shows the deeper mini capitulation event to the left and you see improvement through yesterday with an obvious change in character today with price.

The same chart from the start of the last cycle with a larger capitulation/short term selling event at 1, improvement in to stage 1 of the base at 2 and then 3, then the deterioration I kept pointing out at 4 and what looks like another, but much smaller short term mini capitulation event this early yesterday  and late Friday.

Picking up from yesterday's VXX /UVXY Update post...

 UVXY   1 min which is not anything unusual that we didn't know yesterday. The small positive divergence is in line with the 1 min negative divergences in the averages intraday I posted earlier.

 VXX 2 min essentially the same thing we knew yesterday but more in line on the downside than negative leading as you might expect given the market averages above.

 VXX 3 min, again pretty much the same thing from yesterday, no real news here today. I'd say Short term VIX futures are holding up better than I'd expect based on the market averages above. Perhaps they are going for the bounce off yesterday's reversal signals and trying to get it out of the way and over before 2 pm tomorrow when the F_O_M_C comes out...

5 min with a perfectly sensible, reasonable large positive divergence that correlates well to the bigger market picture and what happens after this bounce fails.

As for futures, I'd normally never enter a long for a bounce like this without at least the 5 min charts in line with a supporting positive divergence.

That's what we're missing from anything bigger in the market on the upside and what makes me think there's probably nothing more to this than what we expected yesterday, a bounce and any counter trend bounce has to be impressive. Remember the comment from yesterday's Daily Wrap...

"...the retail crowd have already flipped sentiment from "Buy the Dip" Friday to bearish today. The market seems to do a great job of making the largest number of people WRONG at any given time."

That's exactly what today does and perhaps it does need to get done before the F_O_M_C tomorrow which would be in line with the The Week Ahead forecast from last Friday:

"There are numerous smaller indications that make me think we either open higher early next week or we try to put in more of a base for a bounce, but I mean bounce in the most nearly meaningless way, nothing I would trade (other than a speculative position) and nothing that would make me think that our course is going to be interrupted by anything more than some short term noise if that."

In any case, note the differences in Index futures except intraday, there they are showing distribution in to higher prices just as the earlier negative 1 min divergence I posted.

 ES 1 min positive yesterday in to the afternoon to the far left, up overnight on USD/JPY strength as we expected with a negative divergence coming in to the US cash open and a positive divergence at the a.m. low and bounce that again has no confirmation which looks like the other intraday charts so it looks less like a larger base will be built and more like these higher prices are being sold in to, which is the scenario we've expected since Friday and all yesterday.

 TF 3 min doesn't even have a positive divergence (Russell 2000 futures) so the usually 5 min prerequisite is not even close.

 ES/SPX E-mini futures 5 min perfectly in line with the trend, no divergences whatsoever, certainly no positive that would be the prerequisite (for me) for a full size trade (anything larger than speculative).

 The NQ/NASDAQ 100 futures also shows nothing but a negative divergence at the bounce top and in line/confirmation of the move lower, no positives.

 ES 10 min which is about where we look for trends. You can see the negative at the top of the bounce cycle and then leading negative to the downside. I did mention that price catching down to 3C in the green area makes it easier to get a short term bounce on the fast timeframes, we have the bounce, but no supportive divergences whatsoever which makes me believe it is as we expected initially.

 YM/Dow Futures 30 min also negative at the bounce cycle's stage 3 top and in line on the downside.

TF /Russell 2000 futures 60 min with a worse negative divergence at the most recent bounce and in line with out bigger picture expectations.

I don't see anything in the $USDX or Yen like I did Friday and yesterday that would suggest it will lead the market higher as it did overnight, it appears that's all we get. I do see Yen futures in more serious timeframes with positive signals which would be negative for USD/JPY and by extension likely the market.

I'm going to be looking for any signs of additional weakness building through intraday charts and/or accumulation in VXX/UVXY . I suspect this is our bounce.