Friday, February 1, 2013

Neat Day

There were a lot of great entries, there were some decent exits from trades yesterday that made more than 50% in 1-day and the overall tone was great. I'm going to update later because I have a few custom indicators I want to construct to give you a visual on the changing trends in volatility and a few other things.

The VIX buy signal using the DeMark inspired indicator worked well, the concepts in market behavior on the huge volatility squeeze in the VIX and predicting exactly what it would do 2 days ago was cool as well as putting or keeping us on the right track.

Looking at VWAP for ES and NQ, it's clear to see the selling was in to momentum moves up, there were no buying pullbacks to VWAP save for the very open, VWAP alone looked like selling all day and huge volume went through near the end of the day in ES, about 10x normal volume. The 3C signals fit perfectly with the VWAP/Volume/selling structure in ES and NQ.

Yesterday the Dominant Price/Volume relationship suggested a 1 day oversold condition and we'd see a bounce today, today's Dominant Price/volume relationship is the exact opposite, Price Up/Volume Down which is the most bearish of the 4 relationships and gives the opposite signal, down.

There were a number of low risk, yet excellent entries today. Volatility acted well, especially toward the end of the day. Credit made the situation for the market worse.

People only look at the daily gain or headlines like Dow 14,000 and don't look any further, the market is the last place in which you can expect things to be as they appear.

Today was actually a pretty stress free, easy day for me. Usually I'm looking everywhere for the hint of the clue, today they were just standing out very obvious, like yesterday and we made a nice gain out of yesterday's clues.

So all in all, I'm very happy with the day, I'll be taking a little time off to clear my head, create the custom indicators and look at everything fresh and wrap things up.

Oh and the Euro/USD, that's a move that's time looks like it has come which would be huge.

Talk to you soon.

Goldman Sachs (GS)

I've had several inquiries about GS, for the last several days I've advised any one looking to short it to leave it alone for the time being. This is not my ideal short, I think there are much weaker looking assets out there and just because something is likely to go down, it doesn't mean it's the best allocation of funds.

In any case, the deterioration for at least a trade in GS seems to be taking place now to the level in which I'd be more supportive of a short position there, again it's not my favorite by far, for instance I'd prefer FAZ or even just XLF short over GS, well maybe SKF to get a little leverage.


 The 1 min chart is going negative, I like this for the daily entry.

 The 2 min chart is starting to lead negative

 The 3 min chart shows the strength earlier in the week short term, that looks to have been aggressively sold in to, but this is still not heavy flows of capital.

 The 5 min chart positive and then relative negative, finally leading negative, this I like for maybe a swing trade or thereabouts...

I wouldn't feel good about a longer term position until at least the 1 day Trend Channel was broken on a close and then wait for a bounce.

 Also the X-Over Screen should go to a sell signal.

Intraday this is a pretty good spot, it has broken below the 50 bar 5 min and corrected up to it, maybe a little above would be a decent entry with much lower risk.


TICK

I hadn't noticed this earlier...

This is the NYSE TICK vs the Q's since they are the performer of the day (lucky guess on the QQQ calls yesterday rather than SPY). At both areas the Dow broke $14k the TICK didn't hit extremes, the TICK did hit an early extreme of +1250 in the a.m., but as prices climbed, the TICK was at a very moderate +750 at the highs of the day and trending down.

This isn't a signal to do anything, but it is a good indication of market breadth or participation on what you'd think would be a big day.

FAZ position size / Risk management example

I had been asked about Risk management for some positions and decided that it' been a long time since I've posted anything like this as it is an exceptionally important part of long term success.

I prefer a 2% rule (for equity positions), for options I think risk management is better achieved through some more complex option trades than our typical long calls or puts so we'll just deal with equities for now.

Lets assume a $10k portfolio size (calculations don't include any margin) for a nice round number. I wouldn't want to trade any more than 4 to maybe 5 positions tops (you can diversify enough with 4-5 positions and any more diversification is killing performance) and I'd prefer no more than 15% allocated to any 1 position, but since transactions costs represent a much greater cost than say someone with a $100k portfolio using the same strategy where transactions costs are negligible, I could see going to 20% per position and ideally you'd have some dry powder still left over.

 For FAZ long...

This is a rough calculation and I typically use different metrics for gauging risk, but I chose to use a risk metric based on gaps as they are the hardest to protect against and I came up with about $1.20 risk per share.

So if we are using a $10k portfolio and the maximum 2% loss is $200, then divide $200 by $1.20 and you come up with 166 shares, multiplied by the current price you have about a $2,000 position size which is about 20% of a 10k portfolio which is a little on the high side, but you have to still cover  higher percentage of transaction costs, so it would be ok with me.

So approx. 165 shares at a 10k portfolio with 2% risk on a closing basis and a stop of $1.20 or approx. $10.93 which isn't near any psychological stop area so that's ok with me too.

I prefer a wider stop on initial trades, especially when looking for a turn around or in heavier volatility, you can always add to a trade moving in your direction, but to have too tight a stop to get more shares is just greed and you'll generally find the transaction costs of getting booted out of numerous trades because the stop was too tight  add up pretty quick between slippage and commissions, etc.

By the way, it's mathematically impossible (for practical purposes)  to go broke if you stick to a 2% rule.

AMZN Charts

 This is a long trend and a strong trend and a company with one of the most well respected CEOs out there. I can't say how much can be retraced to the downside, that remains to be seen, but I can say that a trend this big doesn't just flop over without a lot of subterfuge and volatility which are often one and the same.

 Even the last pullback had a fairly volatile area. The volatility is even greater in this area so I wouldn't be surprised to see more of it given everything we know (all the charts).

 I'm still very much a fan of the equity short as seen here with a 15 min leading negative divergence with increased downside momentum

 A nasty 30 min right in the area where AMZN is making new highs.

 And the bigger picture 2 hour chart with a very bad leading negative divergence, of course many issues look like this.

However...
 The 2 min chart is leading positive, remember what I said about flat ranges and seeing accumulation or distribution depending on the preceding trend, this is a good example of the opposite of what I showed you earlier.

 The positive is moving out to the 5 min chart as well, as you can see it's not big enough to concern me over the equity short, but big enough that I think an options play may be a quick , profitable move.

And even on the 10 min we have  leading positive divergence, so this makes sense to me, both trades even though that may sound counter-intuitive, they are in different timeframes and will move at different rates.

AMZN Feb 13th $265 Call

Yes, you heard it correctly, even though I'm bearish and like the idea of filling out an AMZN equity short in the area, this is one of the other stocks that has an interesting short term chart. I'll show you the charts next, obviously it also provides a hedge to the equity short position.

BIDU Update

The BIDU call position (Feb 13th $105) is still open, I don't care for the shorter charts, but this is one of the very few stocks that has an interesting intermediate chart, I will probably leave it open because of that and as a hedge of sorts, if it weren't useful as a hedge, I think I'd close it.

This is a relative positive divergence on a 15 min chart, it can also be seen on a 10, 30 and 60 minute, although in many of those cases the positive divergence is within a larger leading negative, but the first move would still be to the upside.

This is exactly the kind of position I don't like to be put in with options, but unless something really slides badly to change my mind, I'll keep it as an open position for now.

Futures

ES's 1 min chart is just starting to come unglued from the intraday trend, the 5 min is where the trouble is.

NASDAQ futures have seen distribution in a very small range near the highs today and are turning very ugly now.

NASDAQ intraday futures.

Between the numerous charts, the move in the VIX around the Bollinger Band pinch on multi-month, maybe even year-differential in volatility, credit, etc and my gut feeling that when this comes, it comes quick, has me a little on the edge of my seat.

Market Update

In light of Dow 14k, I wanted to see if that had prompted any kind of willingness to take risk by the smartest of smart money, the credit markets.

Here's what I found, it's a bit disturbing, but not unexpected and for you FX traders, the EUR/USD short is starting to look more and more attractive.
 No risk in the most liquid of credit ETFs representing High Yield Corporate...

 The disturbing part is the trend, it's also the part we had been waiting for, but even I didn't expect such a clear message from credit traders of 100% RISK OFF unlike equities which are on the other spectrum of the smartest of smart money.

 High Yield which has been strange in a sideways chop was clear about today's move vs the SPX.

 Junk Credit wasn't inspired to take any risk (vs the SPX)

 The trend here is even worse than HYG.

And the unshakeable Euro, for once not leading the market...

Dow 14k

Not much volume as the Dow passes $14k, I told you CNBC would be the buyer!

In fact no perceptible increase in volume at all.

For most market averages we have to use the ETFs with intraday 3C, which is fine because the EFTs can often show demand or fear through the strength of buying in the ETF before the average ever moves, so it works out, however the Dow is one of the averages we can see intraday with 3C.

Here's a look...
 Dow-30 1 min intraday

 Closer view of the 1 min intraday

 2 min

 5 min

 15 min

60 min


VIX

If there was any kind of liquidity in the VXX options, I'd be taking the Calls (long) trade right now.

You may or may not remember this post, but when things go exactly as you expect, it's a pretty good confirmation.

Here's the VIX right now.

Note the buy signal and the Bollinger Band huge volatility squeeze.

In this post "Volatility" from this Wednesday, Jan. 30th, I showed virtually the exact same chart and below it wrote...

"As the BB's pinch, it makes a good area for a head fake move below the band, but at this time I'm more interested in the highest probability trade which is a move toward trend 2 (down) so any short term strength will be used for tactical purposes."

We aren't below the band, but we are below the average and this is the move I was talking about, it's part of the volatility. Unfortunately I din't see a lot of liquidity in the VXX Feb. options, so I'll have to think on this, but I do like the idea of, "Long volatility here"

I like FAZ (short Financials ) here as well

I guess it's no surprise that when one turns, they all start to turn.

I like the idea that I can use what ever is added here as a trading position if need be, but I have a feeling it will be longer than just a short term trade.

SQQQ long not bad either

Now that the Q's have filled the gap, I am really not opposed to adding/starting a long SQQQ (3x leveraged short NASDAQ 100) position either.

Going to fill out IWM short-SRTY Here

I'm going to fill out the equity short (long SRTY 3x leveraged bear ETF for the Russell 2000), I see the filling out worth at least a trade and most likely even better (longer term position).


IWM looks like it's going to roll over here...

More charts coming, but for at least an intraday  trade or beyond, the IWM is looking very poor here

Other Indications

So far Credit has no enthusiasm about today's move, HY Corp. is negative on the day, as is Junk Credit and High Yield. Yields are lower on the day and commodities are just starting to turn down.

The easiest way to show all of this is through the ES CONTEXT model, you may recall it went very negative just before the move down this week at -12 to -14, it has hit -15 today.

The bottom line, risk assets are not supporting this move AT ALL, they are in fact headed in the opposite direction.

SPY Update

This is really a market update, but focussed more on the SPY. Remember, "Volatility is going to increase to the upside and downside"? I said it the last 2 days. Suddenly CNBC's "The market is worried about the GDP" from yesterday doesn't seem to fit the market today does it? Are emotions and analysis really that fickle?

Here are the notable SPY/ES charts.

 The same "Rounding " price and volume patterns are becoming apparent, but note the difference in volatility today, much more vertical than Tuesday, we should see that same increased volatility on the downside move and ever increasing until the reversal is solid. For a market that has had extremely low volatility and ATR, this is a definitive change in character.


 The 2 min chart isn't confirming at all, it did show some positive behavior at the same time as the QQQ long call yesterday, but that's gone now.

 The 3 min chart is starting to act like it did at the start of the Tuesday/Wednesday move this week, except it's actually in a weker starting position because of the damage done Tuesday/Wednesday.

 The 5 min chart shows that damage and no recovery from it, there is a small positive relative divergence within the larger leading negative from yesterday, no confirmation today.


 And of course the increased downside 3C leading divergence momentum has been one of the most notable changes recently on very long and important charts.

 ES 1 min is also starting to sour.

The 5 min chart which has worked fantastic for next day or near term moves that predicted the move down this week as well as the move up today, is turning worse and worse to the downside.


QQQ gain

That last burst of momentum was helpful and I think AAPL was part of the reason...

AAPL did improve as I hoped and that may be the reason the Q's gained upward momentum.


The position was closed at a fill of $1.53 making it a +56% gain as the cost basis was $.98, I'm fine with that, even if S-A-? makes 200% as he probably will and I hope he does.

As mentioned, there are some things developing, particularly in the SPX which loo a lot like Wednesday, except we do have the increased volatility.

I hope you remember some of the key indications from yesterday that helped us understand what today would do, not only the market updates, but even the Dominant Price/Volume Relationships, etc. They are all pieces of the puzzle and all helpful.

Closing the QQQ call Position Completely

There are a number of things I don't like and there's good momentum in the Q's right now, time to close them.

Financials Creating an Opportunity...

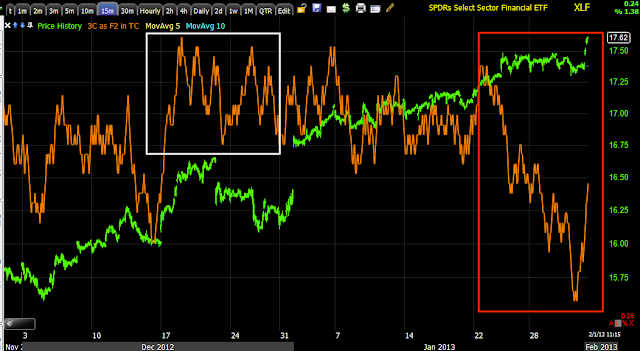
For the S&P to be up, Financials need to be p, just like the NASDAQ 100 needs tech for support. I have updated Financials several times this week, but haven't moved on them yet. In one of the updates I mentioned that the obvious range in XLF would be hit on the upside, there are just too many reasons not to when you're that close and this all create the rising volatility a well.

In any case, Financials may in fact be creating that window of opportunity, perhaps today.

Here's what I've been looking for, what has happened and what needs to happen to finally take a position in FAZ long or fill one out.

 Here's the 7 day range in Financials and today's break above them finally. The volume is there, which is good, that's the reason for the range and break above. I don't want to pull any trigger yet, but I do want my finger on the trigger.

One of the most common areas to see distribution in a trend like this or accumulation in the opposite trend is during flat areas or trading ranges, it gives a stable VWAP and fill for institutional clients, the break above the range as a head fake move is typically the last event in a series of events before a reversal, it's a head-fake or failed move and there are a lot of reasons as to why if you read my first 2 articles of the 3 part series, "Understanding the Head-Fake Move".

I have little doubt this breakout will be proven to be a false breakout as the chart above suggests the probabilities  were already very high before it even started.

 Here's a 1 min, very short term positive divergence that suggests the move to the upside is being prepared for by smart money, much in the same manner we just made a quick trade in the Q's.

Of course even the 5 min chart looks horrible and had very little chance of coming back. Now we just need to wait for the 1, 2 and 3 minute charts to turn very negative while price is above the range and we have an ideal entry for a Financial short, I prefer long FAZ.

QQQ Options Remaining

Honestly I'd probably have taken all of the QQQ position off the table if I wasn't getting my rear end soundly handed to me by other members in the same trades with more patience or perhaps grater tolerance for option related risk, there's one Canadian in particular, "S-M", who is quite good at extracting solid gains from the exact same options trades at the same time.

In any case, whether I decide to hold the rest much longer or close them out will largely depend on what happens with this AAPL chart in the next 30-60 minutes.

 There's a 2 min positive, this could save the Q's for a bit longer today, they need something to keep them going, so if this divergence really takes off, I'd be more inclined to hold the Q's a bit longer.

Here's a good lesson for you about how many options traders see their contracts expire worthless. I think we've only had a couple of options trades this week, no triple digit gains, but the options model portfolio is currently ranked # 18 of nearly 1100 portfolios for the week. Considering we've had some decent trades there, but nothing like  triple-begger or 3 digit gain, that should tell you something, not about my skill as an options trader, but as to the skill of the majority of traders. If we had a 100% return on the week that would be different, but at just over 20% on the week, that should tell you something about the derivative product known as options and how dangerous they can be.


QQQ Calls and Market Update

Well yesterday's weekly QQQ call trade was speculative, but I felt it had a good chance of making some money and while not the 3 digit gains you hear about often with weekly options (no one likes to talk about how many times they lost on the same options), the gain was respectable, for some people it's a month's salary in 1 day.

 As mentioned, I left about half the position open, but a nearly 37% gain for an otherwise dull market in less than a day, is opportunity and that's the point I try to get across. while I thin you do very well when finding the trading style and risk tolerance that fits you best, I have traded so many different markets that I don't like to consider myself any particular type of trader, I like to consider myself an opportunist. The move in the Q's looked high probability and obvious, but not particularly profitable without leverage, so the weekly options were used and you know leverage is my least favorite vehicle, but it was the right one for the trade.

I think you are most successful when you can identify opportunities and not put yourself in a box, know what tool to use for what job and take what the market gives, not what you think it should.
 
 The very short term 2 min QQQ chart was leading positive yesterday, the reason for the trade and the short nature of it (using options that expire the next day).

 At 5 mins there isn't the same opportunity which tells me this is a shorter trade, which fits with my picture of near term volatility and chop.

 So far on the 1 min chart there's still a chance for more upside, but the momentum is not very strong.


 ES (S&P futures) so far are trading along the upper band of the VWAP, which is fine.


 However there were only a series of very small positive divergences pre-market on the 1 min chart, I'm not inspired that this is a lasting move/trade.

The 5 min chart which is what I'm really using for short term directionality was positive yesterday, that is quickly fading to look more negative like Wednesday.

Thus it's time to take at least partial profits, as the day goes on, if the momentum doesn't keep up, the options lose value.