Monday, January 28, 2013

Position Updates

I'll be covering position updates and either getting them out as 1 post as long as there's time and no action needs to be taken before they are all finished or if there's need of quick movement, then they'll be split up.

As far as what looks interesting as of today, Financials have seen a lot of downdraft, FAS looks horrible as it is negative (leading) from 1 min to 60 minutes and every timeframe in between, this would suggest  short XLF position or a long FAZ position, it really does look that bad and I'll likely cover these individually with chart as I look at entering or adding to them during the day.

Energy as a group has also fell apart, recently I wasn't sold quite at the time, but it's grown a lot worse. I like ERY long here which is a 3x leveraged short on Energy, but I feel like it could use just a little more of a "U" shape in price and it's very close to that point, perhaps tomorrow it will be there as this has been one a lot of members have been asking about. My reply today was that as far as price goes, it's probably in a very acceptable area, as far as timing goes, it may have a little more time and time is money and risk so I prefer to be as close as possible on timing, there's no way I'd even consider being long energy in this shape.

Tech on the short side looks to me right now, as if it's not quite done, but it was just in rotation today so it may look different tomorrow. As long as AAPL has some gas in it, Tech is one I'd hold off on going in with both feet.

I do think AAPL has some more upside from here, mostly on a 5 min chart at this time, there's not much after that of immediate interest to me. That 5 min are is also where the Q's have "A" positive divergence, there's not much more in the tank there than drafting AAPL it would seem.

The SPY saw increased downside momentum in the 3C negative divergences today, remember though as I said there were some charts like TBT that were positive to about 2 minutes, not a very large divergence, but one nonetheless. The SPY does not look positive in the same area, but it has a bland congestion look so it may just draft whatever leads or just remain bland as it was today. It is extremely close to backing up the truck, I'd have my foot on the pedals, just not quite release the break yet, but again, this may all change very fast with momentum in 3C shifting so quickly.

The DIA is virtually in the exact same position as the SPY, my concern with taking positions right now is much less about getting a better price entry and much more about timing, whenever you are in the market you have risk so you want to have the best timing possible to spend the least amount of down time or even congestive time, we want to be in at the move, although I do want to have a substantial part of my position already in place as the market is getting more and more fragile, you can never tell when something might come out overnight and snap it and I don't want to be left empty-handed in a scenario like that.

Finally the IWM, I'm going to guess this is the average that sees leadership tomorrow and I mean that on a relative basis, I wouldn't say Tech was very strong today, but on a relative basis it was far stronger than the other sectors and averages. I'm guessing the IWM sees rotation tomorrow, but the quality of the signal is so poor, consider we entered Tech based on I believe 1 and 2 min positives, very few and small signals, I wouldn't take the IW trade based on today's signals, meaning they are even less moving than Friday's weak signals, it's just something to be aware of.

So we'll watch AAPL tomorrow as far as the Calls go and the Tech trade , whatever is left of that. I'll be looking especially close at Financials for opportunities on the short side followed by Energy, as in the sector, not specifically oil.

We'll also take a look at precious metals tomorrow and perhaps miners.

Since I can't get all the charts up and you'd probably not have time to look at so many, let me just show you FAS, the 3x long Financials, this is why I like the 3x bear financials as a long and just looking for the exact timing which as you'll see, is very near if not here. Most of these charts have no drawings on them because the momentum in the divergences is that obvious it doesn't need to be pointed out.

 Recent FAS 1 min chart downside momentum is off the scale.

 2 min chart since trend 1 started

 The FAS 5 min chart, note recent downside momentum is huge.

 1o min, I just wanted to point out the action on this chart in a single day

 Fas 15 min from the pop up start of trend #1, a big increase in downside momentum on the negative divergence and on an important timeframe.


30 min chart, again, I'm trying to point out the 1 day move for such a long term chart, rarely do we see this much movement on long timeframes in a single day.


As of right now, Futures are pretty flat.


Daily Wrap

Things were noticeably different in the charts today, something that is either very overt and obvious or something that is really nagging and sometimes a little scary (as each market is unique), today at first was the later and some visual descriptions had to suffice, the one you may recall is "Not just leading negative divergences, but instead of price moving up of flat as is normally the case, it felt like price was trying to climb a sand dune, while the sand underfoot was giving way".

Then this afternoon we got a JPM analysts Dow 20,000 target, sure I'm oversimplifying the exact details, but this was one of the things I remember so clearly about the 2007 top, the talking heads were talking about Dow 20,000 when everything we were seeing was arguing for a bear market which really makes you double check your math the first time that sort of thing happens. It happens this particular analyst had made a call July of 2008 for the 2008 SPX target when the SPX was $1200 and he was looking for $1450, then the 8 months of "FEAR" I talk about when describing how much faster a bear market falls then a bull rises, set in with 2008 closing 40% below his target. It's not so much the analyst as it is the sentiment whether the AAII spread posted last night or stuff like this-"Dow 20k", these sentiment extremes are good way points for the contrarian investor.

Not that this is part of my direct analysis, but I do consider the background and fundamentals like this doozy, the "French Labor Minister Says France Is Totally Bankrupt"

The truth is there's already concern that Germany will put in a second consecutive quarter of negative GDP and enter its first recession since the Euro-area crisis started. All of the bailouts up to now, all of the programs with 4 letter acronyms as well as the countries like the PIIGS (Portugal, Ireland, Italy, Greece and Spain) and all that has been done from replacing leaders with technocrats that use to or still are involved with Goldman Sachs, the bailouts and renegotiated terms, the ECB LTRO loans, all of these things that have been done have been to protect the core of the EU, which was considered France and Germany until France fell victim to the nasty "C" word, "Contagion", leaving only a handful of nations with their Aaa credit rating intact.

While history books likely won't teach it, the EU experiment and the real power behind the EU if you haven't figured it out already is all about and is Germany. One of the primary reasons for the EU was to create a free trade zone and then to bring in European and some former Iron Curtain countries in to the block once they had established their financial bonafides, in essence a credit check to make sure they can afford to pay for German goods as Germany is the manufacturer of Europe-this is really what the EU is mainly about. This French gaffe will not sit well with many that are already concerned that Germany will fall deeper in to contagion at which point there's really nothing to stop a German exit from the Euro-zone altogether. This is just something to consider when considering the important area the Euro is in right now and how transitional it can become which has dramatic effects on all world markets and the US potentially gets back the flu that it originally had and exported to Europe around 2008.

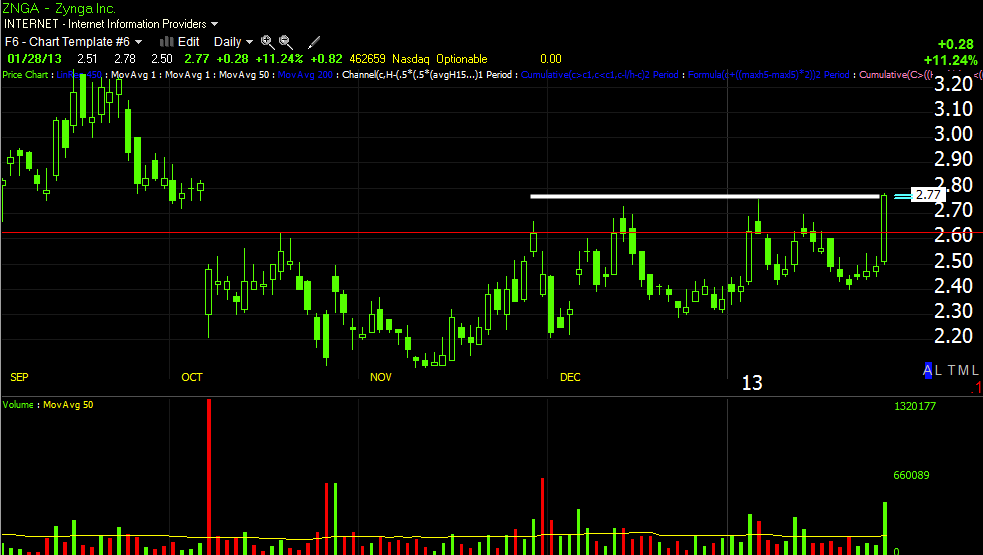
Picking up where we left off last week, Friday we entered leveraged long Tech in the form of TECL which was considered to be such a short term trade, I wasn't even sure if it would be entered and exited on Friday, but we left it open in to today along with a AAPL Call trade idea as well, also shorter term, but with enough room in case some signals that were borderline crossed the border and changed the nature of the trade there.

While the market's ATR has shrunk considerably in to 2013 (making it a little more difficult to generate the same returns one can make with a larger ATR), there are still opportunities, they just need the appropriate vehicle for the trade which generally means some leverage and a short duration.

Just to give you some idea of general volatility, I'm using a 10-day ATR (Average True Range) of the S&P-500, defined as the 10-day average of the daily high to low range; the narrower the range is, the harder it is to make money in general because there is simply less of a range available to pull money from with trades.

I also applied a 50 bar average of the 10-day ATR in yellow. In november the 10-day ATR for the SPX was $21.24 with the 50 bar average of the 10-day ATR being $13.22, basically there was a wider range in which to make money. At the far right we have a 10-day ATR of $9.23 with a 50 bar average at $13.82, the $9.23 10-day ATR is the second lowest since January 6th of 2011 with only 1 day since having a lower range, August 20th of 2012. This is only 1 of many ways to measure volatility, but you probably get the idea, this is why we take what the market offers and try to use the best trading vehicle for the current situation as once again, all markets are different and the market is as dynamic as any living, breathing, complex organism.

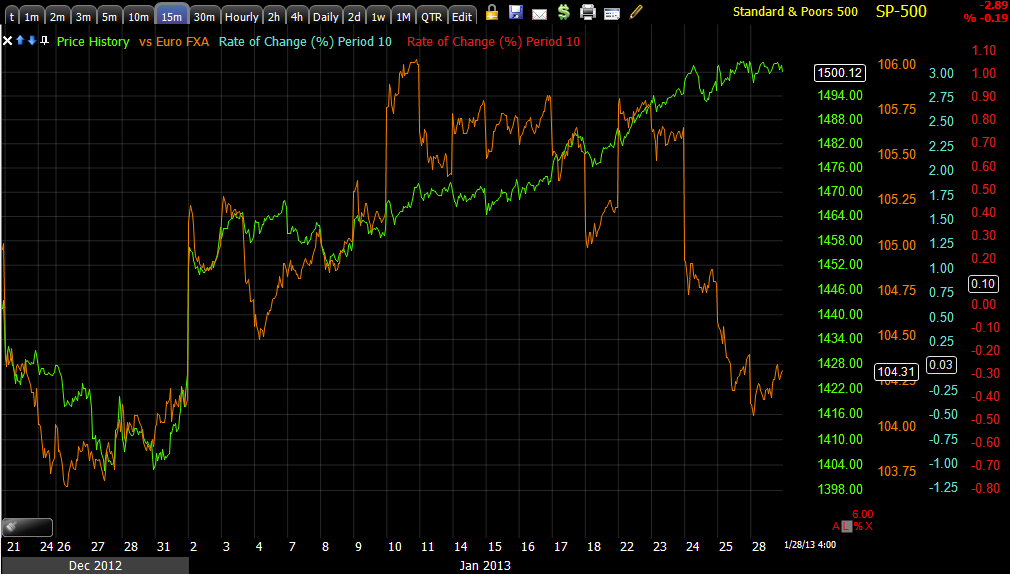
Considering the move above the major psychological level as well as centennial mark as well as the fact +1500 SPX was last seen on 12/10/2007 (over 6 years ago), this isn't what you'd call "Follow Through" and these are very basic concepts that have been abandoned in favor of the newest fad in indicators, but if you think about the concept of "follow through" of a breakout, a major psychological level or centennial mark or in this case both, just plain common sense will lead you to the reason why follow through is an important concept in judging the vitality of a move and the reliability, once you can make those out you can consider some of the other reasons the move may have been made.

With the S&P down today, it's not so much the percentage it is down that is important, it's the fact there was no follow through that is important, but I digress.

The point was, Friday we saw something brewing in Technology and AAPL with the Tech move expected to be like the other recent rotational moves, not only because that has been the recent trend, but because the 3C signals told us it was very high probability Tech is up today and outperforms, but very low probability that there's any staying power for the move-that's why a leveraged Tech ETF was chosen as the vehicle. As suspected, Technology outperformed:  Financials and Energy as well as Materials, Industrials, Consumer Staples, Utilities, Health Care and Consumer Discretionary; with the NASDAQ 100 outperforming the Dow-30, S&P 500 and the Russell 2000 and these were all simple signals from Friday, but had limits.

While most everything was just loitering around Friday's levels or lower, with the recently hammerd AAPL which was also a Friday pick, up +2.21%.

Some subtle hints and so not so subtle signals were to be found in Leading Indicators today, here are a few...

 Really since Trend #1 took off, commodities as a risk asset, have been much less optimistic about the market and I think the state of the economy, of course this can't be specific to the US, but worldwide. However when looking at the US and the Industrial production as we saw misses in 4 out of 4  F_E_D regional surveys on manufacturing with contraction, it only makes sense that the raw materials that go in to the manufacturing process are in less demand, it's not exactly what you'd call a recovery.

 You may recall I first became concerned with the Euro when these two nearly vertical price moves were put in as they almost always tend to end badly, then the Euro failed to follow through and consolidated sideways for sometime as Goldman had put out a long EUR/USD call (the last 3 calls they put out before this were all exactly wrong, it's not Goldman not knowing what's going on, in fact quite the opposite, just consider though how much money they pay analysts and whoever else they get information from, they then package it all neatly and hand it to you for free so you can trade against them-make sense?).

The breakout in the triangle of the FX pair was expected, what is also expected is that it will not be a clean simple affair in which, "The Euro has broken out, here we go for the next leg up". In fact one of the most common distribution areas is a flat range like this triangle, coupled with Goldman's call, I'm guessing GS had some EUR/USD to sell or was looking for demand to short in to.

Interestingly today, the pair put in another even tighter triangle...
This is the start of FX trading for this week at the green arrow and note the triangle formed up as we went in to the close today. If I had to guess I'd guess before it does anything else, it breaks out to the upside because that is what 100 years of Technical Analysis have told Technical traders to expect and most will only commit to a position upon confirmation of the price move they expect, it's what happens after that where we most often see Technical Analytical concepts used against technical traders which is the clear majority of retail traders since the advent of the Internet.


 Remember the post today near the end of day that talked about long dated treasuries or TLT and the positive divergences there, suggesting money was moving from the risk of stocks to the safe harbor of Treasuries?

That post was followed by a post on TBT, the inverse of TLT (Short Treasuries) and the very short term 1 and 2 min charts that suggested there may be some early upside or relative strength in the market that should give you a little more time to enter short positions if you chose to rather than be rushed.

Well above we have High Yield Corporate Credit, a rise asset that "should move up with the SPX, today it didn't perform so well vs the SPX, but it did show a very late day, very short duration move to the upside, the exact kind of move that can be used for a quick buck like we have been doing the past few weeks whether it be from one average to another or industry group like Tech Friday and today to another. Put more plainly, the bigger picture of HYG's action throughout the day was very much on the bearish side, whereas the very late day action of very short duration was on the short term bullish side just like the TBT post linked above.

A member told me about FCT and how it acts as a leading indicator via divergences with the SPY, I backtested it and found it to work well, here we see FCT in a negative divergence with the SPX through a good portion of last week and continuing through today.

You've heard me say many times that among the leading indicators and specifically the currencies, the $Aussie or Australian dollar is one of my favorites based on past experiences because of its association with hedge fund financed carry trades that they use to generate liquidity when they want to buy (risk on) and that trade being closed when they are reducing exposure in a risk off sentiment.

The $AUD has been looking horrible lately...
Here's the $AUD vs the SPX, the signal here with the $AUD alone would signify that the carry trade is being closed which is negative toward risk sentiment in the market.

However one of the main currencies that forms the other half of the carry trade is the Japanese Yen which has been in free fall due to Japanese policies which have sought to devalue the Yen to make exports more competitive, we just saw last week though that that hasn't happened as exports were atrocious, probably in large part to Chinese boycotting Japanese products in a row over a small uninhabited island chain they both claim to own, but Japan has actually claimed it with boots on the ground, which has led to a series of not only verbal jousting, but naval and air "close calls" as the situation escalates.

This extreme weakness in the Yen has kept the AUD/JPY looking strong and like it's in a risk on move, note that it did go risk on just before the market's November 16th low, the same one we have heavy market accumulation in to as the start of the next cycel up in the market.


 The pair goes risk on at before the 11/16 lows which we also show big accumulation just before, however the pair is now starting to look wobbly.


 A closer look shows the former momentum fading.

And since trade opened this week for the pair, it's looking even worse.


Here you see how bad the Yen has been falling, you'll understand this is a rare circumstance of an extreme nature, but the pair moving to the downside is inherently risk off for the stock market.

Other than what has already been posted today in successive market updates in which a theme clearly developed, the VIX's intransigence was notable, the days of volatility being used to ramp the market seem to have ended today with the smack of a brick wall.

Here's the normal VIX/SPX correlation...


Today other than an early correlation, the VIX broke free from the chains it's been held in recently as it has been used to ramp the market.

The intraday VIX was like many of the other assets that saw an increased rate of divergence.
 Intraday 3 min VXX exploded  sending recent divergences looking like they were flat because of the scale.

 The 60 min intraday VXX 's trend...

 However look at the 60 min move in VXX today alone, something was certainly different about today.

Remember the buy signal in my custom DeMark inspired indicator on the VIX last week, well it's off to a good start.

The VIX is VERY close to breaking out of the range, not exactly where you'd expect it with the recent SPX 1500 is it?


Daily Wrap - Position Review

The Daily Wrap is going to be coming out in a bit, but the analysis today was pretty consistent with more and more pieces of the puzzle fitting in together, the Leading Indicators almost perfectly confirm what I said in th last post as far as time goes, it's almost amazing how accurately they confirm each other.

I'm also going to run through some of the current long and short positions to see if there's anything I'd consider making changes to, selling, adding, etc.

I have quite a bit ahead of me, but I will have the posts out as soon as I'm done, it's a lot of charts and assets to cover.

FAZ long

Of course as you might suspect, this is looking good

TBT Charts

TBT charts... This is the mirror opposite of TLT, TLT was giving us signals that TLT long looks good, which would be a market negative. TBT to confirm would have the exact opposite signals as TLT and it does confirm the important stuff, but timing wise says we may have a little time, I'm talking about intraday on 1-2 min charts.

 TBT 60 min is leading negative which confirms TLT's leading positive 60 min chart, both suggest the market is in some trouble.

 Now at the other end of the timeframe spectrum the 1 min chart has a positive divergence, usually I'd say there's a danger that this is a consolidation signal only as a 1 min chart signal only can often be, but we have  another timeframes below.

 The 2 min, so this looks like we have a little time before these move, I don't know how much, I'm thinking intraday, which fits with what I've thought about a reversal all along.

However at 3 mins there is NO SIGN OF A POSITIVE DIVERGENCE, this tells me that the positive is very weak, probably only meant as a short term page holder and that's about it.

Because of this I'm not rushing in to any positions, but definitely looking and adding in areas that I like, this also make TLT long on a slight pullback a very nice looking set up.


You may have a little time-

I hate to rush in to anything, looking at TBT, the Ultrashort Treasuries, I think there's a little time, I'll pos the charts next, but they are negative where they need to be to confirm the last post and they are positive in the 1 and 2 min timeframes only, NOT the 3 min, so there may be a little time to get things together, bet further confirmation and not rush.

Charts coming.

TLT- This may indeed be an interesting trade, but more interesting data point

TLT or long term treasuries are the flight to safety trade, when money is moving out of risk assets like we seem to be seeing on an increased and larger scale, that money has to go somewhere and it usually ends up in a flight to safety trade like treasuries or something like TLT, that's why I find these charts very interesting and maybe worth a trade, especially with a little leverage, it is optionable-watch the liquidity though.

 The 1 min chart is more positive than anything, but lone it doesn't look like a high probability trade, the fact it is holding up well with the following charts changes that a bit and it looks much more high probability.

 The 5 min chart has more details and shows downside distribution/reversal areas as well as increased positive momentum today. The fact price is moving like it is may back up what I said earlier about smart money being more blatant with positioning because they are in a hurry and not as clandestine as they usually are.


 The 15 min chart shows real momentum on the upside recently  and shows this possibly as 1 larger base area...


The 60 min chart tends to confirm exactly that.

I think I'd probably be interested in TLT long here, or maybe a leveraged version of one of the long dated treasury ETFs, just make sure there's volume in them, many are VERY thin.

More than that, this is a signal that doesn't look so good for the broader market so you might bypass TLT and instead look at some short positions you like or want to fill out, I'll  be looking and let you know if anything pops out.


ZNGA Update

This is one of our long positions, I just covered it late last week in this post... trying to decide if it should be closed or a partial closure and instead I wrote the following...

"I was looking at it and trying to decide if anything needed to be done and actually kind of like ZNGA where it is right now.

As ZNGA is a partial position, it still has room for about 50% more until it's at full size, I might even consider adding in the area.

Overall the longer term and probabilities on ZNGA look very bullish.

The 10 min chart is already showing a decent positive divergence building through this area so I actually like ZNGA here.


I'm not opposed at all to starting a position (long) here or adding to it, I'd personally bring it up to 50-75%."

ZNGA just went up over 11% today so it's time to take another look. 

ZNGA is now at more than a 19% gain.. I hope you got some last week.


This is today's daily chart, it's just near intraday high resistance so the close will be important.

I really don't see anything that makes me even want to take partial profits except the fact it's a pretty big move and kind of parabolic, I'd probably prefer to stick it out, see how it closes and remember that this is still in a base and was meant to be a longer term position, not just a trade, but if you want to take 20% profits and look for a new entry, that's your call.

So far I'm ok with it staying open.


The Averages-

Just as we looked at industry groups, there have been some short term opportunities in the averages to trade from one to the other and although the gains aren't big, with leverage or just being right on each one of the trades has made it worth at least following, it also tells us more about the overall market as we seem to be in a new transitional period.

To tell you quickly, I don't see much as far as high probability opportunities, but there are charts below I think you should see as a way of understanding what's going on in the process and how it has changed even more than I'd have expected and particularly today.


The Q's don't seem to offer much right now.

 3 min QQQ is showing what's been going on there, note today at the far right.

 The longer 30 min chart

And even a 60 min chart's decay that starts very sensibly from our perspective right around a head fake move (yellow).

The SPY...

 All of the charts from 1-5 min intraday are either in line or negative so there was no need posting them, but do look at the 5 min chart within the context of its trend below...

I don't even need to make any notations.


And the increased downside 3C momentum is all the way out to a 30 min chart here on a short term basis, this is really ugly.

The IWM... I don't see any high probability long opportunities here either...
I used a 1 min chart because it's the fastest, the most sensitive and it shows in the yellow area there was no positive divergence to drive price at all and we are seeing a negative divergence in the IWM on the +0.20% price move today and the divergence has migrated intraday to the longer charts as well.

Finally the Dow/DIA...
 I mentioned the DIA earlier as having the best looking intraday chart, this is barely a positive divergence and a relative one at that, but enough to move the DIA and 3C is in line with that movement.

The 2 min chart had no sign of the same positive divergence so apparently it wasn't very strong.


 The 3 min chart shows about where the short term lid is on the move.

 However what is really important and interesting is the rate of decay in 3C on important timeframes like 10 minutes and this action being very close to either today or a little Friday and moving through today as well.

Take a look at this rate of change in 3C on a 30 min chart and that definitely started Friday, but rally picked up today.

Sector Rotational Trades?

Friday was showing accumulation in Tech, I'll deal with AAPL separately and today Tech outperformed Financials and Energy and still is (only one of the 3 that is still in the green). The question is whether there's rotation to another sector or even if Tech is gaining back some of the strength it started losing early on as it, again, was only meant to be a short term trade.

Also the results of this look at the sectors should be considered in broader market analysis.

I'll do the same for the averages in a subsequent post.

Financials
 There's not much to see in the 1 min chart that you can't see in the 2 min chart, a head fake move to the upside is immediately sold and there's no actionable signal here for a long trade.

 At 5 min we see the worsening damage done last week-if I scale the trend out even further you can see this is nothing new, just the magnitude is definitely increasing, thus my comments about damage on important charts done last week.

 Here's a long term view on an important 15 min chart since the accumulation that started the new cycle from the November 16 lows, yo can see the rate f 3C deterioration here, to the far right this is the most recent and strongest. I don't see a long trade here, I may even look at some of the short Energy trades as I didn't like them much early last week, but started to like them more and you can se why, late last week.

Financials
 This 2 min chart is the only slightly bullish chart in the near term, it may just be an anomaly as it isn't there on the 1 or 3 min chart on either side of this 2 min.

 XLF 3 min- as I said, no similar signs.

 XLF 15 min with an increased amount or rate of deterioration last week, again I'll probably look closer at the possibility of short trades here, new or add-to positions.

Finally Tech...
Since the divergence didn't really go out too much beyond this timeframe (thus the short duration trade),  this bit of deterioration doesn't inspire much confidence to hold Tech as a sector, long.

The overall tone here is bad too.

I'll see if there are any signs of individual averages looking as if they may rotate as we saw the last week or two with some sharp calls, but very quick moves. You take what you can get from the market, you can't get more than it offers obviously.