Thursday, November 29, 2012

After Hours Futures

Here's how the initial overnight futures are starting out the night

ES (S&P E-mini Futures)
 ES 1 min was pretty tight between 3C and ES itself all day, it loosened up toward the end of the regular hours session and has since loosened up a lot more as ES is leading negative, but ES is still managing to hold $1412.

 The longer 5 min ES chart shows the first serious divergence that took stocks lower yesterday morning, the end today wasn't positive, but not quite at a new low either.

 The ES 60 min chart shows clearly where accumulation was sharp at the 11/16 lows with the market very strong that day, but since there's been a decently large negative divergence that must be resolved and I don't think that can happen without a pretty serious move down. However I don't see this as a trend change to the downside as you'll see, the longer charts are very bullish from the October-November accumulation cycle which is based on something Wall St. knows, perhaps about the fiscal cliff? I'm really not sure, but this is a big cycle, not the normal garden variety.

NQ (NASDAQ E-Mini Futures)
 Like ES, NQ 1 min was also tight, but negative all day and loosened up toward the close, it's now leading negative and in fact worse than this already.


 The 15 min chart shows confirmation at the green arrow and a negative divergence at the red arrow, again it's pretty significant in size.

 The 60 min chart shows confirmation and the initial strong 3C move off the lows and a leading negative position since.

 If we look at the daily chart (for any of these, it's the same), we can see a large accumulation cycle after the market topped. This cycle ran from about late October through mid-November, the 16th was the start of the move so any pullback, no matter how bad it may look (even new lows) has extremely high probabilities of moving to new and significantly new highs. The basic way I'd want to approach the market is leveraged ETFs, maybe a few options for a pullback move, then once those are sold as 3C starts to show accumulation in to lower prices, start adding to longs/leveraged longs and ride out a bull move through the end of the year and likely beyond. Ultimately and I don't know if it is this cycle or one further down the road, we'll want to back up the truck on shorts and hold on as we see the market put in a new kind of decline on ultra-low liquidity as the HFTs pull all bids and there are few market makers or specialists left, the end result (and you've seen how bad the long term negative divergences are), sellers who want out and use to be able to find it with a market maker or specialist as long as they were willing to take market price, could find a way out. However HFT's have replaced many market makers and specialists as the HFT's can get in front of the traditional liquidity providers with better bid/asks, but they are under NO legal obligation like a market maker or specialist to make a market and to take the other side of a market order no matter how ugly the market, the HFTs can simply shut down and there goes all liquidity,  it's the making of one of the worst, if not worst market declines ever.

One bridge at a time though...


SCO Closing Charts

SCO is the leveraged Short Crude Oil position posted earlier today. The entire puzzle really fits together and centers on the FX market, specifically the EUR/USD or even more specifically, the $USD as oil and most commodities across the world are traded in US Dollars so changes in the value of the $USD automatically effect prices in $USD denominated assets. If the oil cartel is selling oil at $100 a barrel and the $USD falls, the $100 they were selling oil for is worth less so they have to adjust the price of oil up to compensate. There are of course a number of other pricing pressures in oil: Geo-politics, supply/demand, domestic politics and the SPR, costs, loss of capacity (like a broken oil pipeline, a hurricane shutting down off shore rigs, etc.).

Here are 3 different, but confirming assets for this trade, USO which is the US Oil Fund, /CL which is Brent Crude Futures and SCO which is the 2x leveraged short Crude ETF. That's 3 different assets that trade entirely differently, especially the futures, they should confirm each other for a high probability trade.

 I'll keep USO (above) next to Crude Futures (below) in similar timeframes so you can see if the signals are similar. Since these are two different charting platforms, the one below has its own version of 3C, it's not the same as the one above, but it is robust and gives good signals so any similar signals are even more likely to be accurate.

On the 1 min USO chart today we see early distribution as USO gaps up, there's a small positive divergence sending USO higher (usually so a market maker/specialist working an order can sell at higher prices rather than consecutively lower prices). By the 2 p.m. bounce there's clear distribution in USO and by the end of the day 3C is leading negative which is the strongest divergence type.

 This is /CL (Brent Crude Futures), since this trades 24 hours during the trading week you won't see many gaps except at the start of a new week after futures have been closed over the weekend. You can easily see though where today's regular hours trade was by looking at volume or the date/time at the bottom. We have the same distribution areas intraday and the same leading negative divergence by the close, just like USO.
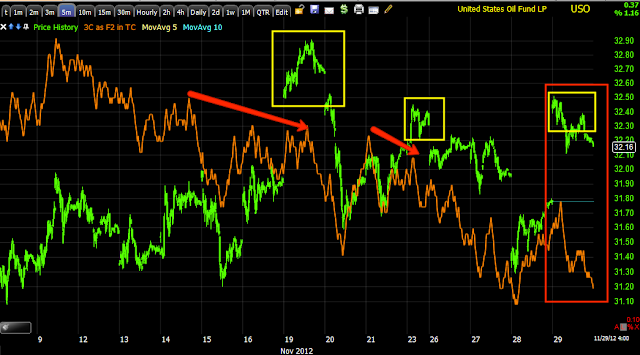

 On a longer 5 min timeframe (this is usually where we first see larger institutional orders in divergences-the longer the timeframe, the more meaningful/reliable the divergence. On the 19th price makes a move above resistance, that move sees a negative 3C divergence rather than 3C moving higher with price and the move fails, this is a head fake move and usually leads to a sharp sell-off which you can see the next day with a virtually vertical drop in to the 20th of this month. There are a few smaller head fakes and today's, these are meant to bring longs in and shares are sold/distributed to retail longs who are holding the bag when price drops, but a big gap up like today's is enticing to retail longs, they chase price and call if "confirmation", as they feel that is the safest way to enter-after you already see price move, but I disagree. Today's gap up saw 3C sit in place, not move up to confirm the move so it's likely there was distribution in a big way today as traders bought the gap up, also known as a "Bull Trap" and one of the reasons stocks fall so fast after a failed move-you can work out the reason why if you imagine you where the buyer and how you'd react when a stock you just bought sees a dramatic decline the next day.

 Although /CL won't show the gap up this morning because it traded overnight continuously, you can see the same negative divergence in to today's highs as the USO chart above.


 Here's a 30 min USO chart, which is as far as I'd go with this trade, there's not a lot of detail here, but the trend is obvious, 3C was positive at yesterday's lows (smart money buys low and sells high) and today on the gap up 3C didn't make a new high, in fact it fell a bit.

 The /CL 60 min. chart shows exactly why I consider this a shorter term trade (days to week/s), there's a larger positive divergence building (white arrow) and one of the reasons crude may come down (we are trading it short) is so this larger base can continue buying crude at lower prices as they are toward the top of the range and that's likely out of the accumulation area.

Before that you can see a negative divergence in to what I would call a parabolic price run at the far left (remember these almost always fall just as fast as they go up) and then there's a breakout above resistance to a new high, this is what smart money needs to sell shares short to bring prices back down, buyers who are willing to buy and retail is willing to provide the demand smart money needs to unload the shares as retail considers it confirmation of a breakout above resistance, where as for smart money it's a simple bull trap and when prices fall, retail's selling will cause more supply and lower prices, most of the time smart money would not only sell up there, but take a short position too for the decline back in to the accumulation zone.

Now SCO-the 2x leveraged SHORT ETF for Crude
 We should see almost exactly opposite price action and 3C signals when compared to USO or even /CL. Today at the lows we see positive divergences, you can actually see where the bulk of the accumulation occurred. Just as USO and CL ended the day with a leading negative divergence, SCO ended it with a leading positive divergence.

 On a 2 min chart you can see where SCO was sold by smart money or middle men and where the positive divergence picks up -again in leading positive position so the early analysis was supported by closing trade.

The 5 min SCO chart shows a head fake area above resistance, note it doesn't have to be much above resistance because traders look at support and resistance as exact levels like $1401.23, which is crazy if you think about the emotional reasons support and resistance form, this is why it's so easy for Wall Street to got on fishing expeditions for stops, not only do they know (as do we) exactly where the stops will be (to the penny), most traders place stop orders with their brokers so they are on the books for all who have access to something like TotalView to see. In any case the point here is the positive divergence at lower lows in price and the leading positive divergence at the end of the day. So I like SCO even more than I did when I talked about it earlier today.

Still Like SCO, Even Here

SCO entered earlier today as a short play on Crude still looks good, even here I'd consider buying it.

USO's charts still look bad/worse on the day, /CL Futures also look worse and SCO looks better.

ZNGA Follow Up

Out long ZNGA position is still looking pretty good, it's bumping in to resistance right now and if the market is going to pullback a bit (even though ZNGA and FB tend to trade on their own), it might be just enough pressure to cause ZNGA to consolidate.

Both suggested trailing stops from this morning held so it's up to you how you want to deal with ZNGA, I chose close 1/2 the position and re-enter on a pullback.

You might want to watch for a closing candle that forms a star or Doji (although I believe the stops suggested would take you out before that. With the volume already higher today, a reversal candlestick has strong probabilities for at least a short term reversal. I figure ZNGA would have to close anywhere from about $2.56 to $2.59 for that scenario to become high probability.

 Resistance at $2.66 from a hammer, these candlestick resistance/support areas I have found to be pretty strong, stronger than typical trendline resistance.

 The 60 min stop mentioned this morning, there was nothing even close to a close under either average.

On the 30 min there's 1 candle at the red arrow that is right on the line as far as where it closed, probably not enough to cause me a stop out, but pretty darn close; every other bar closed above the averages.

Longer term ZNGA still looks fantastic.

IWM Puts = Dec 22nd $82

IWM Put Position

I already opened a Tech, a Financial, I like the looks of the Q's, but have that covered, I like the look of IWM.

Hopefully we get a 1 or 2 day nice volatile move. I'll be looking for December and just in the money.

Not Sure if this is it-FUTURES

The SPX, NASDAQ and DOW Futures 3C charts all just went much more negative than they have been previously today.

Major Market Update

I really should save this until the close when all the information is available, but a lot of it is right now. First I'm going to give all 3 trends and use the DIA and IWM as examples, it's not that they aren't in the QQQ or SPY (the Q's are actually one of the strongest examples), it's just redundant. Maybe I'll introduce a sort of "Trend Table" to identify expected trends of different length and size.

Then some intraday Leading Indicators.

DIA 2 min intraday makes this area look very dangerous and susceptible to a break to the downside, which would fit with the short tern trend expectation of a decent pullback.

 The pullback trend is represented here on the DIA chart on the 15 min timeframe (excellent swing timeframe and important as well), you can see the strong positive divergence in to 11/16 and the recent negative divergence suggesting a pretty strong pullback to the downside.


 Overall though that should only be a pullback, not a new downtrend as the 60 min chart which is more powerful than any above has a large positive divergence with no damage, so a pullback and resumption of the uptrend in to the end of the year.

 I'll show the same for the IWM, intraday the 1 min makes this price ledge look very dangerous.

 The 10 min chart representing the start of the uptrend and an expected pullback.

 There are longer charts, but even on a 15 min chart there's a large positive divergence for the larger uptrend with no damage at all in leading positive position, again suggesting any downside is a pullback move only and will see continued upside.

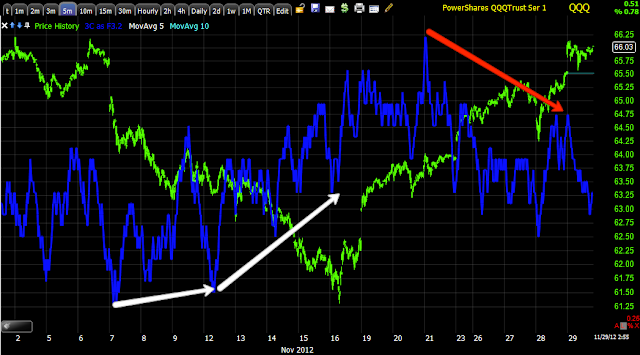
 QQQ 1 min intraday is getting worse in to the close

 QQQ 5 min pullback signal

 SPY 1 min intra day negative

 SPY 10 min pullback divergence

 Intraday leading indicators: Commodities are out of sync with the SPX as a risk asset, they shouldn't be on a truly supported risk on move.

 Yields are pulling at the market to move lower along the lines of a pullback.

 Yields intraday are negative as well, also not confirming any market strength in other risk assets.

 The $AUD intraday is way out of sync, the market typically follows the $AUD.

 $AUD very close up intraday movement isn't event confirmed w/ the SPX.

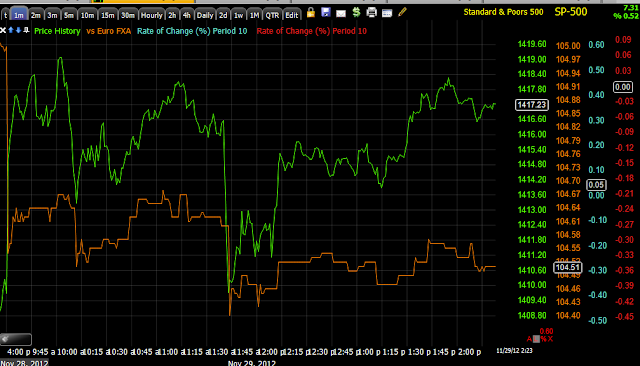
And the Euro which should be almost exactly in sync with the SPX, it's negatively divergent.


Some Quick SQQQ Charts

This is for a shorter term pullback/maybe a bit more, position so again leveraged ETFs are a decent tool, options would probably work in the area as well.

I didn't annote the SQQQ charts, I think the divergences are clear enough.
 1 min

 2 min

5 min

It goes clearly out to 10 min, hints on the 15 min chart.

Closing TQQQ Adding SQQQ

This will be full size as it needs to cover a lot more ground as a hedge, but normally I would still consider this a speculative size trade as it is counter trend to the bigger picture for the rest of the year.

This Area Looks Dangerous

This last little ramp has seen the 3C SPY deteriorate badly, the DIA, really bad in the QQQ and IWM.

I have a feeling if I need to make a choice, it will have to be soon.

FX Update

I'm watching for any hint that something is about to change, so there's a lot of jumping between symbols.

The way the equity portfolio is set up (although this is more for tracking than anything, but I still try to keep good habits) is the Core Shorts which are all at a gain except GOOG at a very small loss, but you probably saw the plan for GOOG posted yesterday and then there are a lot of leveraged longs to take advantage of the cycle set up from late October through days before the 16th of this month, that is the larger, higher probability move, but within and before that we have good signals for a sharp downward correction before the move that started on the 16th really continues, there are no positions to hedge the ultra-longs in the equity MP, the only hedges are Puts in AAPL, Calls in FAZ and I forgot, a short in AMZN- oh and SCO today.

It's not nearly enough to hedge the long exposure. I'll wait to see if there's something that really moves me to hedge, but SQQQ had some interesting signals today.

Here's a look at several currencies and the 3C charts-30 min all,

 This is the $AUD/USD with a negative divergence, that is market negative and that's a 30 min chart, the second relative high is much more negative than the first.

 This is the Euro only futures, same issue on a 30 min chart, much more negative at the second relative high.

And the Euro/USD, again suggesting Euro down, USD up, that's market negative and on hefty timeframes.

I'm starting to wonder if I shouldn't have more short term exposure, I want to see something that really makes me move though.

More MS Signals

Since they were in the SPY, I had to check the other averages to see if there was any sort of confirmation, all of them confirmed to various degrees.

 DIA intraday today and confirming 1, 5, 10 and 15 min charts as well.


 DIA 3C 1 min leading negative, also in a flat range.

 IWM 1 min MS leading negative, confirming all timeframes from 1 through 15 mins.

 IWM 3C 1 min already in a leading negative position, also leading negative intraday.


 QQQ, I include a bit history because MS usually follows price on intraday charts, a clear leading negative today and from 1-30 (1, 5, 10, 15, 30).


QQQ 3C.

Never seen that, there's also negative in some industry groups I looked at, Tech, Financials...