More head fakes then you can shake a stick at. I often talk about the fractal nature of the markets, here's a good example of the fractal nature of the markets with regard to head fakes.
Here's the daily of the Dow-30 (-.01). The Dow had already crossed the 200 day moving average for a lot of traders, this is a long signal, it also just peaked above resistance and ended the day with a doji which is a Japanese candlestick that looks like a "t" because the open and close are nearly identical, in Japanese candlestick charting this is a loss of momentum and often is taken as a reversal signal, especially after a strong trend up, changes in character! Still, please remember that reversals are most often processes and not 1 day events.

Intraday another predictable head fake was set up, this is an Ascending triangle and it carries a bullish bias, it must occur after an uptrend and is considered a breather. Many traders will buy the formation itself before it even breaks out because of the bullish bias it has in technical analysis dogma. So the move down would have caught some longs by surprise, you can see volume picked up a bit. Remember Friday's close? If you saw my video last night I said a ramp like that is hard to take serious, it is like they are trying to lock the longs in over a long 3 day weekend in which they would normally be inclined to close positions. It also gets the part time trader who has to go off to work to enter a buy order and head off to work after they see the Friday close. So as I pointed out, the ramp Friday had no news, no accumulation, it was a flat day all day until the close, it looked like an obvious manipulation of the market and a bull trap of sorts.

Check out the 2 min distribution today not only at the breakout, but during the entire bullish triangle.
The 5 min chart is even worse being a longer trend.
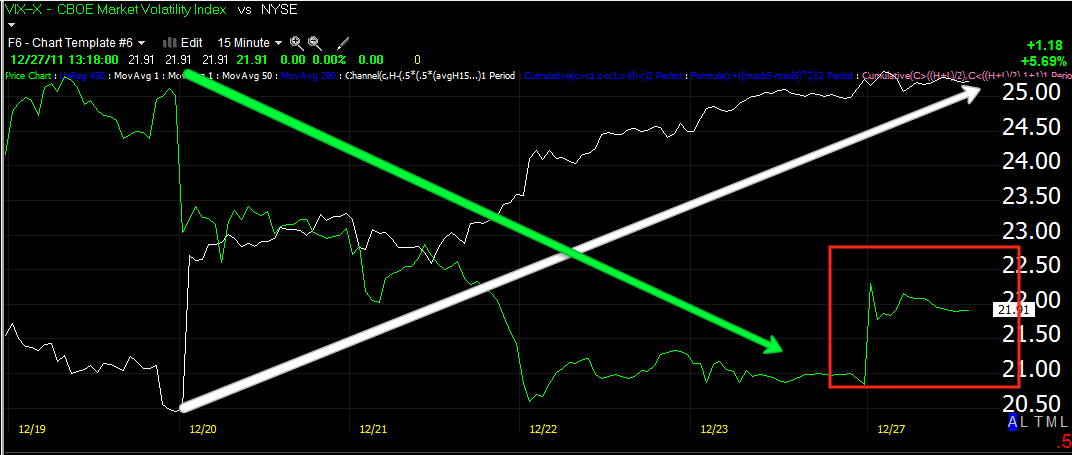
The 15 min went from a positive divergence (white) to confirmation (green) to distribution (red) and all of the leading is today alone.
The 30 min chart shows the same accumulation/distribution cycle, but impressively look at the leading negative divergence and where? Right where the longs would be buying, in essence, Wall Street had demand for the supply they wanted to sell and it looks like that's what they were dong according to 3C.
Here's the cycle on a 60 min chart, look at how much negative leading there was today alone, this is unusual to see this extent of leading on a 60 min chart in 1 day.

Here's the IWM/Russell 2000 and again, the same bullish ascending triangle and the (probable) false breakout in yellow.
Look how negative the 5 min 3C chart was and look at the smaller red box, the negative divergence got worse as the IWM broke out, so it would seem dumb money provided demand on what they viewed as a bullish price pattern doing what it should, giving Wall Street demand to sell their supply in to.
IWM 10 min chart also leading negative, note the confirmation between multiple timeframes.
And the leading negative 30 min chart
So the S&P and Dow barely did anything today, the IWM and QQQ both performed stronger, is it because of the Santa Rally? I doubt it, remember the last thing we see before most reversals is a head fake move which I explained earlier today. The QQQ/IWM both were out of position, unlike the Dow and S&P which already made bullish moves to draw in buyers, the QQQ only made that move today in crossing the 200-day m.a. and the IWM only attempted to make it by breaking out of local resistance.
Intraday the Q's formed the same bullish ascending wedge (Technical Analysis is used against technical traders every single day and over a decade this has been going on, yet traders just don't learn), the same breakout and the same failure below the apex of the triangle or breakout point. This cut the Q's intraday gain in more then half to close up .25% or for all intents and purposes, FLAT.
Here's 3C 1 min on the breakout in yellow, not exactly confirmation, but instead a new leading negative low.
The 2 min chart shows exactly what smart money was doing and when. This chart deserves some attention, this is how Wall Street plays the game.
The QQQ 15 min chart from confirmation to a relative negative divergence to a leading negative divergence. We have found that the 15 min chart, when accompanied by signals in other timeframes, is an excellent timing signal for a swing reversal.
Here's the SPY up .06% on the day, it had already broken above the 200 day ma.a, but also broke above the downtrend line, something traders would be watching as well. Again note the small body on the candle, if you look at the whole chart you will see that small body candles often occur at reversals, both up and down; it's because of a loss of momentum, which opens the door to a reversal.

The SPY had 2 predictable head fakes, the first was an ascending wedge, a bearish wedge that traders think should break to the downside, the upside breakout would have forced short covering and TA dogma says, "When a price pattern fails, take the opposite side of the trade", so in many cases, they get stopped on the first head fake, enter the position in the opposite direction (long on the "apparent" failed bearish wedge) and then get stopped again when the wedge actually does breakdown. We also had another bullish ascending triangle today which traders would have bought, it also broke down below the apex, something technical traders wouldn't expect.
Here's a close up of the SPY today and the breakdown from a price pattern that traders expected to breakout to the upside.
The SPY 5 min chart shows what Wall Street was doing in underlying trade, absolutely taking advantage of the bullish set ups to distribute/sell short in to.
At the left we have a positive relative divergence or accumulation at the white arrow kicking off the bounce, today on a 30 min chart look how much leading to the downside we saw in a single day, again, apparent heavy distribution as today was the last day for institutional traders to make trades that will settle before the new year, meaning they can get them out of their portfolio and they won't be seen as positions when the 2012 prospectus is provided to new clients, "The art of looking smart"
So this was the end of the T+3 settlement date for 2011 trades. We may still see some upside volatility now that tax selling and window dressing is over, but I must say that the position of 3 in multiple averages and multiple timeframes is quite negative. Traditionally the Santa Claus rally would be in full swing today, I would hardly call an average gain between the 5 major averages (Dow-30, S&P-500, NASDAQ-100, Russell 2000 and the NYSE) of 1/10 of 1% (.10%) the kick off of the Santa Rally.