Monday, April 6, 2015

Daily Wrap

Last week's call on the market was pretty spot on, but as you probably remember it was tough finding much in the way of decent signals and this tends to happen when you really shouldn't be torturing charts looking for a signal for a specific reason, day to day volatility was dying down inside a roughly formed triangle making it very difficult for short term traders to make money, such as this...
As right angle and symmetrical triangles closed in on their apex, trading ranges narrowed, until late last week when the lack of signals started making sense as posted in the near term forecast using AAPL as a proxy after I had gone through my watchlist and noticed a repeating theme of pinching volatility, IMPORTANT: AAPL Set-up & Market Movement'

From the linked post above...

"What is a triangle when it comes to volatility? It's like a Bollinger Band squeeze in which the ATR might be getting more volatile on an individual day, but the range in the market is squeezing like a Bollinger band pinch, which is THE PROMISE OF A HIGHLY DIRECTIONAL INCREASE IN VOLATILITY. "

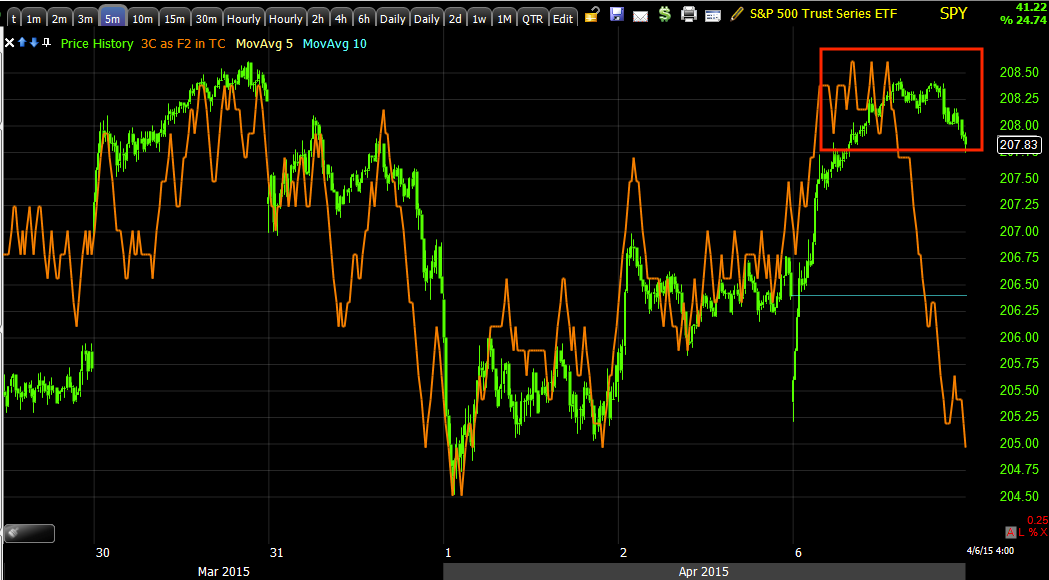
Today's move was darn near exactly what we were looking for in the near term forecast. If you read the entire post and the Daily Wrap from Thursday, you may remember my leaning toward the whisper number with regard to Payrolls on Friday morning being correct and leaked. One of the stranger events Thursday was the selling of VIX protection rather than the buying of it as we were going in to an uncertain 3-day weekend with not only a possible Greek default looming, but the Payrolls data when the market was closed Friday, it made no sense that protection was not bid, but rather sold.

From the Daily Wrap

"STRANGELY CONSIDERING TOMORROW MORNING'S 8:30 A.M. NON-FARM PAYROLLS DATA (the most important payroll data of the month and closely watched by the F_E_D as discussed earlier today), VIX short term futures underperformed the SPX... I don't know if the market knows something,  remember the whisper number is about 100,000 shy of consensus (mid 100k print) which would likely be taken as bullish by the market as it would tell the market (true or not) that the probability of a June F_E_D rate hike diminished."

I think you get a pretty clear picture and I think it pretty clearly looks at the Jobs "Whisper number" floating around all last week as some kind of leak. As I said earlier, I believe this is more about the $USD than anything else and whether we get some crazy F_E_D comments that are meant to talk the $USD down, the near term reaction to the horrible Non-Farm Payrolls on Friday most likely didn't need anyone to point out the obvious  market perception... that the big miss in payrolls lowered the perception for a June Rate Hike among market participants, note I did not say among the F_E_D / F_O_M_C.

HOWEVER, whether needed or not, our prediction that some F_E_D mouthpiece would be out right after a dismal jobs number , and this was forecast BEFORE the jobs number came out, it seems I was wrong, IT WASN'T BULLARD (but maybe they're saving him for the truly ridiculous stuff), it was straight from the NY F_E_D's president, Bill Dudley.

Fed watching recent U.S. weakness; rate-hike timing unclear: Dudley

"The timing of the Federal Reserve's interest rate hike, which would be its first in nearly a decade, is unclear and for now policymakers must watch that the U.S. economy's surprising recent weakness does not signal a more substantial slowdown, a top Fed official said on Monday."

This article/statement from Dudley seems rather reasonable, it's not the QE4 trial balloon that some expected nor the overtly dovish comment I expected to talk the $USD down without actually having to do anything, ala Draghi who has done it so much he's lost all credibility. However even as a softer, less that expected dovish tone was struck, it seems it was already pretty clear to the market or market's perception that this would be a reason to throw rate hike timing i to question, thus I doubt a strong statement was needed right off the bat, although a statement from one of Yellen's closest allies in the F_O_M_C was forthcoming rather quickly on the first trading day after the NFP.

I suspect they may pull out Bullard or someone else with some wackier statements if this doesn't knock the $USD down a bit, which so far it hasn't made much of an impact, thus the need for the gentle reminder that timing is in the mix whether it truly is or not.


Note the $USD's 3C 1 min intraday divegrence after hours after running up today and after some very whacky FX trade including a last hour EUR/USD flash crash in the most liquid FX pair out there...
$USDX looks like it's going to see some overnight weakness as the post cash market negative divegrence builds in. Note, I think some of the whackier events like the nearly right on whisper number that actually printed at half consensus and any strange, overly dovish comments to come are all about the $USD as the F_E_D will have a hard time raising rates so long as the $USD is strong.

Despite this intraday 1 min negative divegrence, I suspect the $USD is going to see a near term bounce, approximately on the same timeframe as the overall broader market as the 15 min chart had already reflected and continues to and the $USD has already responded to (the positive 15 min divegrence in $USDX).

 DX 15 min positive which is about the same timeframes shown last Thursday for a market / Index future bounce (7-15 min, same as the market averages at 15 min)...

The I suspect lower prices in the $USD.
 Daily $USD chart with the first serious negative divegrence since it has made its strong run higher.

A closer look at the same daily $USDX chart from above shows a similar "triangle" like price pattern, in line with the market.

Wonder why the market and $USD have taken a ride up higher together despite the $USD legacy arbitrage correlation and why a break in the $USD will have severe consequences for the broad market? HINT: I have long maintained my belief that the Yen would rally as the market breaks to a primary bear market and the charts seem to agree...
Yen daily 3C chart not only showing a positive divegrence, but a trend change from down in price to lateral like a stage 1 base.

Why?

$9 TRILLION $USD'S IN $USD-BASED CARRY TRADE THAT HAVE TO BE UNWOUND! 

Picking up where we left off Thursday...

The Futures market (Index Futures) were open for 45 minutes after payrolls came out Friday and the initial reaction was not good in futures...
Interestingly today's cash market saw that bad data as well as additional bad data this morning as being good. This was obviously the market's perception of the bad Jobs number delaying an expected June Rate Hike. The more you look at this entire event over the past week, the more it stinks; with a wild whisper number seeing the actual print coming in even lower and no protection bid Friday, but rather sold. I think we can safely assume there was a leak of the Jobs data from Friday morning as we had suspected earlier in the week and certainly by Thursday.

In addition, as of our analysis Thursday we had 15 min positive divergences in the averages (although short in duration) as well as 7-15 min positives in Index futures. From there and after looking at a broad watchlist of assets and seeing similar patterns, it wasn't hard to come up with a working theory/forecast,  IMPORTANT: AAPL Set-up & Market Movement which maybe isn't exactly as suspected, but it was darn close enough to the forecast for this week based on bad Jobs data Friday morning, something Wall St. apparently wanted us to know, so be careful as they don't let on anything they don't want you to know and they are not there to make YOU money!

As also noted in the Daily Wrap Thursday, we did have some Dominant P/V relationships that would normally indicate a near term overbought condition was brewing, but as I specifically said, "Normally I would call this a 1-day overbought condition, but because of the small daily gain, it doesn't feel that way"

As long as you understand the basic premise of our near term forecast as laid out in IMPORTANT: AAPL Set-up & Market Movement, then I don't think, "What already happened" is of much interest beyond what looks like clear inside information that made its way from Wall St. to main street last week.

Signals (3C and Leading Indicators) which were weak most of last week, especially around Tuesday/Wednesday sure picked up today as I had also suspected in the Daily Wrap. These periods of "Blah" signals don't last long, but looking back at the market action, I'm glad they were doing their job and not telling us anything beyond what we needed to know for the near term forecast as most positions that many of you are considering would have been horrible entries or at least ill-timed unless you wanted to go long a trade which some people may have, it certainly isn't my cup of tea right now all things considered (lack of strong signals last week for a long TRADE).

Moving forward, if you didn't get long Thursday for what I'd consider a trade that requires you be very nimble and probably will have a lot more risk than reward, then patience and letting the trade come to you is still as it has been during this triangle area, the best approach in my view. I don't see a great reason to introduce unnecessary risk at this point with what looks like fantastic openings now starting set ups. This was the very trend I noted Thursday as I went through many stocks in my watchlist and what was the final piece in putting together the IMPORTANT: AAPL Set-up & Market Movement post/forecast.

There were still a lot of strange events today beyond the Payrolls coming in less than half of consensus (Friday morning) with protection being sold rather than bid Thursday. There was a flash crash in the most liquid FX pair, EUR/USD toward the last hour of trade today...
 EUR/USD, the most liquid FX pair in the world sees a flash crash the last hour of the day, nearly bringing it back down to the levels seen just after Payrolls Friday.

A bit odd to see this pair acting like a low liquidity asset.

However by the same token, USD/JPY nearly regained all of the post NFP losses from the Friday morning session and since the start of the new week's trade Sunday.
USD/JPY round-tripping.

This was not a correlation to ES today, although it made a similar roundtrip from bad news is bad news on Friday with no one interested in protection Thursday to bad news and even more bad news is good news today with no reason to have bought protection Thursday,  unless you maybe knew what the print was going to be and as I said Thursday, that the market would likely take it well as the perception is that it increases the probability of the F_O_M_C putting off a June Rate Hike. *Please note my use of the word, "Perception", it is important as it is what moves the market, but it's not necessarily reality. I think we got a strange dose of that today with the Philly F_E_D all but saying the BLS employment data is such garbage that they aren't even going to post it on their website, although there may have been ulterior motives if the rest of the market thinks like most of us and suspect the NFP was leaked in advance.

Come on! 245k gain was consensus, the Whisper number was around 150k and the print was some 25,000 less than the Whisper number and half consensus!!!!

Sector performance was pretty good all around today, 9 of 9 S&P sectors closed green with Energy leading at +1.80% and Health Care lagging at +.15%. Of the 238 Morningstar Groups, a strong 205 of 238 closed green.

Thursday it was very obvious that internals were not showing any strong 1-day bias, they weren't oversold or overbought. With today's sector performance, I would say that the daily candlesticks on the averages above showing a bullish engulfing confirmation candle are right on and while sector performance could be interpreted as being a bit on the overbought side near term, you can't look at it in a vacuum.

When adding in the Dominant Price/Volume Relationship for the component stocks of each of the major averages, they all (except the Russell 2000 AGAIN!) show the same Dominant relationship. There were 16 Dow stocks, 58 NDX100 and 233 SPX500 stocks all Dominant in the Close Up / Volume Up relationship, this is dominant as there are 4 possible relationships and it also is the most bullish (near term) of the 4 relationships, so the daily candlesticks' engulfing (bullish) close today makes sense.

Sometimes we do get an ironic pullback the next day off this relationship, but all in all it looks like we are early in the move anticipated in the forecast post linked above from last week. This does not change the fact that the 3C charts intraday started with negative signals almost immediately and kept it up all day.

The poorest performer (surprise, surprise) on the day among the averages was transports...
The major averages intraday with Transports in salmon.

Bio-Techs were also a bit of a laggard today with XBI coming in at -.30% on the day. Gold was up on the day, but that seems to be because of the Goldman Sachs research note conducted on the F_E_D's own FRB/US Reality Simulator in which they not only argued for lower rates for longer, but that it's hard to be "Reasonably confident" in the inflation outlook, which is one of the F_E_d's ambiguity statements in which they'll hike before inflation moves toward their long run 2% target as long as they are "Reasonably confident" that it will.

As such, inflation sensitive Gold popped likely on the Goldman note regarding inflation. Significant divergences in gold suggesting a swing lower are still alive and well.

Among our Leading Indicators,  one of the things I was going to be looking for this week on a breakout from the triangles (which I believe and gave solid evidence to my opinion, that they'll be head fake/false or failed breakouts) was deteriorating Leading Indicators.

My very first Leading Indicator on my screen, the SPX:RUT Ratio which started showing a tiny bit of weakness late Thursday, was nearly inverted from the SPX today, showing that the anticipated Leading Indicator decline and signals seems to be taking place early on just like the 3C distribution charts intraday that saw some make it as far as 10-min negatives in a single day.

Interestingly this indicator has been leading positive recently in to the averages' apex of their triangles, today however it looks like I inverted one of the charts as there was non-confirmation of the market's move today, which would suggest to me that we probably have a few days left in this move as today was a bullish reversal confirmation as well as a volatility breakout as expected, in fact the biggest open to close range since Yellen back in December-nearly 5 months! If Leading Indicators like this keep moving as I had anticipated in Thursday's post on a directional breakout and increased upside volatility out of the triangles (as the apexes were mature), then we might have something similar to...

 SPY triangle as of Thursday's close with expected increase in upside volatility...Remember one of the most important things we have been looking for to indicate a larger stage 4 decline is a rise in volatility,  thus the triangles were a very important discovery and forecast.

Today's SPY close with the confirmation engulfing candle and forgive my poor drawing of additional candles, but another day or so up, which gives us the set up we have been waiting for as well as a chance for leading indicators to give strong signals. I essentially posted another green day, a yellow day representing something like a star or Doji (loss of momentum) and a bearish confirmation/engulfing candle. This is not a specific forecast, but a rough example of near term expectations and what "should" happen in Leading Indicators as is already happening in the SPX:RUT ratio with non-confirmation and bad today (as well as 3C negative divergences showing distribution so early in to the move which is why I drew a shorter swing).

Additional Leading Indicators...
  While HYG is severely dislocated on a primary trend basis and in a bear market calling for significant catch down in the SPX's primary trend, near term it is used as one of the first "go-to" ramping levers and was nearly in perfect correlation with the SPX today. When this turns (price, not 3C which is a head's up telling us a turn is coming), we'll have the Leading Indication I'm looking for as described Thursday for this move.
 HYG 3 min leading negative intraday already seeing deterioration...

HYG 3 min trend which is in a leading negative position, but these are just near term, the clincher is on a daily or multi-hour chart...
2 hour HYG leading negative on a primary trend basis, not just price (which you should check out and compare to the SPX if you have the ability or haven't seen it here before), but in 3C with a new leading negative low in place.

 Our Pro-Sentiment Indicator which has been in line recently with the market is showing early signs of deterioration in to this afternoon, this is much faster than some of the cycles we have seen previously like the February cycle.

Giving additional evidence to early Leading Indicator deterioration are the VIX futures and related VIX assets.
 As I mentioned Thursday and just above, I found it strange that VIX protection wasn't bid in to a 3-day weekend alone, much less the Jobs report on Friday with the cash market closed and only 45 minutes of futures trade available after the print at 8:30 a.m. However, that weakness seen on the inverted SPX (price) chart above which allows you to see the relative performance of VIX short term futures (blue) from Thursday was in line today showing that there was improvement in the move toward protection. I'm not very impressed with this chart on its own, but add spot VIX below...

 Spot VIX weakness/under-performance Thursday and out-performance vs the inverted SPX (green) today.

However the real clincher was the initial signs during the cash market in actual VIX Futures below...
This is the intraday 3C chart of VIX futures with a positive divegrence building in protection while the risk assets like the averages saw migration of a negative divegrence out to 5 and even 10 minute charts in a single day. This kind of confirmation makes sense with the 3C signals seen today in the averages, IT DIDN'T MAKE MUCH SENSE ON THURSDAY UNLESS SOMEONE ALREADY KNEW THE OUTCOME WHICH IS WHAT I SPECULATED MID-WEEK LAST WEEK.

Here are the intraday and important trend signals in VXX.
 VXX 3 min intraday,  this is not a signal to buy, just as the 3C negatives in the averages are not a signal to sell short, it is a signal of the underlying process that started on today's move. Remember, there was no accumulation Thursday when you'd think they'd want it the most unless they knew something in advance on a NFP leak which seems likely not just by the strangeness of the print, but by actual trades seconds before the NFP printed.

 Just as migration of the negative divergences took place in the averages, see SPY below intraday), this 3 min VXX chart is leading positive. Again, not a buy signal, but an indication that things are moving in the anticipated/forecasted direction with the forecasted end result.

As you already saw intraday, the SPY negative divegrence in to higher prices as it appears, as forecasted, higher prices above the triangle would be distributed. This is also good multiple asset confirmation considering these are examples of a risk on (SPY) asset and a risk off/protection (VXX) asset and they are showing exactly the opposite intraday signals today. In other words, the process of rotating out of risk at higher prices and in to protection at lower prices looks to have a good start on the first day.


As for the longer term strategic view, the 30 min VXX leading positive divegrence which would be similar in confirmation to on the SPY 30 min (strategic) chart...

SPY 30 min. These are not only good multiple asset and multiple timeframe confirmation signals, but also are good signals telling us what the highest probability resolution is for smaller moves like the one started today, which is why we let the trade come to us when we know what the probabilities of the resolution are and trade WITH THEM.

Yields generally gained intraday after dropping lower since Thursday's close putting them right about the same area, although the SPX is a bit higher. Intraday this looks like market support, but between the two days it looks like this is a pump/false breakout and leading indicators are starting to show signs of it early on.

I think what will likely happen is that we'll see the 15 min 3C charts start to deteriorate and Leading Indicators should be giving strong, unambiguous signals by then,  that's when I want to take advantage of the "come to us" trade, rather than getting greedy and either chasing risk or entering too early afraid to miss the trade. We haven't had strong signals until Thursday for a reason looking back at market performance, we'll have the signals we need, so again I urge patience.

The process looks to already be under way, I doubt we'll be surprised by missing a downside move, the signals should all be there and strong, that has been how this market has been operating more and more since QE ended.

As for Index futures tonight, they look to be reasonably in line, there are some slight divergences that I'll check on later, but I think this triangle based bounce plays out as was our forecast for the week from last Thursday. I'll be watching for HYG to continue to deteriorate, VIX futures to continue to gain and the averages to deteriorate to the 15 min chart which is their "Gas in the tank" level.

The same is essentially true of Index futures (7-15 min positive charts last week in to this week).

Just let the process play out, we got a much bigger than anticipated start today in the averages and even confirming assets (HYG, VXX, VIX Futures, AAPL, etc.).

I know the market has been tough in this triangle-shaped lateral zone as mentioned last week in IMPORTANT: AAPL Set-up & Market Movement, the move in AAPL over almost 7 trading weeks has been +0.03%, a pretty tough environment, but also not the one you want to get caught on the wrong side of considering the potential gains and potential risk or even from an open risk or opportunity cost basis, from the linked post above on last Thursday, AAPL...


AAPL has moved EXACTLY 0.03%, less than 3/10ths of a percent, for all intents and purposes over the last nearly the last SEVEN TRADING WEEKS, AAPL HAS NOT MOVED AT ALL!"

I'll check on futures before turning in, but I expect our near term forecast to hold and the process to unfold, although it may be faster than normal, we still need to let the market tell us.

Have a great night!

AAPL & Market Proxy Update

Thursday I posted quite a long bit of analysis after looking at a number of stocks, Index futures, the averages, etc. and there were a few things in common. One was the promise of volatility and a directional breakout.

"What is a triangle when it comes to volatility? It's like a Bollinger Band squeeze in which the ATR might be getting more volatile on an individual day, but the range in the market is squeezing like a Bollinger band pinch, which is THE PROMISE OF A HIGHLY DIRECTIONAL INCREASE IN VOLATILITY."

 I won't get in to what we forecasted as it was easy just based on the concepts of the market using technical analysis against traders as traders are too predictable, but as of that analysis Thursday here, IMPORTANT: AAPL Set-up & Market Movement I showed a few things like AAPL's triangle and the "Promise of volatility" which has been a major theme we have been looking for and finding intraday (ATRs).

 As of Thursday at the white arrow, this was the triangle and the comparisons I made to a Bollinger Band pinch being the promise of increasing volatility.  I made a case for the Non-Farm Payrolls print to come in below consensus, it came in at less than HALF of consensus and why and the upside breakout in AAPL and why it would make this move. Today you can clearly see the breakout we were expecting, but this is a proxy for broader market implications.

I showed the highest probability resolution of AAPL (4 hour charts)

Just as with the broad market and here you can see with Index futures (ES/SPX E-mini Futures) the distribution in to the breakout, even though we didn't get an extremely dovish statement from some F_E_D member, we did from Goldman Sachs and PERCEPTION is what counts, a neophyte trader can put together "Bad NFP Print=Rate Hike Delay), at least that's the perception and that's all that really counts.

Just like the broad market averages today on their foray in to green and green on the year for some... ES / SPX futures is showing the same intraday distribution in to market strength as the averages and as forecasted.

Just like the averages or Index futures shown Thursday in the 7-15 min timeframes, AAPL has the same 15 min positive, as well as the same trend in intraday charts showing these triangles WERE NOT COINCIDENTAL as well as why...
 AAPL 15 min positive right at the tip or apex of its triangle ...

As for AAPL which made a much cleaner, more obvious breakout in a widely watched stock, the intraday action thus far would not have me moving to call this a short entry. However intraday it is moving in the direction forecasted and the direction we have already seen earlier today on 3C charts of the averages as AAPL was used as a proxy example for the broader market Thursday (see last update) as expected in our near term forecast, IMPORTANT: AAPL Set-up & Market Movement

 AAPL 1 min already seeing early negative divergences which typically will see confirmation for the first few days, suggesting this may be a faster move than a few days of upside. On the flip side of the coin,  you will see below there is strong data to suggest it is more than just a single day which is why I'm not calling out positions yet unless you were playing this on the long side, which I'm not fond of as you know, I simply think there's too much risk vs. potential reward, especially when we know with a fairly high degree of certainty that the "Come to us" trade is a much stronger set up.


 AAPL 2 min migration

AAPL 5 min migration, but I wouldn't try to make a case much beyond that in AAPL any way.

As for the averages... I didn't include every divergence in every timeframe, but posted charts of about how far they went within reason without stretching the divergence or torturing the chart.

As for the evidence I said that suggested this is more than just a 1-day event, well I think that was plain from our week ahead forecast using AAPL as the market proxy on Thursday, but just to show you why I would not consider this a high probability put/short entry area from a tactical basis...

 This is the NASDAQ 100 daily chart. You may recall the bottom/bullish reversal daily candle last Wednesday, a "Hammer" which can be seen with a white arrow below it; this is one of the reasons I think we were close to an upside move given  we had that strong upside reversal candle and a pinching set of triangles at their apex.

While not the best example of a Harami or inside day, Thursday's narrow range (open to close) Doji Star fell within the real body of Wednesday's hammer, another bullish reversal candlestick signal, although far from textbook, which suits our purposes just fine.

Finally today is a bullish engulfing candle as its real body engulfs all of Thursday's daily candle. This would be a confirmation candle, confirming the previous Hammer/Harami reversal candles.

Intraday divergences...
 I don't think I need to draw on most of these charts as the divergences are quite clear. The typical rounding top intraday was also interesting as there wasn't a bunch of chop and most of the action was early in the day as the TICK charts display.

As I said, I didn't put every chart, but this 3 min DIA is leading negative, the intraday lows had a nice positive that sent it higher. The 2 min chart forms a nice bridge or connection from the 1 min to the 3 min and shows the process of migration of a divergence which means as it gets stronger it migrates to longer timeframe charts.

Here the 5 min DIA also shows the early bounce off the opening lows and leads negative intraday. 5 min charts on an intraday basis are what I consider to be the demarcation line between the 1-3 min intraday steering/timing charts and the institutional distribution (or put more simply, I'd consider the 1-3 min charts to be the signs of market makers/specialists or other middle men/HFTs performing that function, while a 5 min chart is a more serious signal intraday, much more than the simple 2 min difference would imply).

 DIA 10 min is one of the few cases in which I feel that the chart is strong enough to post it as a distribution event,  this would mean that there was actually quite a strong distribution process and like past bounces over the last 5 or 6 weeks, distribution is starting immediately rather than showing the typical confirmation of a stage 2 mark -up scenario for several days before distribution starts like we have seen in the not so distant past.

 QQQ 1 min has a very sharp leading negative divegrence. If we had not anticipated a triangle/breakout event last week, I would expect a divergence like this to turn the market south intraday, but in this case it is a distribution process which is also evidenced by the migration of the divergence to longer term timeframes.

 QQQ 5 min which is marked to show today's action only to the right.

SPY Daily, like the NASDAQ 100 daily chart also showing the hammer support (several averages showed it right at their 100-day moving averages last week as was pointed out) followed by a Star indecision candle (not as strong as the NASDAQ's Harami-like pattern) and today's confirmation bullish engulfing candle.

 SPY intraday 1 min

This is very much like the ES 1 min chart above. As well as the 7-15 min positive Index futures were showing the same thing as the 10-15 min averages in last week's updates.

 SPY 2 min not shown, 3 min leading negative above. It seems in many ways SPY saw some of the strongest distribution activity today.

SPY 5 min which is leading negative, but I won't go any further and claim credibility, although if the process keeps up at this pace, I'd imagine we'd be looking at 10 min charts with negative divergences tomorrow and soon after the 15 min charts that need to turn south before we look at entering any broad market correlated shorts or puts.

IWM is a bit on a lone wolf, it has a weaker base foundation, it has a weaker overall positive divegrence, it doesn't have the same apex type price pattern, as you know it has not had very many Dominant P/V relationships compared to the other averages or even the historical norm. It does have a late day intraday positive on the 1 min chart suggesting more upside early tomorrow or at least starting nearly tomorrow, which is a bit different than most of the other averages.

I'll have more for you as I warp up going through charts, but this is the move anticipated, strangely we even got the likely leaked Non-Farm Payrolls as anticipated, as far as the super dovish, "Talk the dollar down" event, not quite. However it may very well be that the Payrolls data was so bad as well as the additional macro data today that the implication on F_E_D rate hike policy is simply assumed without the need for further elaboration or commentary from a F_E_D member.

I believe that a lot of this is more $USD related and it dumped on the Friday Payrolls data, but has recouped most of that today, so whether we hear from a F_E_D member on the issue or not may have to do with how the $USD performs near term. 

We also had an interesting twist with the Philly F_E_D all but saying the BLS employment data is worthless, not even worth their time to post on their website, which should become more clear as we move forward, but as I hinted earlier today, this has been a pattern with the F_E_D running right up in to the start of removing accommodative policy and no matter what may be said in coming days or weeks, I think we all have a pretty good idea what it's really about.


Market Update, Continued Deterioration

As of Thursday's forecast post, IMPORTANT: AAPL Set-up & Market Movement, as you know there were many things that were open questions that needed to happen and amazingly some have like the Payrolls Friday, however as you may recall, it was based on triangles in AAPL, in the major averages, in many other assets and this was the very near term expected outcome (it's too much to recap here, please read the post)...

We've seen some of those start to break out from the triangle's apex already like AAPL, others have not like SPY, but the one constant today, despite the 15 min chart in SPY and other averages (except IWM) which supported our near term forecast as linked above, has been intraday deterioration all day. The same "selling in to price strength we have been looking at to get a nice position set-up with low risk and high probabilities rather than the recent tighter and tighter chop on a daily chart.


 SPY 15 min and several smaller and possibly larger "W" bases, but it's the recent short term (about 2-day) 15 min leading positive divegrence that was the glue in the near term forecast of a break above the triangle's apex with additional conditions like the NFP printing below ,consensus as it did and likely a F_E_D member making a VERY dovish statement.


While the 15 min chart there and in most other averages is still intact, we are seeing migration of today's negative divegrence build and build through the day. This is why I keep saying "I would not chase this long unless you are specifically set up as that kind of trader, there's too much risk considering the potential reward".

The DIA intraday and this goes from 1-10 minute charts , I just can't fit them all and get this out in a timely fashion.

 DIA 1 min, 2 min and the above 3 min all negative and as you can see, the divergence is migrating to longer timeframes showing it is gathering strength as a negative divegrence in to higher prices intraday.

Here the 5 min chart is leading negative intraday which is a serious signal on an intraday chart and also further migration or strengthening of the divergence (negative today).

Even the 10 min chart which was closer to in line near term is showing intraday deterioration.

It has been the 15 min charts where we have found strength, again see Thursday's post and forecast which included the same timeframes in Index futures confirming the same divegrence above (7-15 min).

The IWM was the sole standout. Intraday it looks a bit better, but on a larger basis, it has a weaker looking base and the 15 min chart compared to all of the other averages looks like this...

 IWM 15 min now double base/bottom and leading negative as it has been since last week.

QQQ 1 min intraday weven worse...

2 min QQQ migration...

Remember 3 min is about where we were in line, now leading negative with a stronger divergence (migration). The above is a 5 min chart leading negative.


 The 15 min positive of about 2 days (short time period) which was in line with Index futures in the same timeframe shown last week, but the way things are moving so fast today and the divegrence (negative) is strengthening, we may see deterioration here before long which would fit our scenario as well.


SPY 1 min and 2 min above leading negative even worse then earlier.

 SPY 3 min leading negative/migration of the divegrence to stronger timeframes.

5 min SPY and you saw the 15 min above.

TICK has been flat all day since this morning's early run.

I see we are just getting some downside now... I'll update you on what happens, I am loathe to trust this market on the upside near term without being EXTREMELY nimble.