Thursday, August 23, 2012

FB Was Productive Today

It may not have seemed like much, but when a stock pulls back in to accumulation, they are building a position as we have suspected for the second time in FB, since the start of August.

 FB accumulation in to the afternoon dip.

The 15 min chart is already at all time leading positive highs, it just added some more today.

I'm already at full position size in the equities portfolio, I may consider some calls if the set up looks right, kind of like last time.

AAPL Charts

This is one rotten AAPL...

This still could lead to a Crazy Ivan shakeout, I'll have to look at a lot more assets in to the close to see if we can get a "part 2" tomorrow that will give us something to short in to.

With 3C when all the timeframes are moving together, especially after a head fake move such as AAPL has already put in, it's very strong probability a big turn is near. When the longer charts from 5 min to 15 and really 30 min start moving a lot in one day, there are some big institutional transactions going down, AAPL exhibited all of this today. I warned about this yesterday, there are a lot of hedge funds holding AAPL and only 1 door, when it starts to shut, things will get ugly quick.

 1 min

 2 min

 3 min

 5 min

 10 min-HORIBLE!!!

 15 min

30 min-HORRIBLE

Couldn't get AAPL Off in Time

I look at it like this, if I already have a position there then there's got to be an incentive, a better position is an incentive, I really was surprised by how bad it looked going in to the close, apparently on the stream there were quite a few retail buyers today so that probably explains that.

I'll post some of the closing charts for AAPL and other.

All in all though, I took care of repositioning already and have just been making tweaks here and there.

Adding VERY Small AAPL Put

I want it into strength so this will be small and hopefully we get 1 last move in to strength, but 3C looks horrible.

AAPL Update

AAPL's triangle breakout's underlying trade is looking pretty bad.

I will only add to AAPL if it breaks out and gives me a reason to add (better positioning), otherwise I'll stick with what I have.

Below, AAPL's 1, 2, 3, 5, and 10 min timeframes are all leading negative at the triangle.


Risk Asset Layout looks good

I just took a quick look at the Risk Asset Layout and it looks good, it has the feel of the same short term  "bait" and big picture "trap door".

For example...

Currencies

 The Euro has some strength or you could say the dollar has some weakness, short term this is a benefit to the market, however the more important currency that has proven to be a leading indicator, the $AUD, looks like this...

 In line with market weakness, but longer term and this is where it shines because it is a carry trade currency...

 Dislocated or divergent from the SPX, which it hasn't been until what you see on this chart, it has looked like this on the last 3 major market reversals as well.

 Yields are like a magnet for equities, so intraday this isn't surprising, if the market can lift at all here it would be great, because look at the bigger picture.

Yields are divergent too and leading divergent, these have also been this way over the last 3 major reversals.

So things are fitting together a bit better today than yesterday.

"IF" the market can swing it, these would be my two targets for very near term, like tomorrow.

Each accomplishes something for the longs that keeps them hopeful and locked in, a higher high above the first level or a higher high above the second, either one will work. We just need to watch what the underlying trade does in to any move.

AAPL / Market Update

I still want to see how the signals progress in to price strength and make sure we get some, I also want to check the Risk Asset Layout, but from looking at the volatility ETFs, VXX and UVXY as well as TLT / Treasuries, the flight to safety trade, things are starting to make more sense. There are very short term negative divergences there that fit with the short term positives in the market, at 5 mins, where it really counts, its a brick wall, that tells me the probabilities are VERY high that it is not only safe to short in to strength, but it may be the last chance we get.

That being the case, I think AAPL breaks out of the intraday triangle, it is also a perfect head fake set up on a intraday timeframe, after all a reversal has to start somewhere and AAPL is already in a head fake area on a daily timeframe. I told you Wall Street isn't going to make this easy, but you catch the right day like we did with BIDU, it is very profitable, otherwise they are going to want to keep everyone guessing as they slow boil the frog if you are familiar with that phrase.

 Here;s the triangle in AAPL on a 15 min chart, note both the lower and upper boundries were set by tweezer top and bottom candlesticks, volume is correct for the formation and I would bet 95% that this is not a coicidental triangle.

  A symmetrical triangle carries no directional bias with it, it ll depends on the preceding trend which in this case was clearly up, that makes the triangle a bullish consolidation continuation pattern, technical traders expect it to follow the green arrows, this is where Wall Street will game them. Most probably an upside breakout because that is most advantageous to Wall Street to sell/short strength and lock in more longs, but thy could surprise with a downside move instead or even a Crazy Ivan shakeout (both ways). I'd look for the upside breakout though. THIS IS WAY TOO OBVIOUS NOT TO PLAY.

 I didn't include the 60 min because I wasn't going to make this a long post, but the 60 min is negative, the 30 min above is clearly negative in a relative and leading way.

 The 30 min close up at the triangle area, bulls WILL buy the bullish triangle, but more will buy confirmation of the breakout, it appears those who were willing to buy the triangle saw their shares come from distributed or shares sold short from money smarter than they.

 The 5 min chart is very clearly leading negative here.

 The trend of th 5 min chart is interesting too, right before a breakout above resistance, there's a quick accumulation zone (power up for the breakout) and then the move which is trending down through th entire thing. There are a LOT of hedge funds with large positions in AAPL, it is not n easy stock to distribute without driving price down, so what is needed is demand and higher prices, that comes with things like a breakout to a new high.

 This didn't come out in order, but the 10 min chart i also leading negative at the triangle like the 30 min chart. If the 30 min chart is negative at a triangle this small, it would suggest there's a lot of institutional activity.

Finally the 2 min, leading negative at the triangle.

I probably don't have room for more positions in AAPL, but I think I'll look at taking one any way when I feel the time is as good as it gets.

There goes SPY $140.80

This is where we can learn something about the underlying tone of the market, the more upside momentum we can get, the better. This is also what I would consider very fertile ground for selling longs in to any price strength and selling short in to price strength, I know it goes against all emotions, but you get a better entry and you have less risk.

I'm updating AAPL next, as a market Bellwether it seems to have a message for us, this is one I would definitely sell/short in to strength.

USO Update

I was asked by a member about USO just a little bit ago, as yo might remember I have an open Put position in USO as well as a full-size equity short position.

This was my initial response to the move in USO today:

" I wouldn't be surprised to see a little upside relief as the move down was very parabolic, but the timefrmes are all pretty negative so I think this is a good start to some decent downside, I'd be careful not to get shaken out on any corrective moves."

Here are the charts, to me this looks like a pivotal moment for USO, it also looks like a decent area to consider adding or initiating a short position in USO, the equity short in the model portfolio is only down about 2% from here. We'll look at the full picture here.

 The daily chart with a bearish triangle that traders expected to follow the red arrows, instead it created a head fake bear trap and moved higher. There's an area of local resistance and an area a little higher of long term resistance, USO is above both here.

 This is the move down today, a little too parabolic so it's not surprising to see that it bounced off a relative divergence.

 Here are the areas of support, that's a Wilder's RSI at the bottom

 Here you get a better feel for the parabolic nature of the move, I never trust these up or down and right below support it bounced intraday.

 This is the long term simple picture, negative at the top with a move above resistance that saw distribution, the head fake move at the bottom that was accumulated as the shorts entered, and a negative divergence here. The divergences aren't sharp because this is a 4 hour chart, it shows the broad strokes.

 An hourly chart has more detail, you can see the accumulation of the head fake move down, shorts provided the supply to accumulate, a break above resistance and longs provide the demand to distribute in to.

 The 30 min chart's divergences are much more sharp, you can see leading negative as resistance levels were crossed.

 The 15 min chart even sharper, again, leading negative, this is part of the reason I opened a full size equity short position in the equities model portfolio.

 Remember the market wide accumulation on Aug 2nd, here it is again, the 5 min chart gave a pretty good timing signal as USO gapped up above the resistance levels.

Here's the 2 min chart again a good timing signal as that gap up was sold in to and created a leading negative divergence. I'm set for USO, although I might consider adding a Put if we get some price strength with continued neg. divergences, but if you like the idea, it's still in a very good position with high probabilities and low risk.

SPY $140.80 is the level to watch

Market Update

This looks as good as any place to start a correction to the upside. The downside move is too obvious and the bulls are going to start losing hope if something isn't done soon.

As with the last update, the bigger picture is solidly bearish, we are talking about a correction when we talk about upside, so strategically we have a bearish outlook, tactically there may be some price strength to short in to with underlying market weakness.


I have to admit as a lifelong student of the market, yesterday's signals were strange, the positives and then how they just deteriorated in to the end of day and we gapped down this a.m., yet they still are there. The other strange bit is the lack of confirmation, I think we are going to learn something new about Wall Street here, it almost seems like we have two different camps, 1) wants to bounce the market and most likely sell in to that price strength or more likely short at this point and another that seems to just want to get out no matter what.

 Again, the DIA 1 min with yesterday's strength or positive divergence that turned negative almost as quickly or faster. Right now it's close to in line on the day, but a tad more negative.


 Divergences on longer timeframes do accrue and that appears to be what we see here on the 5 min DIA, this could be a pretty decent bounce with a leading positive out to 5 minutes so be patient before just shorting any price strength. Remember, there's almost always a reason for what they do and that is why we tend to see extreme moves rather than just overbought/oversold tension relievers.

 The 60 min DIA chart has immense damage done to it, not only does it really start showing at the head fake move, but for a 60 min chart to lead almost vertical with no interruptions that deep, that fast is massive damage to the underlying issue.

 IWM still the strongest looking, 2 min chart, this is a leading positive divergence, this should generate a decent move to the upside, but always remember that price is deceiving, as Cramer said in the rare video that I posted (and this is probably as straight as you'll ever hear it about the reality of Wall St.), "Never do anything that even remotely resembles the truth", "Create a new fiction".

 Oddly, like the DIA, the IWM 1 min is almost perfectly in line with price. This is what I mean about "Strange".

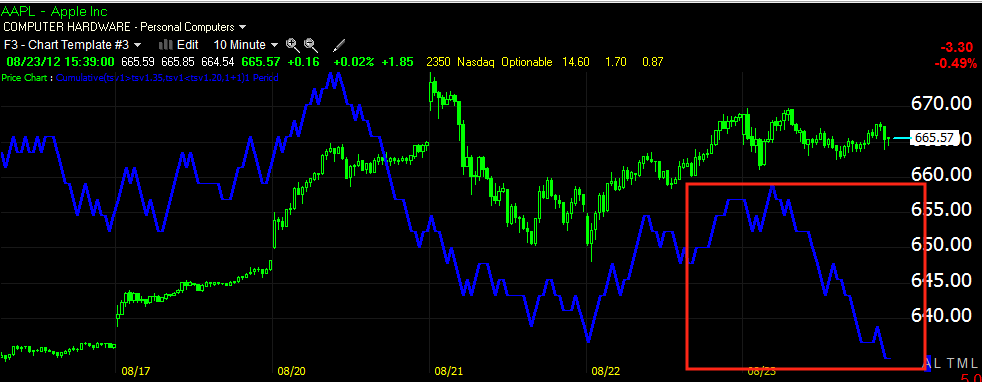
 QQQ from yesterday's positive divergence on a 2 min chart has added to that today, we have a leading positive. AAPL now represents 19.8% of the NASDAQ 100, last time I figured out the wighting, it was similar, which meant that AAPL had the same weight as the bottom 50 NASDAQ 100 stocks combined. So if we had a theoretical NASDAQ 51 comprised of the bottom 50 stocks and AAPL and all 50 stocks were down 2% on the day and AAPL was up 3% on the day, the NASDAQ 51 would close up +1% even though 50 of 51 stocks were down 2%. That gives you some idea of how the averages are moved with such horrible Advance / Decline lines.


 QQQ 5 min is NOT seeing any strength from the 2 min chart bleed over so while strong on that timeframe, where it is more important, there's no strength there, in fact it's pretty close to inline, I'd watch this for deterioration in to any move up.

 SPY 1 min showing a positive today, look at that little break below support, it's bigger now, but remember that reversals are preceded by head fake moves at least 80% of the time and on all timeframes, this may very well be such a move.

Bigger picture, the 5 min is seeing no strength migrate through so we are still bearish, just looking like we'll see a short term move to the upside shortly.

I'm going to check around some more and see what else can be found.

ES Update

Like the positives (all short term) in many of the averages, we have a positive in ES 1 min now, the S&P E-mini futures, so I feel pretty confident we'll get a move up, ho long, how far? I can't say that, but they don't usually run a move unless it fulfills a specific purpose, in this case the buy the dip crowd are getting nervous and need some price confirmation to keep them long before the floor is dropped out from below them, as I said, Wall St. will probably have to throw them a bone to keep them in place.

ES seems to agree

If you are very nimble, you can probably play an upside move, remember Reg T about day trading, for me I'm more inclined to be patient and wait to see where the shorts and put set up.

BIDU Follow Up

A mentioned, only the options positions are closed in BIDU for some nice profits, the core short in the equity model portfolio is open and will remain so as it was shorted in the $150 area and recently added to. I don't mind sitting out corrections in the core positions, but with options, I have little tolerance for corrections as we can close the position and re-open it when the correction is done and make more money as the time decay makes the current position worth less. I ALWAYS want to spend the least amount of time possible in leveraged (especially options) positions. The equity BIDU short is doing great.

Here's what I see both big picture and near term... This tells me something about the market too.

First of all, these textbook Technical traders keep doing the same silly stuff over and over again, note the obvious support levels, they put their stops right at support and place the orders with their brokers, so not that we couldn't guess where the stops were, but we don't even need to, we and especially Wall Street can see how many are piled up at those exact levels, think volume rebates! Every obvious sop is hit and short sellers place their orders there too, chasing the trade instead of letting it come to you.

Now that volume rebate money has been made, the Market Maker is probably stuck with some BIDU inventory they'd like to offload, remember if there' no match for your order at market (it happens in a fast moving market), by law the Market Marker (because this is NASDAQ) or the Specialist on NYSE are OBLIGATED BY LAW to provide a bid/ask as long as it's at market. So the Market Maker was able to accumulate or forced to accumulate a lot of BIDU in a stock that is a sining ship, they probably want to off load that inventory so they'll need to create some upside excitement to do that or DEMAND.


 Bigger Picture BIDU's 15 min chart, a key timeframe just went leading negative as soon as BIDU entered the flat trading range (easy to fill institutional orders at the VWAP in a flat range) and especially at the had fake high which was a break above local resistance that trader would have bought allowing smart money to sell in to demand and better prices.

 Even bigger picture, the first negative divergence to the left is where we first entered the BIDU core shorts on price strength and a head fake bull trap breakout, this 60 min (very important timeframe) was in line with the downtrend until another head fake bear trap was set at the lows, we entered BIDU long there with options as we were looking for a counter trend rally and we got it, BIDU retraced 50%, then another negative divergence in to the recent top, look at the leading negative move in 3C as the head-fake breakout in yellow occurred, remember what we say, "From failed moves come fast moves" and that failed breakout produced a fast move to the downside, we have members up 250% in Puts!!! I was only up 102% in 3 days, I think I have somethings to learn.


Now the short term trend... Because Nothing goes straight up or down.
 The 2 min intraday chart, not an influential big picture timeframe, but excellent for near term moves, this is leading positive in to the selling.

 The 3 min negative at the head fake breakout, but leading positive as the stops are hit.

Finally the 15 min, negative at the head fake breakout and a slight relative positive, I question if this is a real divergence or the 15 min just hasn't caught up with fast moving price, there's no turn up so I'm going to say we do NOT have a positive 15 min, but still, this could be a pretty decent move up. We could play it long, but I want to trade on the side of probabilities which means I'll wait for the negative divergences to appear after  move up and then enter new put positions. For anyone wanting some BIDU, this may be your chance, just be patient.