Tuesday, November 19, 2013

Daily Wrap- Mild Insanity?

Ok, the basic theme of the day remains unchanged, very short term intraday positives today that can work for a short term (a day or less at this point) bounce and the negatives there that cap it.

Even though I showed this theme throughout numerous assets such as this post today, I'll give you a feel using the SPY, QQQ and IWM which all closed red today, even transports closed down .90% as one of the worst, however what I'm showing below may be enough for the targets of 16k, 4k and 1800 (Dow, NASDAQ Composite and the SPX closing targets yet to be reached other than intraday).

 SPY 3 min positive


15 min negative

QQQ 5 min positive

QQQ 15 min leading negative

IWM 3 min leading positive

IWM 15 min negative.

The theme is the same everywhere, short term/duration accumulation for a bounce that may hit those psych targets, but lots of damage and not much can be done about it.

The key part of the week is tomorrow at 2 p.m. and it seems F_R_D members are out trying to inoculate the market from whatever is in those minutes.

So far over $5bn of POMO did nothing yesterday, today's did nothing so my question Friday of whether QE has lost its luster is legitimate, although a few days/weeks does not make a trend.

10 and 30 year treasuries sold off today in a Taper On mode and QE off, however the 5 min charts for both had positive divergences like the market, almost exactly suggesting almost exactly the same thing, a bounce tomorrow. My question is whether this is pre-minutes or post minutes, the second may suggest the minutes were leaked. As you may recall, it wouldn't be the first time as the F_E_D sent emails out to 144 of the biggest investment banks and private equity firms disclosing the information a full day before its slated release. One may be forgiven for a simple mistake of hitting the wrong button, BUT SINCE WHEN DOES THE F_E_D HAVE A MAILING LIST TO SEND THIS INFORMATION TO THEIR BANKER BUDDIES, WHY WOULD THEY NEED IT AND HOW DO I GET ON IT- THAT'S THE DAMNING PART.

VIX futures (60 min) as well as Short term VIX futures and the spot VIX Bollinger band squeeze all seem to be leaning toward the longer term negative divegrence charts and suggesting that the move started yesterday on the downside continues shortly.

So if Treasuries are to bounce tomorrow, again this would be interesting whether it were pre or post minutes, then the question is, "What do other QE sensitive assets look like?

I have more tan enough data in gold futures to suggest a bounce which would also be QE on/Taper off just like a Treasury bounce, however we expected a pullback in Gold on Monday and a bounce from there shortly after the gap was filled (it was yesterday).
 60 min gold futures look ready for upside, GLD and GDX calls are still open.

 In GLD...well, pretty much the same. Even GDX (miners) look ready to bounce, but as I said before, we expected this well before the market action before the minutes so it may be unrelated and gold hasn't had the best correlation to QE since 2011 when we called a top.

As far as the $USD, down would be QE on/Taper off and I have no evidence that $USDX is ready or close to a bounce so all in all, most QE sensitive assets , including stocks, look set for at least a short duration bounce, HOWEVER THAT NEVER MEANS IT WON'T BE IMPRESSIVE; if it wasn't impressive, it would be useless and Wall St. doesn't do anything without a reason.

As for Credit, HYG has enough 3C support not to spoil the party, but it continues to move toward distribution and lower prices, I don't see HYG holding up well in the days and weeks ahead and that is important because, "Credit leads and equities follow", we have overwhelming evidence this is true, the credit markets are bigger, badder and way smarter, which is one of the red flags for the equity market.

As for FX, you can bring the Carry trade to the market, but you can't bring the carry trade to the market, at least not anymore. Increasingly as I have been noting, more and more of the tools used to ramp the market are not working as well if at all (Credit, Carry trades, even Central Bank jawboning)...
 The EUR/JPY  (candlesticks) vs ES (purple)... In the past it has been so easy to ramp the market overnight or even during regular hours, just drive up the EUR/JPY carry cross as you see above on this 30 min chart, but recently as I have been suggesting, things are changing...

All of the sudden ES is not ramping with the carry pairs, this is indeed a rare site that hasn't been seen in I don't know how long to this extent.

After prepared comments by Bernie were released saying:


  • BERNANKE SAYS MAIN RATE MAY BE LOW WHEN JOBLESS RATE BELOW 6.5%
  • BERNANKE SAYS MAIN RATE LIKELY LOW FOR LONG TIME AFTER QE TAPER
  • BERNANKE SAYS ECONOMY `FAR' FROM WHERE FED WANTS IT TO BE
  • BERNANKE: ‘MAY BE SOME TIME’ BEFORE POLICY AT ‘NORMAL SETTINGS’
  • BERNANKE SAYS FOMC COMMITTED TO ‘HIGHLY ACCOMMODATIVE POLICIES’
  • BERNANKE SAYS FOMC TO CONSIDER PROSPECT FOR LABOR MARKET GAINS
The EUR/JPY hit multi-year highs (about 4) and then this...
Bernie comments released at the white arrow and as new highs were hit, 3C went negative and the FX pair followed 3C's lead. If the markets still tracked the FX pair, I'd say this might not be a great sign early on.

ES futures initially bump[ed up on Bernie's comments, but have since moderated and gave up the small gains.


Everything I can see above from Bernie is that he's very concerned that the market is not too concerned about a tapering meaning rate increases, the problem is the last time taper talk was hot in May/June yields jumped hugely on their own, So Bernie is trying to tell the markets that the previous guidance of rate hikes 6 months after QE ends is not so much their view anymore or at least not what they want the market to believe. I mentioned this mess this morning in the a.m. observations and sure enough, Bernie is out pounding the desk

Also don't get "Accommodative policy" mixed up with QE, low rates like the nearly zero percent rates we've had since 2008 are in fact, ACCOMMODATIVE POLICY, although the market likes to read it as QE, those in the know, know what he's talking about, which just makes me wonder more, "What's in tomorrow's minutes?

Other than that, other indications...

The Dominant Price/Volume Relationship for the major averages is the same as last night, Price Down/Volume Down (this isn't for the averages themselves, but each of the compnent stocks in each average).

This reading is benign, it's the most common reading during a bear market and it does not suggest a 1-day oversold condition is in place which is part of the reason yesterday or last night I thought we would not see an upside move yet among other things, however when there's a price down/ volume up and it's dominant, then we have conditions for a 1-day oversold market. Hopwever the other indications above still stand and this doesn't outweigh them.

In my view, the CBOE's SKEW Index is still problematic and it's not just the elevated readings, it's the speed or rate of change in which they were reached.
The normal range for the SKEW is 115, as it elevates, it spells tail risk trouble. The SKEW tries to put a probability on an improbable event, some call it the "Black Swan Indicator" because high levels are indicating exactly that, an increased chance of a sudden market crash, a Black Swan.

HYG Credit and Junk credit  are both in line with the SPX today, not leading either way, just in line, but that's neutral so the positives in 3C aren't or shouldn't be effected negatively by Credit, but as I said earlier, HYG's longer term charts are falling apart, it just got a very brief reprieve today that is more or less in line.

High Yield Credit is severely dislocated from the SPX longer term, but intraday it actually led the SPX a bit so that's an overall positive intraday for credit and the market tomorrow.

Sentiment (PRO) is either in line intraday with the SPX or slightly leading similar to the 3 min 3C charts for the averages so it's not surprising and doesn't change my opinion of the market near term and after.

VXX was in line more or less, there are very positive signs and that's why I went for the Call position Friday, I think they head higher, likely not early tomorrow, but overall higher, just look at the spot VIX's Bollinger Bands and the highly directional squeeze signal.

Yields as mentioned earlier in the day are leading the SPX intraday, they act like a magnet until they revert to the mean so this too is mildly supportive of a bounce (perhaps a day, maybe a half day, maybe a day and a half, as of now the divergences are small and there's not much of a foot print so I count it as noise, but it may be useful noise.

Before moving on to Japan, I just wanted to show you Financials because I made a comment about how bad they look, I just want to show you.

 XLF 2 min, there's not even intraday positives like everything else.

XLF 3 min, same thing

5 min leading negative, this is worse than just about any other average except maybe the IWM.

10 min leading negative so the intermediate and long term damage are there like the averages.

15 min leading negative at a new 3C low

The 4 hour as XLF makes the head fake move I was looking for above $21

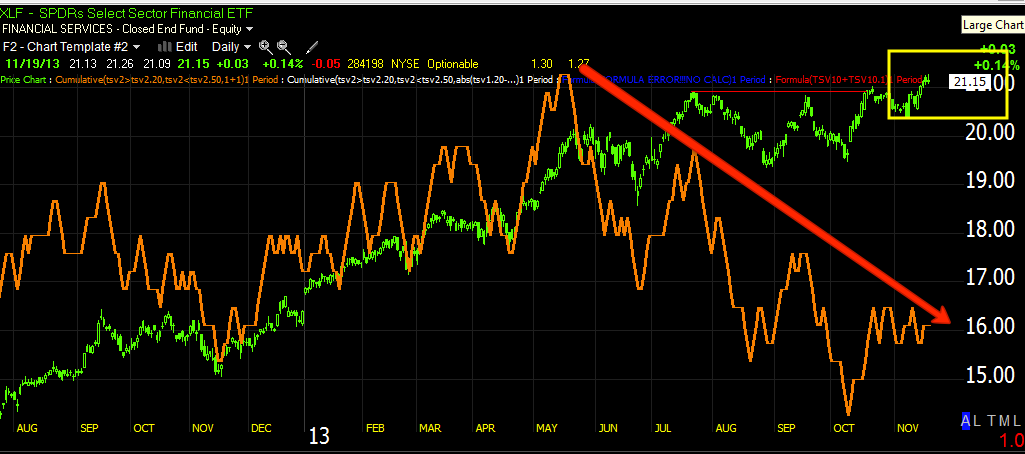
And the daily, again with the head fake above $21, look at that daily divergence, that's a huge flow of funds.

Looking at how bad financials look, I can't help but wonder if the next crisis will once again be financial? I'm very happy to have FAZ long and XLF puts.


Tonight Japan announced the 3rd worst Trade Balance on record, exports were actually fine, it was the import surge cause by fuel as the bottom line is in a margin squeeze so like the F_E_D's earlier QE attempts, Japan's QE-Zilla has driven up inflation in all the wrong areas and the Nikkei is not sure whether to take bad news as good news or bad news as bad news, but what is clear is that Abe-enomics are looking more and more like a failure as they did when first introduced (see my articles "Currency Crisis")
Nikkei 225 futures tonight


Other than that, not much going on in futures right now, we'll see if we get the bump I have been expecting all day today, it should be useful in a lot os situations.

GOOG Core Short Update

Whether you are already in a GOOG core short or looking at one (I wish I was looking at one as I entered before that earnings pop). I actually thought GOOG $1000 was a magnet, nut I just didn't see how GOOG would get there, it was earnings, mostly ramped in the low volume of after hours and it has stuck since, IT'S A PERFECT PLACE TO DISTRIBUTE OR SELL SHORT FOR INSTITUTIONAL SIZE TRADERS.

I think GOOG will be setting up if it is not already (I often admit I can be myopic about entries when it means very little to the big picture.)

 This 5-day chart of GOOG shows the range in which I thought GOOG would move above, even as a head fake, there are just too many reasons not to hit that range.

If you haven't already, PLEASE READ MY TWO ARTICLES LINKED AT THE TOP RIGHT OF THE MEMBERS' SITE...

Part 1) "Understanding the Head-Fake Move: How Technical Analysis Went From An Asset to a Trap"

Part 2) "Understanding the Head-Fake Move: Motivation"

*I've been busy trying to get the new website online, but I do plan on writing Part 3), " Examples of different Head Fakes and How to Use Them To Your Benefit When Everyone Else is Heading the Other Direction"

Perhaps a shorter title...?


 This is GOOG since the earnings gap up, if there is a false breakout, I'd imagine $1050 would be the target area, but I think over the big picture (like a 5 day chart) this gap up is likely the head-fake move. REMEMBER, THESE MOVES ARE ALMOST ALWAYS PROPORTIONAL TO THE PRECEDING TREND AND THE STOCK'S CHARACTER. So take a look at that 5-day chart again and you'll see, this gap up as a head fake is VERY proportional, even the rounding reversal process is there and proportional.

This 60 min chart shows you what smart money has done with the GOOG gap up, but would you really expect smart money to chase a 14% gap? If you did, then you are likely stuck in the dogma of 100 year old technical analysis and not seeing the evidence we present every single day.

 The 15 min chart shows an accumulation area to the far left, that's where smart money buys, on the cheap, on shakeouts on stop runs as price is more favorable and supply is plentiful, they don't chase +14% premiums on thin volume where no one but retail is buying.

In any case, more evidence of distribution in the area, this can come in the form of selling or short selling, both transactions come across the tape as a sale.

 WE MIGHT GET A HIGH PROBABILITY, LOWER RISK ENTRY, although I wouldn't chose GOOG as a long, the 1 min chart is positive today like the rest of the market, this is no coincidence.

 We have migration of the divergence as it hits the 3 min chart as well.


 And most excitingly, the 5 min chart is positive, it looks like someone has set up a move higher, although short term, it could be very volatile and break that $1050 level I mentioned, however, no matter how strong the divergence, only so much can be accumulated in a day so a lasting move is VERY unlikely, a head fake move is VERY likely which we can use to enter or add to short positions.

 GOOG 10 min also has a slight positive as prices dipped, this is typical accumulation behavior (accumulating in to lower prices and higher volume or "SUPPLY". Again, this is much too short to be anything more than a short duration head fake, but it can be an impressive move.

In fact if you read my two articles, you'll know that head fake moves, just like Bear market rallies, HAVE to be very strong to get the intended effect and that is to draw in buyers and create demand at higher prices.

So GOOG should be on your radar and price alerts should be set.

This Volatility stop I sometimes use on a 60 min chart is showing RSI in a negative divegrence, this isn't the ideal price environment for RSI, but it is there.

PCLN Update #2

Earlier today, like AAPL I showed the weakness in PCLN (intermediate to longer term as in Swing to Core short position) and how we could use very short term price strength to short in to as we were looking for a breakout above a tight intraday range in PCLN yesterday before the market dumped before the Head fake could get underway with an intraday move above $1145.

This afternoon I mentioned PCLN along with AAPL as a VERTY speculative, short duration Call (option) position.
 This is one of the longer term (60 min) negatives in PCLN.

As far as the 10/9 cycle and the top/range, here's the clear distribution in the area .

I like the idea of adding to the PCLN core short on a bounce, however, very short term PC:LN looks like it's a decent short duration long, so short it likely needs leverage to make it worthwhile and that makes it very speculative.
 
 There's the negative in the flat range and then yesterday's positive which made me think a head fake move above the range (>$4145) was very likely, but the market took the wind out of its sails before PCLN could get this move off the ground.

Today the 1 min intraday positive continued.

We also have migration of the positive divegrence as this 3 min chart shows

 Even the 5 min chart saw intraday migration, it's speculative, but I think the probabilities are there based on the charts, who knows what Bernie says, but we can only make decisions with the information we have at the time, anything else is either gambling or fortune telling.

A Trend Channel 2-day or 3-day (above) stop could be used as a way to know when the Trend is irretrievably broken, those levels are the tighter 2-day at <$1053 or the wider 3-day at <$1053.

Note ATR has become very wild (12 day) running from mid-teens to over $60, this kind of volatility is typically seen at the end of the trend.

AAPL Follow Up #2

Earlier today I posted AAPL, mostly the bearish perspective and how we can short in to price strength because the under;lying trade is very weak, but I also went with a December $520 call at the end  of the day; these are two VERY different trades. 

The short position should be entered in to on some strength and should be good for something along the lines of a swing trade, maybe more, but you may recall the 60 min chart just isn't weak enough right now for me to consider this a core short.

By the end of the day, the two candidates that I liked as shorts using short term price strength to enter (PCLN and AAPL), both were looking really interesting as VERY speculative, short term positions. Because they are so short term in duration, even though the signals are good, the profit potential is reduced so in this kind of situation I believe in using the right tool for the job and in this case, Call options. I'd usually go with January by this time of the month, but since this is expected to be a very near term position, December fit well.

 This 10 min chart is pretty much the important key to an AAPL short which I think can be an AAPL equity short, in other words, I think you can short the stock and not have to go with options, although the additional leverage of options can be helpful if market conditions are right and you have the risk tolerance for options or are comfortable with them.


 This is the intraday 1 min chart today, not only did the 1 min hold AAPL in place and create that  lateral price action I was looking for today ever since late yesterday and last night.

The leading positive divergence is not needed to hold AAPL in place so when I see a leading divegrence like this, it tells me there's an increase in short term underlying action toward accumulation.

 I look for migration of the divergence, that means if the divergence is strong enough it will show up on longer charts, this is a 3 min chart and we see the positive divegrence made it there today too.

This is really important in the decision for entering the options, the intraday 5 min chart saw a lot of leading positive action today, this isn't the largest intraday  action I've seen, but it is very respectable.

 Even looking at the 10-min chart on an intraday basis, we can see the 5 min chart started to migrate over to the 10 min chart, there's no way that the 5 min chart will undo the damage seen on the 10 min chart at the top, but for a short term move, this is good.

So we can hitch-hike a ride on the way up and close the calls, then enter the AAPL short once we've reached our upside destination.

For those who want to follow the long term trend, this is my Trend Channel, it automatically self-adjusts to the volatility of each individual stock unlike envelope channels or others.

You can see where the short trend was and where it was stopped out and where the long trend is and where it is stopped out, right now at 4488, but the Trend Channel will continue to lock in gains so tomorrow the stop may be a bit higher, feel free to contact me for updated stops.

Closing Update

You know how I feel about the market VERY short term and just after that, I don't know what Bernie says tonight as it will likely influence overnight futures, but from the charts, I would be very afraid to be long anything that is market correlated unless I could watch it every minute.

Tons of damage.

XLK Update

Much like XLF and what I just said, XLK (Technology Sector) is a second close, this looks horrible too, I would not even consider a short term counter trend bounce in TECL or any calls, in fact, on any strength I'd be likely to add to TECS long (3x short Tech).

HORRIBLE!!!

XLF Financials Still Look HORRIBLE

Short Term Market Indications Not withstanding, XLF LOOKS HORRIBLE, I'M QUITE CONTENT TO HOLD FAZ AND MAYBE ADD IF XLF CAN BOUNCE, BUT THIS LOOKS REALLY BAD. I'LL HAVE CHARTS UP ASAP

GOING WITH A SMALL AAPL DECEMBER $520 CALL

AAPL and PCLN Calls

If I have time, I'd really consider some in the money December, very short term calls in both or either PCLN and AAPL.

Since I don't have much AAPL exposure, I'm leaning that way.

REMEMBER THESE ARE EXTREMELY SPECULATIVE POSITIONS FPR A MARKET BOUNCE AFTER YESTERDAY, BUT I THINK IF YOU ARE QUICK ON YOUR FEET, THE PROBABILITIES ARE THERE.

USO Update

I have liked the set up developing in USO for quite a while now, it has built a respectable reversal process and leading positive divergences, I think USO can move in to the channel easily and as a counter trend rally, I think that's what it's aiming for, thus the larger footprint for a base.

In addition, counter trend moves are some of the strongest when they are counter trend rallies. I have the December  $35 calls still open and at the right time, may even add to those, but I'd like to have an asset that is better for trending, like a 2-3x leveraged long ETF, I like UCO (2x DJ Crude) just because it has better liquidity than most other ETF/ETNs.

I'm VERY close to adding such a position (trading), but would like to see just a few more signals really pop and who knows what Bernie says tonight and how the $USD reacts as oil is sensitive to the $USD movements via legacy arbitrage.

 60 min USO chart is beautiful, I'm thinking the target will be in the $38 area, maybe more.

The foot-print of the base is significant and beautifully formed as are the divergences during that area.

This is the 2 min trend from in line on the downtrend or confirmation of the downtrend to accumulation in white at the rounding area.

This is a close up of the same chart, if this were just leading a bit more and popped off the chart, I'd be looking at opening or adding to USO long positions.

 The 15 min Crude (/CL) futures look fantastic, this is what I'd like to see in USO.

The longer term 60 min futures look similar to USO which couldn't be unless there was something three considering they are different 3C codes, they are Brent vs. USO and futures vs and ETF, that's good confirmation.

Still loving oil long.

Opening SPY December $179 Calls

This is a VERY speculative play, I imagine a day, maybe more, but not too much.

It's a very spec. trade, almost a day trade.

IWM Put Follow Up

Usually when I use the leverage of options it's because I'm trying to capture a high probability signal and get that initial momentum and then look to ride the trend with something that has less leverage and without the difficulties options present.

I saw the way the IWM chart was going as well as my expectations laid out last night and thus far confirmed in several posts today and saw these charts and decided, "Why sit through the drawdown of a nice profit to perhaps a loss when I can take the gains here and re-open the position at a better or lower premium?" In any case I have SRTY long and the draw down there is  manageable and it allows me the protection of having IWM short exposure in case all goes to pot.

 IWM intraday positive is a change of character, I'd expect to see this improve even more, but that's the first warning.

The IWM signal above just happen to come at the same time that the NYSE TICK chart was showing a trend to the upside, more and more stocks are closing up per tick so breadth is changing intraday, that means to me, "Time to take the gains, say thank yo and look for the next opportunity".

Here's how the P/L worked out on an approx. 2- day position. 


With 20 contracts at a cost basis of $2.11...


The fill came in at $3.00 even for a P/L on the 2-day position of +42%