If you ket up with the posts late last week, you shouldn't be surprised and maybe you are even ready for a little upside rally, Friday's close and everything I see seem to indicate that's what we'll get. How high? It could build onto the right shoulder of the H&S top as they tend to be symmetrical an the right shoulder is a bit short. THIS DOES NOT CHANGE OUR BEARISH STANCE, the market simply doesn't go straight up or down and if we can hedge and make some money too, all the better.
Here are he charts that you'll see on tonight's watchlist and don't forget the other recent longs listed. See the spread sheet for more information.
Something is up in the long treasuries, this is a "W" base with great volume to confirm it. 4C is in a leading positive divergence and it looks coiled for a breakout through $100 where the volume should be enormous. The red arrow is a negative divergence and yellow are positive divergences and a leading divergence or strong accumulation.
TLT 3C 5 min chart suggesting this will breakout soon, probably tomorrow.
Here's my Trend Channel, the red arrow is the current stop on a closing basis, it has the advantage of being objective and locking in profits everyday.
I listed two other plays on the treasuries, both are low volume ETFs, UBT and TMF which are 2 and 3x leveraged respectively.
Get some financial coverage-UYG is a 2x leveraged ETF that will let you play the financials. Banks went nuts Friday. Here's a nice 10 min divergence suggesting this won't be a 1-day move but several days to a week or so.
Again, the Trend Channel. See the first red trendline was a long stop out, the yellow arrow points to the current stop level. This one turned around fast. The banks like something in Congress's bill that is suppose to tame them down, I guess it wasn't s bad as they anticipated.
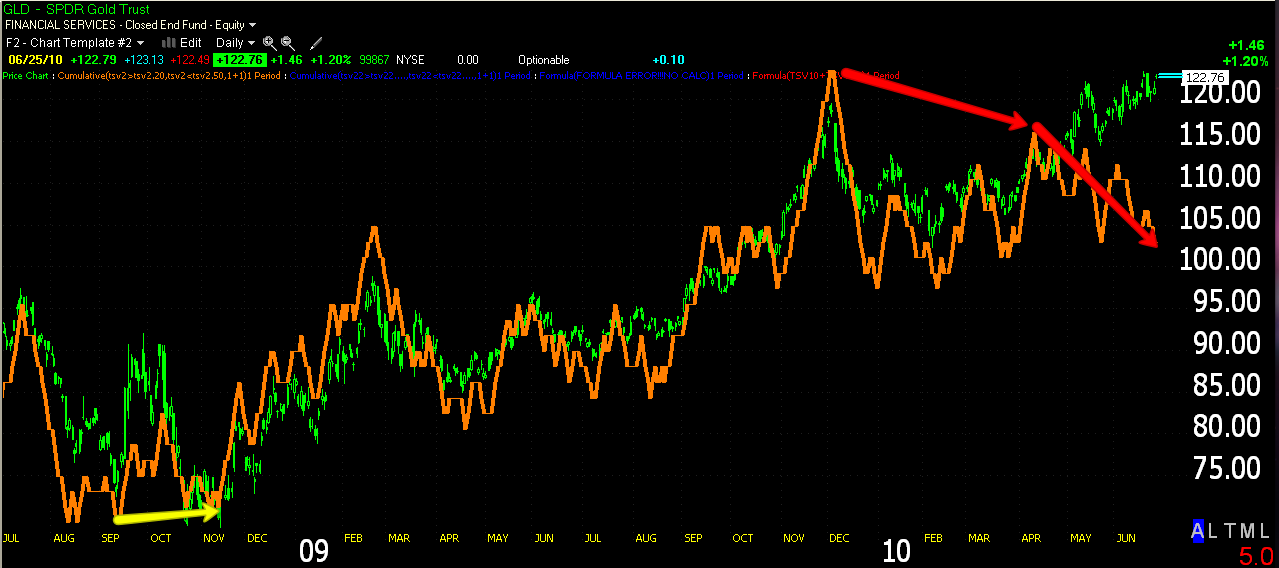
I've stayed away from gold for the most part, but this daily 3C chart has followed gold flawlessly for over a year and now it's in a negative divergence, something is up here.
GLD 1 min 4C chart, suggesting early weakness.
I started a new watchlist, Thursday night AMPL was the first stock I put on it, there was something I just liked about the chart-look at that volume Friday. This looks poised for a big breakout.
Great volume in the daily chart of LAB, a nice descending wedge which is bullish and a nice 4C leading divergence all suggest that this will end up higher in the weeks ahead.
IEC is a long now in my opinion, it's formed a nice little base, volume is beautiful. Note the resistance is coming from that gap back in May. Gap resistance must be watched, IT IS RELIABLE.
MBI should roll with the market, it has a nice false breakout going for it, yes I think these things are positive! Now look at the volume (orange arrow), it's rising. Volume doesn't need to club you over the head to be meaningful-watch for that which others miss! These patterns are prone to false breakouts so the stop is wide initially.
Finally, if you own just one, then UPRO, it'll give you broad market exposure at 3x leverage on the S&P. I mentioned using this ETF last week so maybe you already bought some?
OK, I would get busy buying if I hadn't already, hedge your portfolio and you'll most likely make some $$ on the run too, this is why we are at 50% in the core shorts, to leave room for these opportunities until the market really breaks, and even then we still leave 25% cash for the same reason.
Have a great week.