Thursday, January 3, 2013

EOD Wrap

OK, so we expected Trend #1 to be a sharp, strong move, but rather short lived compared to the trends to follow (which I won't get in to too much now), we have seen that sharp move up. I also said my gut feeling is we will see a sharp, fast reversal to the downside when trend 1 is done, I believe that is still true. Yesterday we didn't see much in the way of distribution because the S&P and Dow had yet to cross above resistance, they needed to do that to open up demand and higher prices, that's the point of this whole exercise. However as soon as resistance was broken late yesterday, today we started to see distribution. At first it was so small I apologized for posting it, but I wanted you to know what was going on. By the end of the day, we had a solid trend of growing negative 3C divergences. We also had an intraday positive signal, which is short term.

My gut is the signals are not yet bad enough to send us lower so we may hang in this area, bounce back and forth above and below the resistance breakout area or even move up a bit, but the underlying strength is fading so any move up at this point is a gift for short positions.

Earlier today I said tomorrow's Non-Farm Payrolls would be interesting to see how the market reacted as the F_O_M_C changed their yardstick for policy accommodation, now after the minutes were released and there seems to be a growing discontent with QE among the F_E_D, I'm thinking the market is going to want to see bad numbers from the NFP to try to justify the F_E_D staying the QE course, this may be an event in which if we don't get a bad report, the market could fall, the opposite of what you'd think. The tricky part though is the seasonal adjustments the BLS will be applying to the NFP, they used it last year arbitrarily to make reports look a lot better than they were, once we moved out of the seasonal adjustment period, the reports were 180 degrees to the negative and the market fell to the June lows from there, so seasonal adjustments to make government look good could actually end up hurting the market!

I have published some recent analysis on gold (From last Friday) and my opinion was we would see downside in the near term, the longer term looks less sure. Gold is one asset that is very QE/FED sensitive, beyond my analysis, take a look at GLD...
 Gold/GLD was sent lower intraday on the release of the minutes, obviously it didn't like what was said about QE, so the market would take it in much the same manner.

Understand that when I said Trend 1, a strong upside move, would be short lived, that was all based on analysis even before the Fiscal Cliff really started to become a big deal. It turns out the Fiscal Cliff was the "Apparent " catalyst and I say that because the financial media needs to feed people the reasons why the market did this or that today, which really doesn't matter if you weren't in front of the trade like we were on the move up and believe me, Wall St. doesn't mind one bit as it provides cover and people really believe the market is reacting to these things and doesn't realize that we predicted this move weeks ago based on underlying trade, Wall St. had it set up, thE resolution of the Cliff was just a convenient catalyst.

However what that also means is that the resolution of the Fiscal Cliff was priced in BEFORE we saw this pop, meaning the pop is all Wall St. manipulation and as far as they are concerned, it's a profitable venture, but it's not anywhere near fair value. Add in that Congress didn't take care of several other cliffs including the debt ceiling, and the resolution is actually worse than anticipated or at least hoped for.

Now throw in on top of that the F_E_D minutes with QE being openly questionEd by voting members for the first time (to this extent) since the program started in late 2008 and what did QE do for the market?

This rally or bull market is nothing more than a QE House of Cards, look at any of the areas in which the market lost momentum or declined and you'll see it's an area between QE programs when the market didn't know what it would get except for QE3 which was priced in to the market ahead of time starting around June of this year. As Warsh said (ex-F_E_D Governor), "Getting in to policy accommodation is the easy part, backing out is the tricky part" and it sounds like the F_E_D is starting to consider how it may back out and when, the when being a LOT sooner than any one thought. This all started in the last 6 months as the F_E_D went from a DATE BASED policy target to their new ECONOMIC DATA BASED policy, this is what the market didn't like, it's why the market didn't rally on the QE3 announcement and now these minutes are going to change everything as the yardstick change was just the initial step toward backing out of policy accommodation.

The bottom line is we need to rally pay attention to how smart money reacts to this over the next month or so because it will take them time to turn their very large ships.

As for today and tomorrow, the NFP tomorrow is now going to take on a whole new importance given the F_E_D minutes today, probably twice as important. My gut is a good number sends the market lower (at least for a bit) and a bad number holds it in place or rallies it.
Commodities are considered a risk asset, they should follow the SPX (green) which is also a risk asset, you can see they have been diverging negatively and really bad the last 2 days.

 This is commodities vs the Euro (green), note how they follow the Euro almost exactly. It's not really because of the Euro, it's actually the $US Dollar is moving up and the Euro moves the opposite of the $USD generally, so higher $USD prices equals lower risk asset prices including stocks, but commodities are the only one following the correlation for one simple reason, the cycle of Trend 1 is a manipulation that was set up in advance and this is why we could predict it in advance. You know how infrequently I use options, yet I had 3 open options (Calls) for this trend specifically and they did excellent (Up to +224% in 2 days). At some point the stock market will fall to reversion to the mean with the Euro, it's just Wall St. can't have that now like commodities as the cycle for the move up was already in place and they rarely abandon a cycle once set up-there's too much money that has been moved around.


 Another look at Commodities vs the SPX, but a closer view of the last 2 days. This is a problem for the market.

 Here's the SPX (always green) vs the Euro, last week the Euro was positively divergent giving the market some underlying strength to lean on, now that has totally flipped. Note to the far left how they usually track together.

 The Euro vs. the SPX -closer view of last 2 days. The open Wednesday night in white told us the market was headed higher, but after that initial spike in the EUR/USD, it's been downhill ever since. It doesn't matter the reason, at some point the arbitrage algos take over and reversion to the mean becomes the game.

 Today I noted at the end of the day we had some 1 min positive divergences, this would suggest a move higher tomorrow morning or in the first half of the day, there's no strength beyond the 1 min chart so it's not anything that will stick, but it could lift the market and then lead us to a sell-off, it needs to be watched like a hawk tomorrow because there was some serious damage done today in 3C/underlying trade in a few spots.

 This is High Yielding Junk Credit, it was supportive of the SPX making the late Wednesday rally through resistance, but once that happened, you can see today it has diverged negatively away from the SPX. This isn't a huge flow out of credit, but like this morning's divergences in 3C, it's a start.


 High Yield Corporate Credit also diverged negatively from the SPX, look at what time it really took place, 2 pm, the release of the F_O_M_C minutes.

 Remember that late day positive divergence on the 1 min chart I told you about, look at the NYSE TICK Data in green vs the SPY in red, note they move together as they should all day until the end of the day when the SPY makes a new low in afternoon trade, yet the TICK data (all advancing stocks minus declining stocks) did not make a new low and instead moved higher to new highs at +1000. This also supports the idea of early strength in the market, but I'm thinking if we get it, it should probably be faded, we will confirm with 3C if we do get it. If this happens, it's a gift.

 Trend 2 or the longer term, higher probability trend is in a leading negative divergence on an important timeframe, this is part of the analysis that led to Trend 1 and Trend 2 (up strong and down stronger and longer respectively).

 As I said about the positive divergence on the SPY 1 min, there's no strength behind that, here's the 2 min chart proving there's no strength, in other words it looks like a set up in which some stocks were bought, they'll be sold in to some market strength and then the move up is faded.

 As for the QQQ, it was one o the worst performing as far as underlying tone, remember it was the first to cross resistance on the open Wednesday so it make sense it is the first to see distribution. This is a big picture chart of the 15 min with a leading negative divergence, this suggests a very strong downside move next.

 This is the 10 min chart, note how distribution picked up today vs yesterday with a leading negative divergence at a new low.

I think the QQQ were the only average to see a leading negative divergence intraday on a 15 min chart so there was some major damage done today.

We'll see how the NFP plays out, if it is negative in pre-market, I wouldn't assume that it will stay that way, that 1 min positive could be run over, but chances are better than 50/50 that they let that move up and then back down play out. If so, that's where we want to look at adding positions, like I said above, It's a Gift!

As for futures overnight, there's not much action, NASDAQ futures are a little lower than the 4 p.m. close. Es is exactly where it was at 4 p.m. right now.

What will be important overnight is the underlying 3C tone and whether it starts to influence the 5/15 min charts.

So that's it for now, today the market became much more complex with the release of the minutes. I wouldn't be surprised though if Wall St. had a heads up and this cycle that has been so strong to the upside is what I suspected the entire time, a place where demand and higher prices allow institutional money to sell and go short while retail sees higher prices and is left holding the bag, but that's gut feeling and initial indications, I rely on objective data just to be clear.

Have a great night, get ready for some fireworks very soon, if we can make over 200% in 2 days on a short trend, imagine what we can do with a larger, stronger one!

AAPL- GREAT QUESTION

This is a GREAT example of why I try to show yo as much as I can rather than just tell you, do this, that and then stop. I want you to learn the concepts, the reality of the market and how to use that in your own individual trading style, I'm not looking to be a guru, just a lifelong student of the market.

In any case, this email came in just a bit ago from one of our long term members asking about AAPL,

" Brandt... Is 3C showing any short term accumulation on the AAPL pullback today?
TIA.."

He read the AAPL analysis from earlier in the week and today and as soon as I saw his question, I knew exactly what he was getting at because this is something I have taken the time to show members rather than just give a summary.

He wants to know if 3C's short term charts (because they are the most sensitive and move the fastest), picked up any sign of accumulation in to AAPL's pullback today, here are the charts...

The reason he asked is because he knows from seeing it so many times that if there's accumulation in to  a pullback, that stock is likely going to move higher. Smart money does not chase stocks higher to buy them, they buy as price is going down or is flat. 

In asking the question he is trying to figure out whether AAPL is more likely to do what I suggested and break below the large bearish triangle where it will likely be accumulated, or if AAPL is going to follow the strength of the 15 min chart and move higher from here.

The answer is no- there was no sign of accumulation in to today's AAPL pullback. Here are the short term charts on AAPL's pullback.

 2 min

 1 min

 5 min

3 min

No accumulation on the pullback, smart money doesn't look like they are willing to buy AAPL here, but I'm thinking they will be willing to below the bearish triangle as that will open up much lower prices and huge supply they can accumulate.

Volatility


We watch and trade both VXX and UVXY, UVXY is a bit trickier to trade, but one of the positions in the equity model portfolio is VXX which is at a 50% regular size position so it can be added to and I probably will do that very soon.

Volatility also helps us with timing a move/reversal as it trades opposite the market.

Here's a look at VXX (VIX Short Term Futures) and UVXY (The same but leveraged)

 First, since Volatility trade opposite the market, I found this intraday 1 min negative divergence at the end of day interesting as it corresponds and confirms the SPY positive 1 min intraday below.


SPY 1 min intraday divergence at the end of day, as the SPY moved lower there appears to have been short term accumulation, thus I don't think the signals are quite strong enough yet to say this move is over. Also note the intraday 1 min negative divergence (these are often market makers and specialists trading their own accounts or adjusting inventory for an impending move they know is coming.) That negative divergence was in place before the 2 p.m. release of the F_O_M_C minutes which the market reacted negatively too, so someone was distributing, either selling or selling short for about 45 minutes before the minutes were released.

On to Volatility... UVXY
 I featured a 15 min chart because as I said earlier today, VXX and UVXY both have divergences started that they can build from. The shorter term charts are much more impressive looking as far as the divergence, but the longer timeframe (15 mins. as opposed to a stronger looking 5 min chart) is much more significant  as far as the size of the underlying trade the divergence is pointing out.

On a 3 min chart with a divergence that shoots up to the top of the chart, we have  strong intraday move coming or the divergence will continue to migrate through the longer timeframes, but put it up against this 15 min chart that would not look as impressive, and the 15 min chart is about 10 times more important.

Here you can see the 3 min UVXY and it is sharper, larger, but it's not as important as the 15 min above. We do however get more detail, we can see for instance a head fake move Friday as the market hit a new local low and volatility hit a new local high-both moves centered on support and resistance, thus this is a head fake move (probably more of a result of the inverse correlation in which the real head fake was in the market, but it could catch a few traders with orders above resistance). Today's migration through the timeframes in volatility is usually a pretty good sign that we are near a reversal point.

VXX
 Here's the same negative divergence on Friday on a 10 min chart (still an important timeframe) with a leading positive divergence today, so this is in the area in which I want to consider adding to the established VXX commitment. If the signals are very sharp and strong, I may consider using the leveraged UVXY to fill out the VXX position.

Here as mentioned above, you can see how the 5 min (less important than the 10 min) is showing a stronger "looking" positive divergence, in reality the 10 min chart is stronger, but this is how these charts will look as the divergence migrates through timeframes which means it is a healthy, strong divergence.

I'll be taking a look tomorrow and seeing about adding to VXX in anticipation of Trend #2, a longer term move down that should take out the 11/16 lows (and probably a lot more as I reminded you today, the market always moves further than what seems reasonable).


How Far The Negative Divergence has Migrated

For short term information, the SPy especially is still holding a 1 min positive divergence, that could bring a consolidation or an intraday move up, which would be better. The IWM has some signal and DIA too, but the Q' s are all negative on the 1 min. If the divergence holds until the close, then expect it to play out on the open tomorrow or morning trade.

All day I've posted the divergences as they just started today, from 1 min on and we have seen them grow. I'll post 2 charts of each average, the first is the longest timeframe the negative divergence we have been tracking today has reached. The second is where this current divergence splits from the Trend 2 divergence so you can see how ugly that trend will likely be.


 DIA has migrated to 10 min today, that is respectable.

 Trend 2 splits at the 15 min chart, we should see some negative action on the 15 though as this divergence worsens.


 QQQ 10 min leading negative, so that's a decent negative move today, good migration.


 You can see how negative trend 2's 15 min chart is and you can see how the current divergence is effecting the longer term one as it is moving toward a new low.


 SPY has only made it to the 5 min, it also got a late start yesterday.

Trend 2 is seen here in a 15 min.

I have a feeling we are not quite done, but things are shaping up our way. That means we should have some better opportunities to enter positions, I would want some short exposure (as we built the short positions already), but I would not be loading up the truck until these signals are stronger. Price should need to move up for the signals to become stronger.

Quick Market Update

As for the market, the SPY and IWM are showing intraday positive divergences that could lift them a bit or cause a consolidation, it goes no further than 1 min charts so it is not a strong signal, just intraday chatter.

The DIA is about in line, only the QQQ is in a negative position, after all, it did hit our targets first.

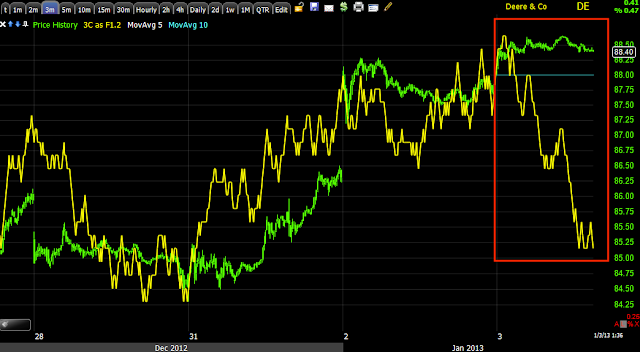
From the other charts, it appears we are getting close to that area that I would consider adding some shorts, I prefer 2-3x leveraged ETFs for the next trend, although core shorts like DE work as well. I have to check several other indications, but I could see phasing in to some shorts in this area if you have need of them. If you are already covered as we built a position for trend 2 already, then I might consider adding just to give the return an extra pop, but I would wait on that for the moment. Only if I didn't have any short exposure would I add some here and especially if you can get it in to price strength even know we are in a good overall area, every bit helps.


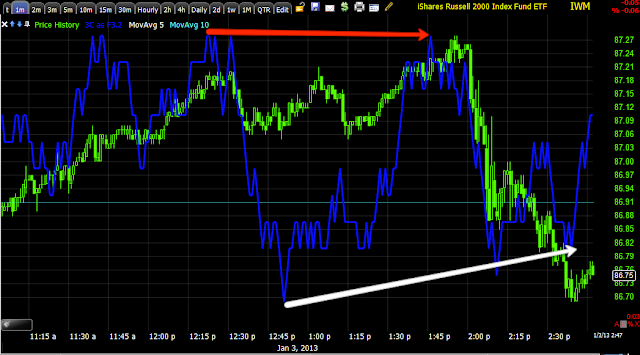
 IWM short term intraday showing a negative before the release and an intraday positive, this may be enough to move prices higher toward the close.


 Same in the SPY 1 min...

The DIA just joined these two in an intraday 1 min positive, the QQQ is still not showing any signs of a 1 min positive divergence.

Futures are next...

F_E_D Knee Jerk Reaction

OK, if I had a prize I'd give it to the first person to email me what I always say about anything F_E_D related as far as the market goes, but I don't.

For older members yes you are going to hear it again, for newer members, older members could tell you it's true more often than you'd believe...

"Anything F_E_D related almost always sees a knee-jerk reaction and that knee-jerk reaction is almost ALWYS wrong".

So the F_O_M_C minutes came out, the committee is not as hot on QE as you might suppose considering they just added Treasuries to MBS at the last policy meeting, but some are talking about an end to QE before 2013, the market does not like this and reacted in such manner, but these knee jerks are almost always wrong. Lets take a quick look at the very short term as the market moved down on the minutes and this may help with our timing.

If I had to guess, the minutes which are released to news organizations hours before the public on an embargoed status, probably leaked out as you'l see negatives on the 1 min chart as the minutes come out.

These are 1 min charts only, after that there's not much positive.

 DIA negative right before the minutes are released, current 1 min (ONLY) positive divergence. A move up in price from here can be used to distribute in to so it may be helpful.

 IWM 1 min (ONLY) also negative just before the minutes in 3C and positive on the decline, 1 min is intraday only so not really strong, but maybe enough to consolidate or send it higher intraday.

SPY the exact same.

We'll see if the longer charts get more negative in to any potential upside, that would be a very big timing hint.


First a Couple of Things I Don't Like

To be clear, with the call positions I have no problem at all with having closed them, they were at great gains and the probabilities of them seeing greater gains were starting to fall; they no longer (at least at that expiration) were the best tool for the situation.

Closing long positions, especially leveraged ones, does not automatically equate, "Go Short", there needs to be high probabilities built up there too. Yesterday we had NO probabilities of a reversal built up, today they started small and grew larger and larger, however are they screaming "High Probability Downside Reversal Now"? No, not yet, but moving in that direction.

Here are a few things I don't like before we move on to look at where we are in this market and where the opportunities are and when.

First we have the NFP tomorrow, Non-Farm Payrolls and this will be very interesting to see how the market reacts as you'd think a bad report would be bad for the market, but since the F_E_D has changed their yardstick for Policy Accommodation recently from a "DATE" driven guidance to "REAL TIME ECONOMIC FACTORS", a bad report may actually be taken well by the market as they see it as "F_E_D accommodation continues and isn't in trouble".

The other side of that coin is seasonal adjustments, we are in that period, during Q1 of 2012 they were heavy, they were everywhere and completely arbitrary. As soon as we moved out of that period the market fell as the Economic reports suddenly shifted from glowing to dirty.

How the market takes the news is what is important and this is the first major test of the year with a lot of under-currents attached to it.

I also don't like the daily candlesticks right now, they don't spell out high probability reversal and all of the averages are very close to another resistance zone. Remember this always, "Wall Street doesn't do ANYTHING without a reason" and as big and strong as this move has been, there are some areas not too far away that would hit an even stronger emotional chord and get the market to do what Wall Street wants (which I believe is to set up shorts at the best prices possible with as much supply as they can get).

Take the Dow which is in the best position as far as daily candles right now.

 First at "A" there's a resistance level that is very clear, there's no reason that can't be hit from here, remember I told you the move will be short compared to the other trens after this, but it will likely be stronger than any of us can imagine. The other thing is they can easily shakeout a bunch of traders by just dipping below the trendline and use their shares, accumulated in bulk to make that move above "A".

"B" is the daily candle set up, this is the best of the 4 averages and it's not there.


This is almost a Harami reversal to the downside, but not quite and even if it was, it would be a poor example. More importantly, at least as of where we stand now, the volume is not rising which i what we need to see to increase the chances of it working.

There are still charts in the S&P and NASDAQ Futures that have not gone negative or negative enough for me to feel like we are high probability right now.

Finally without getting in to every myopic detail, the dominant Price/Volume relationship last night among the components of all 4 major averages was Price Up/Volume Up which is the most bullish of the 4, the best Dominant relationship at this point for a downside reversal would be Price Up/Volume down.

So I'll be watching that tonight.

Remember, not every move is significant as part of the trend, many look like noise moves and are not significant in the trend, but do serve a tactical purpose, such as a quick move below support tomorrow followed by a move higher on Monday. Tomorrow's move would be noise in the trend, but would have served a tactical purpose.

Now, since underlying trade is moving so fast, I want to look at the other side of the coin and see how we are coming along. Remember, we are only 3 days in to this move, that's not a lot, even though the % gain has been strong. This is what we expected, we just have to rely on the market's underlying trade to tell us when it's over.


Market Update

I'm glad most of us have short exposure built up, if this keeps going the way we planned, the hedges (call options) made money and protected the shorts and trend 2 should make those shorts very effective.

As far as adding to positions or perhaps puts, I'm a little sketchy on that in front of Non-Farm Payrolls, this is why the set-ups are strategic, not just simple trades.

In any case, I know the downside is tempting to chase after and we have some pretty negative charts as they have been developing that way all day as I have shown you, but Wall St. is sneaky, they don't make anything obvious or easy.

There are a few charts in the futures that I'd really like to see break down before I'd consider Puts in any size or adding to shorts (the 2-3x leveraged) in any size. For brand new positions, I can see adding some exposure to the short side, but I'd still not load up the truck until a few more signals tell us we are at a VERY high probability area.

I'll be putting some various updates up to give you some idea and ideas.

DE Follow Up

So as I just posted, I'm comfortable with a half of normal size position (which would be speculative size normally although I don't view this as a speculative trade) and leaving the other half for stronger signals or a better entry. This is NOT Dollar Cost Averaging which is a losing strategy whereby you have a losing position and you through more good money in after bad to try to reduce your cost. Phasing in to a trade is part of your risk management plan before you ever enter the trade.

I DO NOT support Dollar Cost Averaging. We have a saying, "If you find yourself in a hole, STOP DIGGING!" Chances are you can make up the losses in a much better trade rather than throwing more money in to a losing one.

That said, here's DE... Please take a look at the original trade idea, what we were looking for, etc. so you have a better idea of how this all works, even if you are not interested in the trade idea.


 DE made it above one of our target zones, this is where we wanted to look at the trade, let DE come to us rather than sit through a lot of draw-down. The resistance area was an obvious target, again the reasons are in the 2-part article, Understanding the Head-Fake Move.

 The intraday 10 min 20/20 Bollinger Bands looked like DE was getting ready for a directional move, it's just starting to break to the downside of those bands, but they are intraday so they aren't the strongest signal, but I thought with everything else, now was as good a time as any for at least a phased in position.

 Even MoneyStream which isn't very sensitive on intraday charts, calls this negative divergence on the DE breakout above resistance and on a 60 min chart.

 Here's the 3C charts, 1 min from confirmation to a negative leading divergence

 3 min in a leading negative divergence

 5 min couldn't make a new high so it's default in leading negative position and today we see a leading negative intraday move. Note the accumulation right before the move and how did they know how the Fiscal Cliff Vote was going to go down before the weekend? Hmmm...

The 15 min is also in leading negative position with a relative negative divergence as well over the last 2 days.

DE should be a nice trade with a move below support (former resistance it just broke out above), that will leave quite a few longs caught in a bull trap.

Again, if we get a better entry or even stronger signals, I'd look at adding more to DE, ultimately I'd prefer it be a full size position and I think it has a chance to be a trending trade, not years or anything like that, but several months is certainly possible.

DE Trade

Monday I posted the DE Trade Setup Idea. I like what I see so far in DE and I would consider it a core short position. I would also consider it a decent trade to phase in to.

I'm going to open half a regular size position in the Equity Model Portfolio in DE now, I'll wait on the other half to see if we get a better entry or for stronger signals- remember if you open a partial position to see if you can get a better entry, you must consider that in your risk management and leave a wide enough stop to allow you to fill out the position at higher prices, this can be done with position sizing.

I'll be posting DE charts next.

AAPL Follow Up

Monday I wrote about AAPL in "AAPL is Really Pulling My Strings"

The gist of the post is that AAPL not only has a longer term base-like structure it has been building for a few months (this is what I suspect is trend #3) that looks good, but a 15 min chart that I'd usually buy every time. It just so happens to be that we have a VERY rare occurence right now of multiple trends all showing up at the same time, it is something I've never seen to this degree, which makes buying AAPL not as easy as it would normally be.

Since I've had a lot of emails about AAPL since the last post, let me show you what I see and where there may be a trade.

 The 15 min chart is what I'm attracted to, note how it's leading positive here.

 This is the same chart with no drawing.

 Even the 60 min chart, since topping has shown a positive leading divergence.

 The problem is on the faster timeframes, this 3 min saw accumulation sending AAPL higher near term, but is now negative


 The 5 min saw the same, also leading negative.

So it makes it very hard to buy AAPL when the newest divergence building is moving toward the negative. There is one potential set up I can imagine and would be interested in.

This large descending triangle is a bearish consolidation / continuation pattern that is seen after a trend down which is in place. Traders will expect price to break below the triangle and dtart the next leg down. As you can see it looks like we have a little upside head fake breakout which could set up a Crazy Ivan shakeout on the downside as well, that would get shorts to commit, provide a lot of cheap supply and likely be an excellent area to be a buyer.

I don't want to ever take a sub-par trade because I'm looking for something to do, you have to be patient with these setups and let them come to you, but that is one I can see happening and truly being worth while.