Thursday, September 5, 2013

Daily Wrap

My first thought is all the emails I received yesterday about FSLR which had "appeared " to break down, last night I addressed the chart and thought it was a very clear head fake, believe me sometimes I get sick of saying, "Head-fake", but if you haven't read the two articles I put up on the right side of the members' site, "Understanding the Head-Fake Move", you are really missing out on a big part of the market and a great way to enter trades at low risk, high probability.


So my first thought is, I'm glad that the head fake concept that was just posted less than 24 hours ago re: FSLR was proved to be an effective concept, even more than the move today as FSLR is up +5.15% on the close and our call options appreciate the move as well.

I also addressed MCP which was in a triangle, that's a bit more complicated so you might want to read last night's post. Because of the market posture and the "head fake" concepts around popular technical patterns, MCP needs to be watched, even though it gained nearly 2% today on a breakout from that triangle, it's the triangle that is the weak link in the chain, MCP itself looks like its still a good longer term candidate on the long side and we may get an opportunity to add to it or start new positions for those who are interested.

I talked about transports, they should rally with the market as proof for the skeptical, but they need to pullback first and they look like they are on their way to doing that.

It's very difficult to call out positions in a market like this, my view of risk is different than most, I view your money to be at risk ANYTIME it is in the market; I don't differentiate between stocks like MSFT or BPCLN being more or less risky because I have seen some of the "least risky" assets turn the market upside down. Take Mortgage Backed Securities, they theoretically shouldn't be that volatile as we are talking about houses/property and they are backed by real tangible assets (the home as collateral), at the time, they must have sounded like one of the safest investments out there, look what happened to our economy since 2007 and a lot of that started with MBS. In fact few people know this, but CDs/Money Markets that people assume are almost risk free because their return is so low and all of the FDIC non-sense that people attribute to them as they are generally sold to you in banks; is an asset class that was merely days away from collapsing back in 2008. If the general population knew how close their "risk free" assets were from total wipeout, I doubt we'd have much of a banking sector.  The point being, risk is risk if you are in the market and it has to be worthwhile.

One other thought from yesterday (which has been repeated here several times and hundreds of times in emails) is, "Whatever seems reasonable as far as a price target or amount of time in the market, double or triple that" and that's probably being conservative". Even in flat and dull looking trade, the market can be extreme in duration, this is simply because a lot of the market and making money is about pushing emotions as well as patience, to breaking points. If anyone tells you the market isn't an emotional creature, they've never been in it very long, it's like the emotional "Collective"

One other thing that struck me as interesting today was our Options Tracking Portfolio for the second day, it's not so much of a boast of how great our trades are doing, but an interesting comparison to the rest of the retail market and where and how they've positioned, how they are doing (and choppy markets as we've seen over the last 2 weeks or so are difficult to trade".

Our Options Portfolio saw a lot of repositioning Friday, some earlier in the week and yet ti has gone from a weekly rank of 31 of  604 at a +7.36% return on the week and a monthly rank of 30 of 550 again at +7/36% gain for the new month.

Today the weekly and monthly rank were 19 of 730 weekly and 19 of 667 monthly, both with a return of 15.65% vs the SPX's +1.35%. Other than our retail sentiment updates, this also tells us something about the way we are positioned ahead of time vs. retail's chasing.

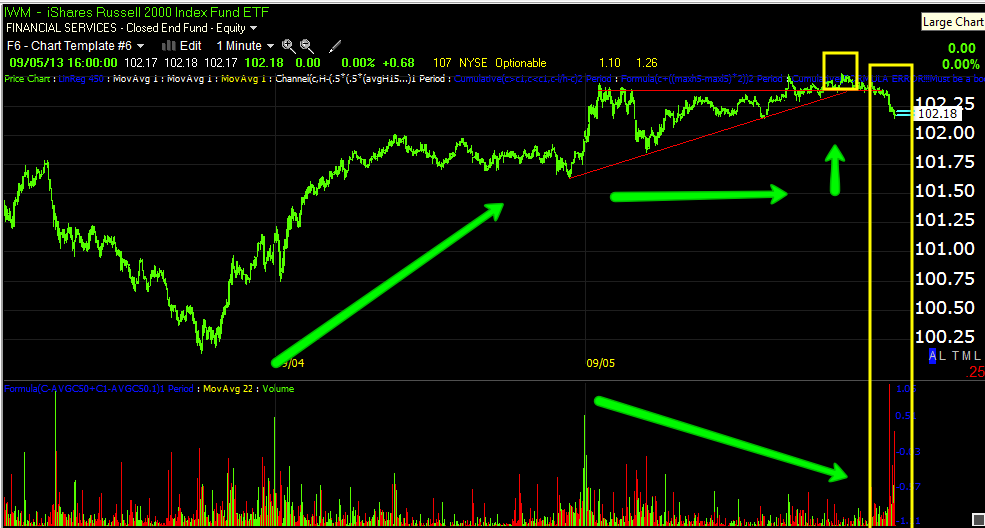
I'm pretty sure you know what the shorter term 3C charts look like, they were posted numerous times today, the timeframes needed for the move over the next couple of days have been in place, the 1 min chart today was acting as a timing signal and it was in line most of the day before finally freeing itself up, the IWM is the best example, but you can see by the Q's and IWM that this started around 2 p.m., which is also about the same time as the triangles saw a failure to break to the upside as most technical traders would expect.
 QQQ intraday finally breaking from in line to negative

The IWM showing the sharped leading negative intraday break.

Remember I mentioned triangles in every major average? Here's the SPY, a failed attempt to break out and volume picks up as stops are hit below the triangle's apex.


The IWM's ascending triangle was the most bullish, traders expected it to move like the green arrows, instead it went negative and the breakout was a failure, this is considered a head fake move, although not a very strong one, it can be more than enough to create the reversal we are looking for.

IWM volume below the apex, technical traders are just that predictable that you know exactly where they'll pout their stops. If you read the "Head Fake" articles I wrote, you'll understand why patterns and action like this are so important to reversals.

Otherwise there were a few trades we entered today, not too many and of course these are pretty speculative because of the expected duration.

Tomorrow is an op-ex Friday as is every now with weeklies and the action is usually dull, but last week it was the busiest day in quite a while and all of the positions we closed and opened were right on come Tuesday's open. I wonder about tomorrow with the NFP, I almost kind of wander if the max pain pin is lower and that's part of the reason we've been in suspension in this area the last day and a half.

As far as any significant changes today from last night's update, there weren't many with the exception of Treasuries moving a bit lower than what was posted about Treasuries, "T's Time to Rally?"

The $AUD also lost strength just after last night's post as it looked like it would. The $USD gained a little ground.

As far as Leading Indicators, Credit in the form of HYG remained around the same range where it had been under accumulation after gapping lower Tuesday on the open with the market gapping higher, this was a prime example of credit leading. HYG never got any legs under it today, although it was still largely in the range, but it did weaken in to the late afternoon which I suspect was part of the equity weakness and the break on that 3C in line lock on 1 min charts most of the day. Junk Credit had an even more acute sell-off so it seems clear to me that credit expects the market to head lower in the coming days as do we, in fact it seems to be leading it. Even the skitttish High Yield credit that has been holding up so well, broke lower today, but did not make the kind of break that makes me worry about losing the larger move to the upside expected after a pullback here, it pulled back enough to move markets a bit, but didn't panic as if the market was changing character dramatically. In any case, HYG continues to build a positive 3C divergence so it's fine with me, that's one of the biggest reasons I'd like to see the market head to the lower end of the range, as far as timing and entering more longs in bigger size, a head fake move under the range would be great and I'd say it's probable, the most important thing is to make sure we see accumulation in to any downside, as long as we have that, we're still on track.

One other point of interest was that our sentiment indicators were either weak today unlike previous days or turned outright to the downside and sharply just before 2 p.m., not so bad that the sub-intermediate upside move is threatened, really perfectly in scale for the kind of move to the downside we would like to see, a "Constructive pullback".

Other than that, you saw the weakness in PM's, I didn't like Silver today, I liked gold a bit more, but we'll see if a position pops up there.

Other than that, for the moment there isn't much more to say. 

Tomorrow we have the NFP (Non-Farm Payrolls) at 8:30 and the F_E_D's Esther George speaking at 1:30, a pretty light day except the NFP is a big macro fundamental event, I'm guessing it comes in stronger than expected or in line and the market doesn't take it well, that's just going by today's late day action.

Well it's still early so I'll check futures later tonight and let you know if anything significant happens.


EOD Update

I probably don't have to say it, but directionally we may have volatility based on the NFP, but chart wise, it's down at least to the lower end of the range.

Too bad it took so long.

After market posts coming

XLE / ERY

XLE (Energy) looks like it's coming down, not just price, but 3C. XLE is not my favorite for options right here, but the open ERY position (3x Bear Energy ETF) looks good, I'd consider it as a new position here or an add to, you just have to be very careful as Syria is a wildcard that can have obvious consequences on an Energy short.

Other than that, my point of view is that there's a window of probably a little over a week and if there's a time to pull back Energy, it's likely now so I'd consider this a short term swing trade.

I'll post some charts in a bit and continue to update the position.

TECL Update

I do think TECL (3x long Tech) ETF will come down, but I have no intention of closing the ETF long position, in fact if all goes well I may add to it in the next few days.

Quick Update

I really dislike days in which so much happens so quickly so late in the day.

The market averages have had short term charts in negative position for a pullback, the theme today though has been the 1 min charts have been "In line" or moving right with price which tells me the price trend (whatever it is) will continue until there's a divergence. FINALLY, we are seeing negative divergences in those 1 min charts (this is now more of a timing issue), as soon as I have a chance to post them, I will.

I'm still expecting this to be a pullback toward the bottom of the range I showed you and maybe a 1-2 day trade, but as always we'll listen to the message of the market and take what the market gives.

GLD Update

Earlier I posted GLD, I said I'd either add to GDX or use that allocation to open a position in gold long (for a quick trade, again I'm not expecting much moire than a day or two, but we try to take what the market gives).

Since I chose to add to GDX, I'll not be opening a GLD position, but I wanted to update it for you. Here's the last update...

You may recall the intraday 1 min chart was going negative and I welcomed that and hoped GLD built a slightly larger base to get a toehold on as well as see the 3C charts improve, you should at least look at the charts from the last update and compare to this update, I like the progress that is being made, although it hasn't reached a 10 min chart, but it has reached to a 5 min chart on the pullback I just mentioned.

 The last time we looked at this 1 min chart there was the red negative suggesting an intraday pullback, I hoped to see this as well as further improvement in the 1 min chart as it hit the lows again.

The 3 min chart has a larger positive on the second bottom of today as well

And the 5 min chart is the most impressive, leading positive at the second bottom.

This is definitely speculative and most positions will be until we get a pullback or that move higher with longs we already have in place.

GDX Add-To

I'm looking at adding to yesterday's GDX Sept. $27 Call. Earlier today, I updated GDX I mentioned the chart yesterday that made me suspicious that we may see a stop run (lower) before GDX can move higher and in today's update I identified that level as being below the recent low of $27.54 on 8/29. We have seen a run below that level, volume swelled as if stops were hit, it's still early as it just happened not too long ago, but initial indications are that those stops are being accumulated.

It's also a very parabolic move, I don't trust parabolic moves to do anything but return in the opposite direction in like manner (parabolic).

This is still a spec. size position, I wouldn't go chasing positions like this (1-2 days trades) in any size.

NUGT would be the long equity way to play it with 3x leverage or just GDX long

Trade: Adding to VXX Sept. $16 Call

I'm going to top this one off, I like the way the VIX futures/3C are acting as well as VXX and UVXY.

Essentially for this position to work, the market has to pullback.

FSLR Charts

These are the charts I promised earlier when I posted this FSLR update without any.

Hopefully you'll see why I'm taking the longer view with FSLR, it is one of the few stocks that I have liked and more specifically, thought it could stand on its own feet without the need to draft the market.

 This is the 1 min intraday, because we want to take profits in call positions in to upside momentum as we start to lose profits when volatility & momentum fall and time decay takes over. Because the main FSLR position (call) is out to October, it's less of a worry than a shorter expiration, this is why I wanted to warn members who might have shorter expirations that FSLR's upside move was going to lose momentum.

 3 min chart shows the stop run/head fake yesterday accumulated and further accumulation in to a flat price range as is often the case, this chart remains in line so there hasn't been any serious damage to FSLR, likely just some profit taking.

 The 10 min chart shows distribution at a head fake new local high and then a large accumulation phase, the upside move is preceded by a head fake move as we see to some degree or another about 80% of the time just like the head fake to the left before a downside reversal.

Ultimately the 30 min chart (and some longer ones) is in a large leading positive divergence, the head fake was the stop run yesterday, I wrote about it as being a head fake last night and we are seeing the start of the move. With October calls I can withstand some time decay, pullback or consolidation, I'm looking at the larger potential of the position and thus I chose to just leave this one open.

For new positions I would not chase here, I'd look for a pullback, if the market can help, you'll likely get a great set up.

***Market Update : HEAD FAKE?

Honestly, I have my own emotions that I have to battle just like anyone, I find the best way for me to do that is to take myself out of the process and stick with the charts.

Here's what I see and if I'm right, if the analysis of the last few days for a pullback is right and if the analysis for a strong upside move is right, we may be at a very important inflection point right now.

I'll use the SPY as an example, but EVERY major average has one of these right now.

The thing about head fake moves, especially when they are used in the context of a strong, recognizable technical price pattern is, they can move VERY fast,...

"FROM FAILED MOVES COME FAST MOVES" and a head fake is a type of failed move.

 Just so you know what I mean when I say, "Pullback to the bottom of the choppy range", this is the range, note stronger volume at the bottom/support where we have seen accumulation.

This is the current pattern in ALL of the major averages,

Technical traders take this to be a  consolidation/continuation triangle, in this case they expect it to break out to the upside, I don't know how they'd treat it given their bearish sentiment, but a breakout as we see starting here and then a failure is a "Crazy Ivan" shakeout and can lead to a fast move to the lower end of the range above.

ALL OF THE AVERAGES HAVE THIS TRIANGLE RIGHT NOW

 The SPY 1 min negative with a slight positive move, but not a positive divergence at the initial breakout above the triangle. A larger breakout would be easier to see whether there's stronger distribution meaning we go down or if price and 3C move in line meaning the bounce to the upside (the large one) starts now.

 SPY 3 min positive at the lower end of the range, the triangle and consolidation from yesterday/today at the green arrow and a 3 min leading negative divegrence.

It is possible the 3 min divergence is there only to keep the market from rising and forming a consolidation until they are ready to let it rise, it's possible, it's not probable.

 When we get a 10-min leading negative in a range, I fully expect price to pullback.

This is a 2 hour, long term chart, the scale at the bottom is in days so you can see that the overall primary 3C trend is bearish, but within that we have a slight positive, it is only slight because this is such a long chart (2 hours), but if we zoom in on that divergence...

This is what we get, a negative sending price lower, 3C in line with he price trend and a positive now.

This positive should lead to the "strong" upside move I've been talking about, however the chart above this keeps it in perspective, that price strength should be used in my view to sell short in to as the larger perspective shows we are clearly in a primary bearish/large negative divergence.

So that's multiple timeframes and expectations, but we have to start with the move around the triangle right now.

Since a move to the lower end of the range is not a large trade (day/days) it's not as important as a long position at the lower end of the range would be, but still the most important trade is selling short in to a strong move above the range so keep this in mind when deciding what risk you want to take and how to allocate dry powder.


GLD Charts

I'm not going to go in to all timeframes with gold, I'll just say that beyond what you see below which ends with a 10 min positive, at 15 mins GLD is nearly perfectly in line so that seems to be the transition point from short term trade to longer term trade as the 60 min chart is solidly negative.

SLV has some of the same signals, however at this time I have less interest in SLV.

 YG/ 15  min Gold Futures with a large relative positive divergence, in yellow I don't like the parabolic dip in gold futures, it's either a head fake move which I think it is and/or it may need a reversal process rather than a "V" shaped run straight up from this area, meaning GLD might have to move sideways a bit to get a decent toe-hold to take off from. On the other hand a head fake/stop run already has a base and can reverse quite quickly. My decision on whether or not to get involved with gold / GLD will likely have more to do with whether I see a stronger base and stronger positive divergences in to that base which can all occur with the time we have left today.

 This sharp 1 min positive in gold futures looks to me exactly like a stop run that was accumulated, even volume shot up as it should when stops get tagged.

 This is GLD (red) vs the SPY, you can see recent behavior shows an inverse relationship as in, "Gold is acting as a flight to safety trade".


 This is the trend of the 1 min chart over the last several days, it has been positive recently

This is the same chart intraday, there's accumulation at the lows and as price moves up some"steering" distribution, usually meant to bring prices back down to an accumulation zone at a lower level.

 The negative divergence at the left is just for study, it's a relative negative and I drew it in so you could see why, but the main feature is the leading positive as GLD moved below recent support, or a stop run. That looks like a lot of stops were accumulated quickly. It's not like there isn't good reason...
This would be an hourly chart showing the stops hit, volume is quite large, thus the divergence would be quite large. This is covered in the two "Understanding the Head Fake Move" articles on the members' site, these are a must read in my opinion if you want to understand the market beyond the dogma of Technical Analysis.


5 min chart from a relative positive to a sharp leading positive at the stop run.

GLD is positive to about this 10 min chart, 15 min is in line and thus the transition chart, 60 min is negative.

I'll let you know if I decide to enter, I have no problem with the divergences as they are strong, I'd just like to see a wider foot print on the base, although the point of that is so enough shares can be accumulated, with such a large stop run, that may be a moot point.

GOLD / GLD

I haven't made a decision about whether I might take a long position in GLD, remember that GDX (Gold miners) is likely to be fairly correlated and if I took a GLD position it would be in leu of a GDX add to.

Gold has been acting as a flight to safety trade recently so if the market is to pullback, Gold / GLD would likely bounce and there are good 3C signals developing there suggesting just that.

Not all bounces are created equal. When I say a "Bounce in GLD" I'm talking about a bounce as in a day or a couple of days at most at this point, when I talk about a "Bounce in the market", which I've been trying not to use that term because I'm expecting something bigger when the market moves to the upside (not a new primary bull market, but stronger than a day or two).

So any GLD long would be for a very short term position much like GDX at this point.

Again, I'll get charts of that up too, you can probably tell the market is starting to move faster as far as 3C trade as I'm getting much busier and probably have not answered your email yet.

FSLR Follow Up Part 1

The FSLR Oct. $35 calls are doing well in the green today after yesterday's head fake move. If I had September expiration, I might take profits as intraday I think FSLR is going to lose upside momentum and either consolidate or pullback, however for October and FSLR long equity, this chart just exploded and looks awesome, it's all about the head fake.

I'll have charts up next, but I wanted to warn, I suspect any FSLR consolidation/pullback will be market based as the market is responsible for about 2/3rds of the movement of any given stock on any given day.

If I were not in FSLR, I don't know if a great call position will set up, but I'd definitely be looking for any pullback to enter the position at least as a long equity position for a swing trade and maybe then some. If we do get a decent pullback that brings the premium down and makes sense, I'd even add to the existing calls if I had the room.

Charts are coming next, remember any pullback in FSLR would likely be market based, especially considering the VIX futures intraday we just saw.

Trade: VXX / UVXY

If I'm looking at VXX / UVXY long, then I'm obviously expecting the market to do what I've expected and that is to come down, tomorrow is a big day, Non-Farm Payrolls and although Initial Claims suggest NFP will come in with a decent print (which is bad news for the market), you just really never know especially with the amount of manipulation applied to the print with seasonal adjustments, arbitrary adjustments, and anything else they need to justify the tapering of QE.

In other words, it's hard to say what they'll do with the NFP, but I'm guessing it will be market negative, meaning probably a good report.

For now I'm going to enter a partial VXX call position, if it improves some more, maybe head fakes below an intraday range that is starting to look like a tempting stop/limit run area with even stronger 3C charts, that's when I'd add. This is going to be dealt with as a hit and run type position, in and out.

I think you could make some $ with UVXY (the 2x leveraged long version of VXX), although for such a short (anticipated) move, I'd prefer more leverage to make the profit potential worthwhile.

Some charts, remember earlier it was the actual VIX futures that first were positive while VXX and UVXY were in line so this is a pretty early entry in to a position, but I believe it's a strong probability, even if not the strongest (duration) position.

I decided to go with VXX Sept. $16 Calls

 intraday VIX futures 1 min are leading positive and looking better, the 5 min chart is already positive.

VXX is seeing a strong 1 min leading positive in a hurry, there's also an unfulfilled positive from yesterday.

We have migration to the next timeframe so the earliest signs are that the divergence is real and healthy (considering the scale).

The longer term 10 min chart is clearly negative, this would be in line with a market bounce, I know these multiple timeframes are getting confusing, but this chart supports my view (along with the ones above) that we'll see a short term pullback toward the bottom of the market's range in the recent last several days of chop, from there we should see accumulation of lower prices and finally a strong move to the upside breaking out of the range and being strong enough to turn the bearish retail crowd bullish, this chart would coincide with that move.

At 15 min VXX is positive again, this is a longer term trend which is the primary downtrend I'm expecting after a strong bounce, in fact the bounce is most useful to sell short in to, even though I have positions set up to take advantage of the upside.


Trade: Closing Sept. VXX $17 PUT ; May open VXX Call or UVXY long

This is for a short term move, specifically the one I've been expecting.

Personally if I were short VXX or UVXY I'd probably take profits here, this chop means we need to be more nimble in my view.

I'll let you know when and if I open a long VXX posiiton

Opening Indications...

You know what I'm expecting and in fact hoping for as it would give us a high probability on some additional short term trade openings. In fact, if things keep moving the way they are, I may make some decisions about some very short term downside plays.

We don't have an intraday smoking gun yet, but we have pretty good objective information suggesting our expectations are correct, although I'll say this market is playing out about as slowly as I can imagine, even considering the reversal process at each leg of rather tightly woven chop.

Thus far the market averages, first the higher probability, slightly longer intraday charts and the indications they were giving yesterday for a move to the downside (lower end of the choppy range), then today;s intraday charts which are fairly in line. There are a few interesting Index Futures and perhaps Treasury as well as VIX futures, not quite in VXX or UVXY, but actual (real) VIX futures.

 First the higher probability, short term move (as in down toward the lower end of the market's recent choppy range where accumulation has been occurring).

IWM 3 min leading negative, if there needed to be a head fake move, which I don't think, it's right in the area.

 IWM 1 min intraday, like I said, no intraday smoking gun yet as the 1 min chart is nearly perfectly in line with price

QQQ 2 min leading negative suggesting a move to the downside short term

QQQ 1 min intraday is perfectly in line with price, thus there's no intraday divergence for today thus far.

SPY 5 min suggesting a downside move

This is the only one in which today's intraday 1 min chart is negative, so I'm looking for the other averages to join.

Momentum indicators are slightly negative, really though there's not a smoking gun here either.

The NYSE TICK's trend thus far this morning, pretty mellow except note the move below -100 to nearly -1250, that's extreme and a lot more stocks ticking down so the internals intraday may be coming lose to create some downward movement.

My Custom TICK Trend Indicator vs the SPY, here we do see a trend in the NYSE TICK, it rose with price, now it's falling off, this is a unique way to look at TICK data, no one else is using this as its my own indicator, but it gives the data a new meaning as there was little we could glean from TICK data above, but here (without manipulating the data, just looking at it differently), we can see a clear trend developing on this 1 min chart.

Index Futures
 ES (SPX Futures) 1 min is looking a bit negative, I wouldn't enter positions based on this, it's the 5 min just like the averages above (the slightly longer, more important charts) that are showing the probabilities of that downside move to the bottom of the range, don't forget, "if" we get there with accumulation - a constructive pullback- then I fully expect to see a head fake break below the range BEFORE we see a move to the upside and I mean the STRONG upside move coming out of the range.


ES 5 min as mentioned, the 5 min charts show clear leading negative divergences.

NQ (NASDAQ Futures) 5 min the same thing

TF (Russell 2000 Futures) 5 min the same thing, that's good confirmation especially taken with the market averages.

 VIX Futures 1 min This intraday VIX futures chart is getting interesting with accumulation, that would suggest a move higher in VIX futures and that means a move lower in the market as protection is bid.


10 year 1 min and as shown this a.m., the 10 year treasury seeing a move to the upside would indicate funds would likely floe from the market to treasuries which would help a pullback.

That's what we have to work with thus far.

Gold Miners Update: GDX / NUGT / DUST

You'll have to excuse the charts, for now they are plain screen grabs as the normal software is re-initializing.

Yesterday GDX / NUGT (3x long gold miners) were featured in this post...

I liked them and in fact opened a GDX September $27 call position yesterday.

In the analysis of GDX which is the first link above, I showed several charts as my reason why I liked GDX for a short term move up, but I also showed a chart, in fact this one...
And I said this about this one chart (3 min negative)...

"This 3 min chart shows where there was heavy distribution in GDX/NUGT on the open of this week. Today's divergence here is odd, but it's confirmed in at least 1 of the other 2 assets (DUST/GDX), I have a feeling this would be for a head fake move."

And thus far this morning...
 Volume is there to suggest a stop run, now whether it's a true head fake or a real break...

It's early still and so far we have the 1 min intraday chart (where the divergence would first show up) leading positive so it looks like the stopped out shares that create cheap/available supply, thus far have been accumulated.

The longer, more significant probabilities and heavier underlying flow of the 10 min 3C/GDX chart shows as I did yesterday that we saw a head fake gap up on the open of the 27th that was immediately sold in to as 3C is leading negative, that's a head fake move and note it came right before a downside reversal. Since we have a leading positive divergence, so the probabilities already tell us that this will be a head fake/stop run in GDX, however until we have more charts beyond 1 min confirming it, we don't have solid evidence, furthermore there's an additional level at the orange trend line that could be hit as well.

I'll be looking for the 2, 3 min, etc. charts to go positive and confirm higher intraday probabilities that this is the head fake run I suspected we'd see in yesterday's analysis. IF THIS IS, I WILL BE ADDING TO THE GDX CALL (LONG) POSITION AND I THINK NUGT LONG WILL BE A MORE INTERESTING AND WORTHWHILE POSITION, STILL SHORT TERM AND SPECULATIVE THOUGH.