Friday, March 22, 2013

Monday Bias

I'm looking and I my find more, but initially, unlike the good calls we have had from the VXX this week, the market in many respects looks very much like it i on hold and that is the very short term timeframes only, mostly 1 and 2 min, like I said yesterday, there's a shiny veneer on the surface, but below it's total rot, my father who was a general contractor called them "Ginger Bread Houses", people flipped these houses, but they just painted them, planted some new grass, but didn't address anything structural, certainly not the roof, there was nothing buy a shiny facade and a few months later when everything in the house was leaking or breaking down, you understood what a "Ginger Bread House" is.

That is what we have here, except the shiny facade right now even looks very uncertain in to the weekend. I think if there is ANY WAY, they can make it to new SPX highs, they try, but there's nothing in the tank right now, so certainly nothing after they get that blue ribbon.

Trying to Quickly Cover QQQ April Puts

The market is highly correlated directionally, if the Dow is down, 4 of 5 times or more, the SPX will be down, the markets follow sentiment so although I wanted to cover the IWM April Puts as well, the QQQ charts should  be enough because you're not going to find that much difference in the big picture or the timeframe we are looking for  in the trade.

Short term charts don't really matter that much right now because they aren't going to be relevant in a few days for the most part, this is what is important and the last chart will be hard to digest, but this market is a bubble, there's no doubt, it's just an asset-less bubble inflated by the F_E_D so we have never seen anything like this and the unwind of F_E_D policy or the popping of the bubble is always the most dangerous part. I call this entire rally since 2009, a "House of Cards built on the sand at edge of the tide line"

Just as a quick review of the shorter term charts, 1 min through 2 min are in line with some slight positive bias as of 3:30 low. At 3 mins and beyond, the charts are all negative as are the futures for the NASDAQ.

 This break of the Trend Channel is where I said and still believe, the back of the trend was broken, remember the date 3/5 coming out of that area.

 On a 5 min trend of 3C, here's what happened around 3/5 a leading negative divergence, not good, basically it appears every transaction up here is toward distribution/ short selling

 15 min chart since the accumulation that started the November low cycle, then accumulation that started the trend 1 cycle that was much bigger than anticipated, but probably about as strong.

 30 min chart and look at the date in which the character really changes, it's also bad before that, but I thought this date was interesting.

5-day long term chart showing 2007 distribution and distribution at the end of QE1, since the 2011 August plunge, this market never recovered.

GOOG Update

There are no GOOG calls or long positions, there is an equity short position (Full size) and a fairly large April Put position, much larger than speculative (broke my own rules). Here's how I see GOOG, it is very similar to AMZN, but I didn't want to reduce any short positioning as far as the balance of the portfolio goes and GOOG seemed like a good choice to keep in place.

Have you noticed how aggressively stocks are being sold off on bad news whereas in the past the reactions were very subdued, sometimes surprisingly apathetic. Now you see the CATs, DEs, and especially ORCL's of the market just getting monkey hammered and this fits perfectly with the breadth readings showing fewer stocks able to hold their 40-day moving average or some multiplier of that for momentum stocks and we see more and more stocks moving below their 40 and 200 day moving averages and some bearish multiplier of that (1 or 2 standard deviations below the averages). The bottom line is the market is exhibiting a lot more fear, sell first, ask question later and for good reason.

In any case, about late February and even before at early February I said the market will be getting more volatile and with that, more unpredictable. The big moves will come on a gap down in one day and if you missed it, you missed the biggest part of the move, we saw this with High Yield Credit taking out the full 2013 gains in 2 days, no matter where it is now, those longs were burnt.

So I want short exposure balanced in my portfolio as the data right now from Cyprus hasn't been discounted, it changes by the moment and we hear about it a few nano-seconds later than the algos, it's an event the market can't discount or predict, just like Italian elections or Greek for that matter. At any time we could have a black swan/Black Friday event no matter how much the Central banks say they have us backstopped.

As for GOOG, I still think probabilities are higher for a bounce before the real strong downside, but I do not think the bounce is a high probability trade worth trading.

 GOOG daily is in a precarious position, it has broken the trendline which use to be enough in Technical Analysis, but now we see all kinds of volatility shakeouts after the initial break to shake out new shorts. We also have the first head fake confirmation level just below, I think it is probable that this support level is tested and used to run stops before a move higher, it only take a few minutes, but in any case, the move higher is the main point.

 Our X-Over Screen is super close to 3 confirmed sell/short signals, I think it's just waiting on some volatility and this should be confirmed probably by mid next week.

 The 9-day (this is because it is the longest timeframe before monthly) shows my custom 'Buy/Sell" DeMark inspired indicator with a buy at the 2009 lows, a sell at late 2009, early 2010, a 2012 sell signal and one right now.

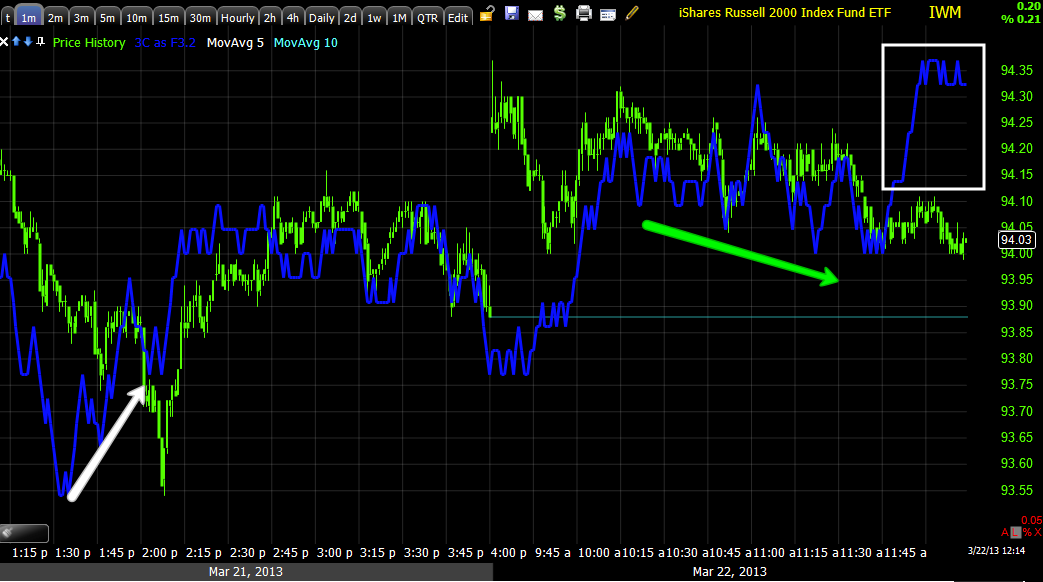
 The 1 min chart looks pretty good, I said damage was  done yesterday and it was, but today there has been some positive short term changes.

 The 3 min chart shows a number of small areas, this typically shows up as an accrual of accumulation on a longer timeframe, they are essentially accumulating the lows and the larger position is seen on a longer timeframe/trend.

 Here's an example on the 10 min

 And a better one on the 30 min, however if you think "What gives? This looks pretty bullish?", then just wait and look below.


 This 60 min chart is leading negative, what is impressive is how fast and how deep, this tells us what the real longer term, strongest trend has been in underlying trade, so I want to sell in to any strength or short it.

If that wasn't enough, the daily chart confirms it and it does so as the worst negative since before 2007.


AMZN Update

GOOG and some others are coming as well.

AMZN is a really nice example of our philosophy of, "Let the trade come to you". We don't want to chase trades, we want an idea of what we'd like to see that would give us an edge in the trade and then see if it happens (of course this is based on some evidence in the first place and continues to be). In this manner we get the best entries with the lowest risk and very high probability trades, the interesting thing about AMZN is that the long / call position is only a minor trade in a bigger trade that will be short and we are using the upside to let the trade come to us for this larger short sell trade, this comes back to our, "Take what the market offers" concept, if the market was offering us a ride higher to our final destination in AMZN, the probabilities looked good, why not take that which the market was offering?


Charts...
 The yellow gap area is really the minimum target I'd like to see on the upside as far as adding back the equity short shares that were closed yesterday (half of the position to add at better levels) and possibly enter an options trade if it seems like the right tool and timing. Today AMZN went from the red column to a nearly +1.5% gain, this is not like recent weeks/months where assets moved 0.20% and everyone lost their minds in a panic that the market was moving against them (not here), so this is a good reversal and above resistance with a possible Hammer Candlestick (upside reversal signal).

 THIS IS NOT 3C, but I wanted to show you what a Rate of Change Indicator applied to price could do, it called a bottom and the recent consolidation, you can apply it to price, other indicators, as a matter o fact I think OBV (On Balance Volume) is a horrible indicator, nut apply ROC and use those signal, it actually works here and there. So keeping it simple works wonders.

 This is the 3C intraday chart.

 The more important 5 min chart has a strong leading positive divergence so I think we are probably good with the April Calls in AMZN.

We even see a little of this on a 30 min chart, but remember the bigger trade is short, we are just waiting for AMZN to come to us.

So far, so good.

I'd Be Paying Attention if you Are still long SPY calls

The 1 min 50-bar was broken as a trailing stop, the 5 min is close, momentum is fading a bit, I'm not saying you should sell them right now, just to be paying attention.

I see R2K futures hanging in there, ES and recently NQ don't look very good.

On a longer term basis there is probably more upside as I can't believe they will let the market go without hitting the SPX highs, there's too much money there and they have been trying hard, which should tell you something about mass psychology - how hard they have been trying and how hard it has been to get those few points.

In any case, my viewpoint is, "If there is more upside for the new high, I think I can open a new position at better levels on an intraday pullback".


SPY March $155 Calls Closed-Fill

Remember earlier I closed half the position, this is what was left, the fill was $1.29 so the gain was a bit better at +31.6%- not bad for a day, this is what I mean whwn I say, "Take what the market gives", not every trade is going to be a swing trade or a trend trade, the market dictates the conditions, the signals give us high probability trade ideas and using the right vehicle makes the trade work or at least gives it the highest probabilities, in other words, STAY FLEXIBLE, NIMBLE AND OPEN MINDED.

PLEASE, IF YOU END UP BUYING AND SELLING THE SAME DAY OR SHORTING AND COVERING THE SAME DAY, IF YOU MAKE ANY DAY TRADES, PLEASE BE SURE YOUR ACCOUNT IS REGULATION "T" COMPLIANT.


Closing the Rest of yesterday's SPY Calls

I'm closing these now because I don't want to hold them over the weekend and I don't want to be distracted by them, if you want a trailing stop to try to get some more juice out of them, check these two trailing stops.

 This is a 50-bar moving average of SPY on a 5 min chart, this is to give it the most room, but I prefer keeping momentum so...
This is a 50 bar version on a 1 min chart, sometimes momentum is worth more than slow creeping higher prices.

AMZN Moving Into the Green

You know what AMZN's price looks like, let me show you what some of the underlying factors look like and why I think this could be an attempted gap fill rather than just a short term bounce (however as far as trade management, it still may be wise to phase out of the trade with so many uncertain events).

 AMZN  intraday starting to ramp


 The momentum screen looks very good, everything is positive or going positive.

 1 min intraday is in line with price which is good.

 2 min is leading positive which is better.

And we have positive migration out until at least 5 min charts.

So far, so good.

AMZN April Still looks good

Even though I'm hoping and expecting a quicker move in AMZN with the call position opened yesterday, it's like the GLD calls, the principle was the same, looking for a close move, but allowing some leeway incase it takes longer than you think which is almost always the case in the market.

I like what I see today and there may even be a chance to close the position or partial profits today.

 The intraday chart today is responding well to price


 The longer tern=m 2 min intraday I believe may be showing us accumulation on the right side of a "W" base (small base).

 The intraday 3 min chart, instead of this being 2 separate events, I'm thinking they are 1 base.

AMZN will likely want to fill that gap in the $274 area, a "W" base of this size would be about the right size for a positive divergence to do that and this 30 min chart seems to hint at the two lows being part of the same short term base.


Market Update

There are a few more divergences between the averages right now, some are growing.

 DIA intraday 1 min is NOT looking good at all as explained in the last post. The 2 min is not this bad, but it is negative as well which suggests pullback more than lateral consolidation on an intraday basis.


 1 min IWM is starting to build a new positive divergence, it may take a little while longer to complete, but I do think probabilities are higher that the IWM will lift and perhaps lift the rest of the market with it at some point not too far off intraday today.

 QQQ 1 min is in line so that's better than what we are seeing in other averages.

 SPY 1 min, I feel good about the management of the calls so far, I'm hoping for an IWM sponsored push that inspires the invisible hand to try to make that new nominal high.

SPY 2 min has a decent positive from yesterday so I think the chances that there's till inventory or "fuel in the tank" are pretty good. Just like most of the week, the SPY is tracking the Euro and to lesser extent the EUR/USD fairly closely.


SPY Call Position/Fill

Here's what I'm not liking about the SPY, the Q's are holding the best on the 3C charts followed by the R2K, not actually all that good, but better than the SPY, the DIA is almost as bad as the SPY.

 ES-I think it's pretty obvious what I don't like here, which makes sense as I said yesterday the 1 minute charts were like a shiny veneer over a core of rot.

 SPY 1 min intraday chart...

 Half this position was closed at a fill of $1.28 for a +30.5% 1-day gain (actually less). I will be watching for the other half.


Closing 50% of the SPY March $155

I don't like the looks of ES.

Correlated Factors

According to CONTEXT, there was overnight asset pricing that helped ES this morning, that if fading off, the SPY Arb. Model is also washed out, I do see some usage of yields, maybe a little credit, but not like earlier in the week, I don't think the credit markets want the over-the-weekend risk and there's some EUR correlation, not as tight as recent days.

I don't like the intraday SPY chart, but as mentioned in the last post, it is at the first resistance zone, other averages such as the NDX and R2K are holding up well INTRADAY, so it's early, I thin there's still a good probability of some higher prices, but it should be a choppy ride.

 CONTEXT for ES overnight shows risk assets were tracking ahead of ES, that started to wind down as ES started moving up.


The SPY Arb. is flipped, risk assets right now are not helping the SPY, that of corse can change several times a day, but my gut feel is that toward the end of the day, risk assets are going to sell off more and more unless there is some grand solution from the EU before the close, which of course is always to be faded as they never work.

A Look at the SPY

At last check we had at least a +15% profit in yesterday's SPY calls, I think they'd love to see a new SPX nominal high and I think they realize that today might be the last day to get that done before all Hell breaks lose in the EU over Cyprus.

I wouldn't blame anyone for taking 1-day double digit profits at any time, but here's what I see so far.

 SPY daily, the SPX has a long way to go from here for a single day.

 We are coming in to some intraday gap resistance so things may lose a bit of momentum for a little while.

 Yesterday's 2 pm leading positive divergence and other signals earlier were obviously correct, so far opening trade is in line, it needs to see more confirmation though.

As for momentum, so far we look healthy on that front, momentum, RSI, MACD and Stochastics are all helping out intraday.

You might even consider taking partial profits here and there if it is feasible.


I hate to do this

I get my news from several sources, the left, the right and try to find the truth in the middle, but this is such a large, detailed and incredibly dynamic situation, that before you can get the analysis done and posted, it has changed 180 degrees so I'm going to do what I REALLY hate to do and give you the bottom line copy and paste from another site, basically the things I agree with and foresee as being relevant to our purposes.

As of about 3.5 hours ago...


Europe, Russia Reject Latest Cyprus Bailout Plan Before It Is Even Voted By Parliament


 FT reports, "European officials rejected Cyprus’ plans for an alternative package to save its banking sector and remain in the euro, starting a fresh round of talks with the island nation’s government on Friday."

The latest plan involved winding up Laiki, the island’s second-largest lender, and split it into a “good” and “bad” bank, with larger deposits over €100,000 folded into the latter. Deposits up to €100,000 would be guaranteed and bank jobs were to be safeguarded. 

But several of its elements – such as raising €2bn by nationalising the state pension fund and issuing bonds based on future revenues from offshore gas deposits – continued to be seen as non-starters by Brussels and Berlin.

“There was some discussion of going back to the original plan of a bank levy, but there are objections from the central bank,” said one person with knowledge of the talks.

The dismissal of the plan comes as time is running out for the island nation to agree on a plan to raise €5.8bn and avert financial collapse before the European Central Bank suspends funding on Monday.

There were already long lines at cash machines in Nicosia on Friday morning and one Cypriot official summed up the sense of desperation saying: “We are waiting for a messiah to come and save us, and of course, there is none”.

Indeed, Angela Merkel, German Chancellor, on Friday told lawmakers that the nationalisation of Cyprus’ pension funds was not acceptable.

Russia Crushes ALL bailout hopes

From Bloomberg:

Russia spurned Cyprus’s offers of assets for a bailout as the island nation’s lawmakers debate legislation to avert a financial collapse.

“I think we are not able to get the support that we wanted to get,” Cypriot Finance Minister Michael Sarris said in an interview after checking out of the Lotte Hotel in downtown Moscow. “But we must go back home because things are getting serious.”

Russia has ended talks with Cyprus and will decide on participating in restructuring debt after the so-called troika overseeing euro-area bailouts, makes its decision, Finance Minister Anton Siluanov told reporters today in Moscow. The troika comprises the EU, ECB and International Monetary Fund.


Bottom line: Russia wants the EU plan and Cyprus to fail, then come in and sweep up assets on the cheap.
Europe will not agree to any plan that does not promote "debt sustainability", i.e., impairment of Russian oligarch savings, which in turn is a non-started in Cyprus, and would lead to an immediate trade war with European energy supplier Russia.
That is, in a nutshell, the stalemate as we head into the weekend, and a Monday Cyprus bank holiday, during which the ECB has issued the supreme bluff, and said it would cut off all the funding to the small island.

Pre-Market Futures

Hopefully we can make some quick money on yesterday's calls.

Here are the futures...
 ES with a negative divergence starting, I think because of the EUR/USD's posture...

 NQ the same, we will gap up.

EUR/USD was supportive earlier, but looks as if it may fail, i'll be looking for momentum to sell calls in to.