Monday, October 7, 2013

EOD Odds and Ends

Although I said I didn't think the market looked particularly strong today and wasn't very impressed, the late day market walloping the market took didn't seem to have roots in underlying trade, it was pretty difficult to find anything responsible for it as it acted VERY much like the instant discounting of a fundamental event (an event which the market didn't see coming and has to discount, these are fairly rare, 9/11 was one of the biggest instances of fundamental discounting and of course the Syrian issue when Obama said a strike was imminent and to some degree the debacle in Washington right now).

EOD trade...
The EOD trade in the SPY, very linear and on volume, has the hallmarks of a fundamental discounting event, the obvious place to look was D.C., but not much changed there. I suspected maybe some AA earnings leak, but it would have been way more evident in AA which it is not.

Still, the market is well within the reversal process range. To the left you can see an abnormal "V" reversal or an "Event", this is the F_O_M_C Knee jerk reaction I always warn of. Otherwise, the SPX is still within a reasonable range.


 The daily SPY looks like this as of the close.

The Culprit to EOD trade activity appears to be Interactive Brokers releasing an increase to 100% margin maintenance schedule, that should tell you what they think about the market going forward as well as the deep liquidity problems I suspect we will experience as HFTs (liquidity providers) are shut off as the market slips.

 This is the release above...

These are also some of the momo stocks that are part of the reason I put the new "Most Shorted Index" vs the R3K in among leading indicators.

On other news, when we get a move down, as you know I like to check our equity tracking portfolio for its relative performance vs. the market. I am not a believer in modern portfolio theory, in other words, I'm not a believer in having too much diversification, I want enough to actually diversify between groups that will rotate, but I don't want several stocks in the same sector for that level of diversification. However, because the Tracking portfolio is just that, stocks I have mentioned and put out as positions, I track them to see how they are doing as I don't know which members might have taken which positions.

In other words, the list is so diversified and large because of its purpose, I would not expect very good performance from it as it is WAY over-diversified.

However I'm very happy to see the results as the last several times the market has been down, the tracking portfolio is outperforming the market on a relative basis by about 700%.

The new week just started, but for the new week we are ranked 10th of 758 competing portfolios, but more importantly our relative performance vs the SPX is about 700% here.  These are almost all core shorts so the SPX being down 0.75% (there's a slight delay) and our core shorts on average being up 7.25% is an excellent sign for when the market really takes a licking, it shows we are entering the right positions at the right time with the excellent risk:reward ratios.


NUGT

Instead of 5 charts of each asset (NUGT, GDX and DUST) for the sake of time I tried to mix them all in in different timeframes as there's pretty good confirmation between all 3.

Earlier today I wrote about precious metals (silver and gold) as well as GDX (miners) and showed some of the correlations and differences, not surprisingly, the underlying trade in GLD does not look as good as NUGT. One thing I suspected in the earlier article was that GDX would behave a little more like the market than usual in both shorter and longer term trade, not behave exactly like the market, but less of the typical GLD correlation, the post is here.

 The reversal process is a pre-requisite and there's a decent one here.

 NUGT 30 min

GDX 15 min

DUST is the 3x leveraged inverse or bear ETF of GDX so it should have the opposite signal-negative),  10 min negative

GDX 5 min positive.

Adding NUGT (3x leveraged long gold miners ETF) as a trading position

This will be about 1/2 the size, maybe a bit more for a round lot, of a full size trading position.

NUGT Long Looks Pretty Good

I already have GDX options (calls), I'm going to take a look at that exposure, I'd like to have some NUGT long. I'll also get some charts up, NUGT, DUST and GDX are all confirming.

GOOG Update

There are still some nice looking GOOG charts for a short duration leveraged long (call options), those charts include the 2, 3, 10 and 15 min charts. The chart that I have essentially made the line in the sand is the 5 min chart, I'd like to see that one connect the intraday charts with the intermediate 10-15 min charts, I suspect that a stop run would be needed to accomplish that and thus far the 5 min has not improved and other than a smaller run this morning, we haven't seen the kind of volume I'd like to see, which is what I believe would be needed to get the 5 min chart in to place.

The bottom line is I'll stay patient with this position and see if it comes around. This is for a short duration leveraged long trade only. The longer duration core equity short is not being addressed yet.

AA Position (Long) -Earnings Tonight

I usually wouldn't do this and I'd prefer options, but the premium before earnings is often so high that even with an excellent result, it's hard to even break-even. As usual, AA kicks off Q3 earnings season after the bell.

This will be an AA equity long trading position, about 1/2 the size of a core position. The reason I like AA here is because of the consistiency between various timeframes using the 3C trend chart.

 This is a 60 min chart, what I noticed was the divergences are consistent through multiple timeframes, they appear at the same areas.

 30 min chart

15 min chart which looks sharper as it should

5 min chart

1 min chart

Although it looks like stops have been recently run, there are two very clear levels that stops are likely amassed below, at $7.84 and $7.82.

As a trading position and on earnings, I'm not going to rush to any judgements tonight, good or bad, but rather wait for regular hours trade tomorrow, but that's just my preference.


VIX Futures / Wiggle Room

I'll say it again because it is worth repeating, I'm not impressed by this market's internals/underlying trade at all. Yes, there has been afternoon improvement as envisioned Friday, but there are some horrible looking averages out there, one of the worst is the QQQ, I'll show it to you soon. If the entire market looked like the Q's, I'd be moving aggressively to tidy up short positions.

The USD/JPY is definitely an obvious market driver for upside, its divergences however are on 15-60 min charts which means they are strong, but it also means they are not in the area of an immediate reversal. There is some 1 min intraday $USDX 3C signals that are the best of the day, but those would still need to strengthen and hop over to the 5 min chart. It is interesting though that the 15/60 min charts look as good as they do, especially in light of Goldman's call to the contrary late last week.

For now, the VIX Futures are showing some signs of deterioration that may afford the market some wiggle room to the upside, I'm not suggesting an immediate launch to the upside, but as I said, the way they are moving allows the market some room above it. Whether TLT and HYG join to form the positive SPY Arbitrage is unknown, but the 30 year treasuries are bending toward that probability slowly as the day progresses.
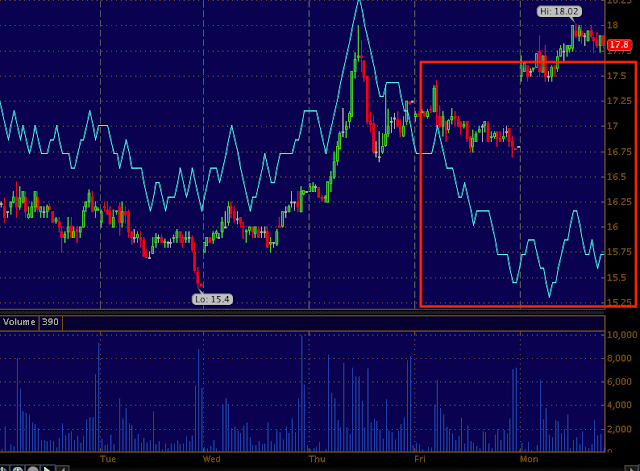
 The 2x leveraged "Short Term VIX Futures", UVXY intraday 1 min chart is seeing more and more negative tone. Pay attention to the 3 different VIX assets, especially around the 5 min mark or thereabouts.

2 min Leading negative.

VXX is the non leveraged version of UVXY above, this is the 2 min which is very similar and fading intraday.

 VXX 5 min, pay attention to the negative divegrence here and compare with the actual VIX Futures 5 min.

The 15 min chart had been where the trouble was with VIX Futures, as the short term charts start looking like the 15 min chart we know the probabilities are growing of a move to the downside.

 The 15 min VIX Futures looking worse than Friday.

This is the 30 year Treasury Futures 15 min chart, this is very similar to TLT so this is the strongest negative in 5 days.  The VIX and TLT moving down are market positive just as the $USD/JPY moving up is market positive.

$168.50 Key Level for SPY

Ever since the 23rd of September which is a significant date for underlying trade, the SPY has maintained itself under the 60m/50-bar moving average. I'm surprised frankly it has went on this long, but the level of the average is now $168.50, also a psychological number and of course a rather flat range of some duration.

Only late Friday did we break above the average for 2 hours, but you saw underlying trade late Friday, distributive.

If you have the ability, I'd at least set some alerts around the level.

Market Update

It took a while to get the NFLX post out, but I think it's worth it.

As far as the market, as seen earlier today the R2K Index futures look pretty good intraday underlying trade and actual trade is right in line with Friday's expectations of continued consolidation early Monday and perhaps a change late in the afternoon as the 5 min charts were not negative on Friday.

"My initial impressions are for some sort of consolidation Monday, perhaps just early in the day. The consolidation can be through time or price. I don't think it will last long and if there are well set up call positions, they should be at their best Monday. The reason I don't think a consolidation will last long is because the charts to support a longer consolidation aren't there, the process is mature."

The 5 min SPY chart is gaining 3C momentum in to the gap down today, the Q's look REALLY horrible, but even intraday charts are improving there, the 5 min IWM never confirmed the gap down and stayed in a leading positive position and the DIA is seeing some strong charts like the 3 min leading positive, so far this is exactly in line with Friday's expectations for today or early this week, but that was Friday and we still have to keep an eye out for any changes that deviate and are cause to rethink short term analysis.

Although VIX futures are up as they should be due to correlation, the underlying trade that was falling apart late last week is worse now. VXX and UVXY are showing similar signals.

I'm not saying intraday trade looks strong by any means, it doesn't, it just has improved. I don't expect we will see strong underlying trade at this stage.

Probably the best looking asset that can move the market at this point is the FX pair already mentioned, USD/JPY, the same one Goldman has a current short call out on right now as it is at the low end of its range. The 15 min positive is the USD and 15 min negative in the JPY that suggest the USD/JPY moves up and supports the market (and stops out those who took Goldman's advice)  are now divergences found on the 60 min charts so they are stronger now.
 $USDX 60 min futures leading positive...

The other half of the currency cross (carry cross), the JPY with a leading negative 60 min chart.

This is probably the most bullish asset for the market right now. I'm going to look around to see if there are trades that have outstanding probabilities, but as I said above, this is not a strong looking cycle and as such, any positions taken from here must look outstanding on their own.


NFLX Trade set Up

Looking at NFLX, my judgement tells me there's probably a little better entry, my gut tells me, "Who cares?" I really don't like the looks of this chart. NFLX did everything it had to do to form a great double top in the new technical analysis. Before everyone started using TA, a double top would see the second top typically fall just short of resistance from the first top, before Technical Analysis went mainstream. 

The emotional aspect of why these patterns acted like the way they did was very easy to understand and Technical Analysis had it right (emotionally) until it became so popular that Wall St. knew how traders would respond to each price pattern as they have been published in a large percentage of every T.A. book over the last century-literally. It's like Pavlov's Dog/Whistle, traders are so stuck in the dogma of all of these books that they don't see what's actually happening and how that dogma is being used against them.

In behavioral science, one explanation of  this is known as "Availability Cascade",

 a self-reinforcing process in which a collective belief gains more and more plausibility through its increasing repetition in public discourse (or "repeat something long enough and it will become true")


This is a classic Double top, they're usually pretty big, stretching over a year or more, but this very same concept holds true even if this were a 5 min chart or if you flipped it to its mirror opposite.

Buyers who got caught near the top as price started heading down or even those who have substantial profits tend to hold, there are a number of biases that could be cited, one might be the "hot-hand", which is the belief that a person who has experienced success has a greater chance of further success in additional attempts. We also tend to place more emphasis on good experiences than bad in our memories (just talk to someone who recently split from a significant other). The point is, they hold and as the stock loses more ground; they had a substantial run as a double top must procede an uptrend and they are loathe and slow to recognize a change because of past biases with the stock. They start to double down or figure there must be a bounce coming. In truth, the market has so much information that anyone can justify any belief they want by simply picking and choosing how to weight information which is clear bias, but that's what we do.

Many of the people holding at a loss tell themselves, "If I can just get back to break-even I'll sell", which is rooted in the Market maxim, "Do you want to be right or do you want to make money?" An example is taking a loss as one would by holding this stock as it heads down. Most people will hold this same stock they lost their money in rather than selling it at a loss and using the same proceeds to enter a better looking trade that has a higher potential for generating returns and this is because people don't want to be wrong which is based in our upbringing and experience in school which is a totally different subject, but suffice it to say that an 80% success rate in school is considered mediocre at best, in the market it's almost unbelievable and most people apply that bias of "success" to the market which is unrealistic.

In true supply/demand which is driven by emotions and that is what Technical Analysis originally was so good at identifying, as price rallies back up toward the former top, people who bought at lower prices than the ultimate top start selling. To make a long process shorter, by the time price is near resistance, most people have been through the emotional wringer and are willing to finally get out at a small loss which kept the stock from ever breaking through resistance .

Wall St. knows this, they also know that if the stock does break through resistance, it is viewed in a brand new light and is to be bought, this is where we need tools to determine whether it's a true breakout or an engineered one (head fake).

For NFLX...
 NFLX is a classic version of the new "Double Top", you very rarely see a textbook top anymore and especially not in a popular stock like NFLX with a lot of institutional activity.

Note the healthy volume which is expanding as price makes the first high, that is what volume is supposed to do, but near the top volume starts falling off and declining (yellow vertical line).

After the stage 4 decline phase there are two (as is common) capitulation events, this is when the majority of longs finally throw in the towel and sell en masse creating volume spikes and typically gaps down. There's almost always a second capitulation event after the first and below the first one's lows, then the process of a stage 1 base can begin again as there is substantial supply at cheap prices, typically overly cheap. 

Just as I said you could flip this price pattern to its mirror opposite as a double bottom, you see the second bottom in the base (which historically held above support) now breaks it as the base matures, the head fake move. 

Look at volume on the second run, it looks much different than the first and is not healthy.
 These are the 4 stages of a cycle in NFLX on a 5-day chart, note the current candlestick which is a bearish "Shooting Star" reversal candlestick just above former resistance.

This is the longer term 3C trend version showing the distribution of both tops, the accumulation of the bottom and how the second top is leading negative.

 This is a 60 min chart showing both longs buying a breakout as this is the resistance of the double top and their stops being hit just below that resistance where they always place them. I see or saw a possible triangle forming as I captured this chart, volume is correct for the price pattern. Since I captured this chart, the triangle has filled out more and it is a triangle, a small one.

 The 1 min 3C chart

The 10 min strongly suggests heavy distribution on the break above former resistance or the "Double top, most technical traders no longer view it as a double top, but a breakout. This is how and why Wall Street manipulates these patterns, it doesn't take much as they are already close on their own and it creates enormous demand they can sell or short in to as technical retail traders are buying the breakout as volume prove above on the 60 min chart.


This is the 4 hour chart of NFLX and you saw the multi day.

I'd say NFLX is a short here, but with that triangle and short term market probabilities, it's likely there's a slightly better entry on the upside, but I'd consider this as one of the better looking shorts for a core /trend position.


GOOG Update

Since GOOG was used as the example for this weekend's video regarding short duration leveraged longs and long duration core shorts, I thought I'd update GOOG as the first part of that trade would be a leveraged (call options) long. As far as the core short, on an intraday basis or day to day, GOOG looks like it could be had at a better area and I'll show you some, but if you look on a daily basis and are looking at the big picture, this probable upside move is so minor, it's almost irrelevant, so how, if or when you chose to pursue a GOOG short or hedged strategy depends largely on what timeframe you prefer, obviously the shorter more tactical allows for better entries with less risk while the longer term view allows for a good entry with not much risk and the added bonus of having the short exposure because on a daily chart alone, GOOG is a short here and now in my view.


 The first move down did hit a round of stops, but IO suspect there will be another move under $866.10, at least I'll have an alert set for the area.

This is the 3 min chart, you may recall from the video yesterday that the 1, 2 and 3 min charts are all positive as well as intermediates like 15 min, it's the 5 min chart I'd like to see close the gap between intraday and intermediate before entering any leveraged long positions.

A 15 min chart reveals two smaller rounding areas, one completed around the 30th and one now, they look to be part of a larger rounding process.

I traced out the same rounding areas and you can see how insignificant they look on a 60 min chart, but I think to get past the second target of $905, the base would need to be that large.  For tactical entries, personally I would prefer to already have some short exposure to GOOG and add to it above $925, but I probably wouldn't even start looking or expect to see much until we pass the first two upside targets.

Gold, GDX (NUGT) and Silver

This update of the PM's as well as miners seems to confirm the short term market price action and also points to the same bad ending for the market.

 SPY / GLD Correlation (green and red respectively) on a 60 min chart seems to be an inverse correlation, but the most important data right now is the most recent and that would be October.

A closer look since mid-September (F_O_M_C) and the trend is for both to move together to the downside with individual days having either an inverse correlation or a fairly neutral correlation.

 Longer term (that's not the best phrase, but I think you know what I mean) though, the outlook for each asset is vey different. This is Gold Futures' 1-day chart with a very positive divergence on a strong timeframe. It would seem the obvious correlation would be gold is the flight to safety during the initial stages of a market decline, it may very well go on longer than that, I think that will depend a lot on F_E_D guidance regarding expectations of the first interest rate hikes and more importantly, inflation expectations.

 If you look at GLD on a 60 min chart there's a clear positive divegrence , but not a sense of the market being at an impending (as in days away) drop, this would fit with our scenario pretty well, especially given the daily chart above.

 The 30 min chart of course has more detail and looks stronger, it appears last week's dip was a head fake move that was accumulated.

The Friday afternoon action is the opposite of the market averages' afternoon action which is not surprising as intraday or day to day there's an inverse correlation, I have a feeling this is more about both assets creating a bottom, but for two different reasons, the market for the move expected to the upside, however being temporary and gold making a base for a move to the upside that is much longer and connected with a move in the market to the downside. In this light it doesn't seem that correlations between gold and SPY have flipped, but rather are just in the same process for two very different reasons.

 The GLD 5 min chart is in line, but it does not look as if it is ready to fulfill the daily chart's implications at all, at least not yet.

I'm guessing any market upside will see what most perceive to be a break in the most recent market/gold correlation and it will look like gold is in a risk off phase as the market moves up, however I think it is just the market launching from a smaller base that we are in now for a shorter move and gold remains within a bullish base for a much larger upside move that starts at the same time the market averages start to fail and make a very serious downside move.

Longer term my play would be to consider gold as a core position, but on the long side, I don't think leverage is needed, but I personally wouldn't use much more than 2x except perhaps for any initial momentum move on a major reversal in the market/ gold.


 GDX / NUGT Gold miners
 This is the correlation on a 60 min chart between the SPY and GDX (green and red respectively), it is very similar to the gold correlation, but it is more mellow on day to day inverse moves.

 You can see that more clearly when comparing GDL to GDX (green and red respectively).

 This is a 60 min chart of GDX, note the accumulation starting at the same time as the market averages', the week of the 23rd.

The 15 min chart is much sharper and shows the 4 stages (1 base, 2 mark up, 3 distribution, 4 decline) as well as a smaller rounding/reversal process, almost as if miners want to move with the market rather than base longer with gold, this may be the case as they are stocks and not an actual precious metal, I think there has to be a distinction between the two considering where we are in the long term market cycle, stocks are a lot less likely to fare as well as precious metals and are going to be moved by very different events than precious metals, namely rates and inflation.

 GDX 5 min looks like it's getting ready to make an upside run that looks to me to be much more in line with the market than with gold and as you saw with the correlation, GDX is much closer to the market than gold is.

I suspect GDX's reason for a base is somewhere between gold and the market averages', but closer to the market averages on the whole.

NUGT 1 min or GDX or 2, 3 min charts all show the same in line movement which suggests that although the base is still in place, the tactical signal for a real launch to the upside hasn't filled in yet, these intraday charts usually go very positive before the larger divergence (say the 5 min positive) launches, but this can happen within a day.

For the reasons above, I'm more inclined to look at gold as a longer term core long position with less leverage, GDX / NUGT as a shorter term position, much more like the market. I prefer NUGT to ride the move unless very strong 1, 2, 3 min chart signals form or in other words upside timing looks imminent.

Silver...
 This is the daily chart for silver futures, leading positive in to a large base, very different from the market,

ES on the dame daily chart with the exact opposite with a leading negative divegrence at a top, I think the correlation between pms and the market NEVER flipped, they just happened to overlap as one was putting in a larger base and the other came around to put in a shorter term base. Once the market moves, the inverse correlation should be very obvious again, especially as the market moves to the downside.

 SPY vs SLV (green and red respectively) showing an inverse correlation through the last year.

The 60 min chart looks like Gold or GDX, but again I think this is not because of any real inversion of the correlation due to risk factors, but two different bases overlapping for a short period of time.

 While the daily silver chart looks very strong, the 60 min is still putting itself together, I suspect it will remain in a base-like position until the market falls apart.

The intraday SLV chart looks to have seen a head fake move and accumulation of it, there's also a decent positive divegrence. I am not as confident that silver will act the same long term as gold vs the market, I have a feeling shorter term silver will act a little more like the market, perhaps similar to GDX's difference between gold and the market.

For long term core plays, I prefer gold. For shorter term long plays I prefer NUGT (GDX, but with some leverage.) This also means I'd expect stronger near term action in GDX than in gold.

Silver I'd take on a "As it comes basis".